
Published: November 24th, 2020
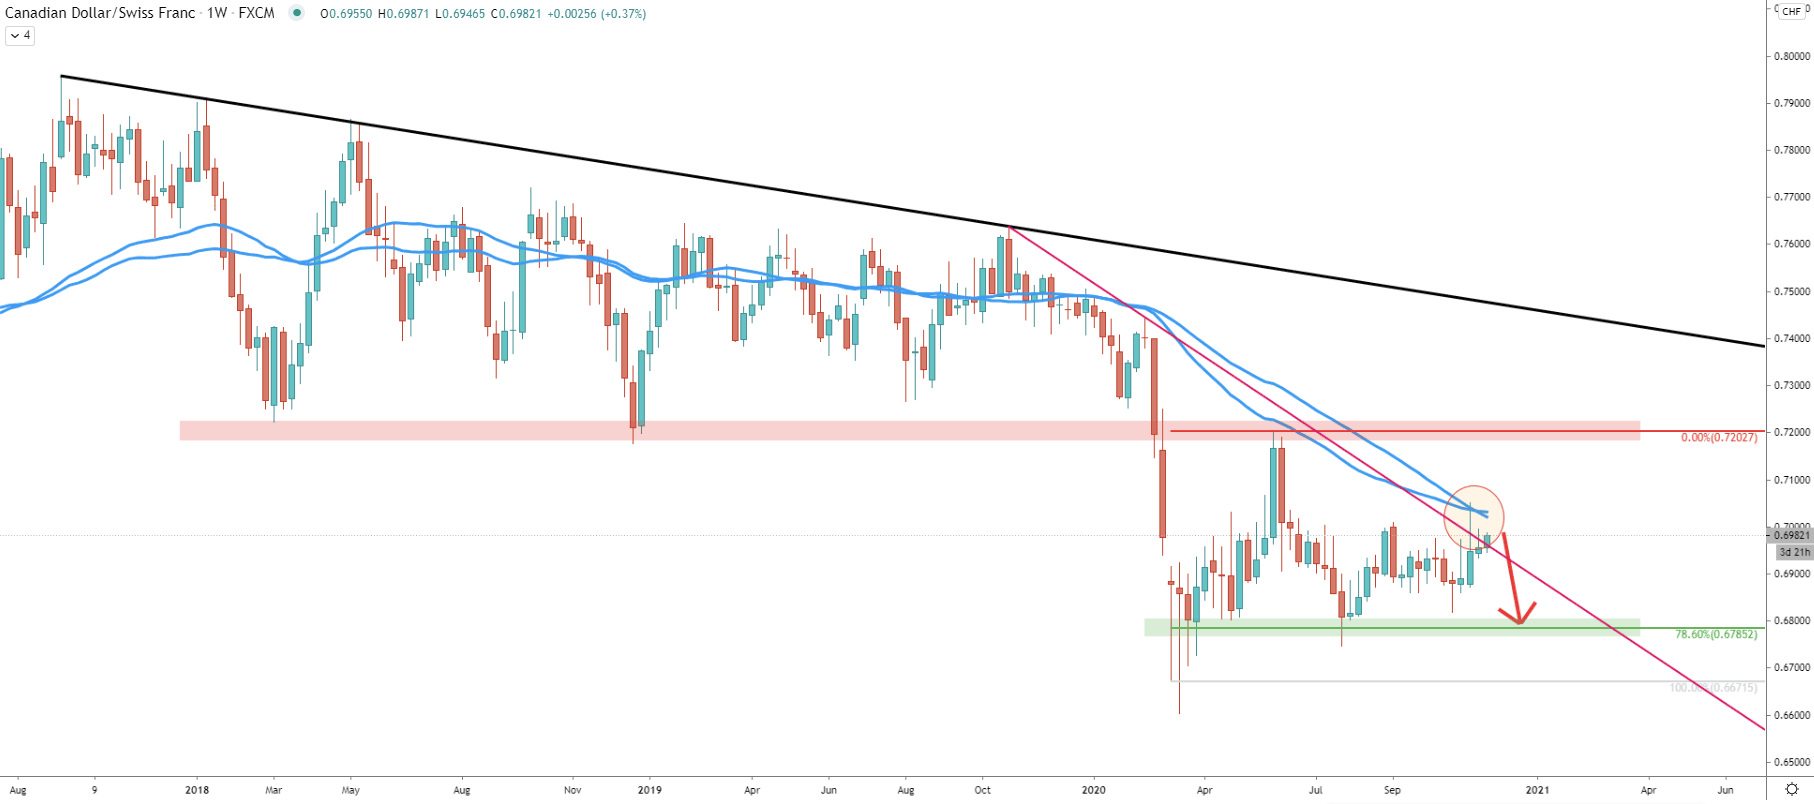
On the weekly chart CAD/CHF has rejected the downtrend trendline along with the 50 Simple and Exponential Moving Average. This goes to show, that bears remain in control and soon might increase the selling pressure.
It is quite obvious that price has formed resistance at 0.7200 psychological level, which previously has been acting as the support. On the other hand, the support has been formed near 0.6785, which is a 78.6% Fibonacci retracement level. This support already was rejected, back in June, and perhaps this is the nearest strong support, which could be tested in case of a downtrend continuation.
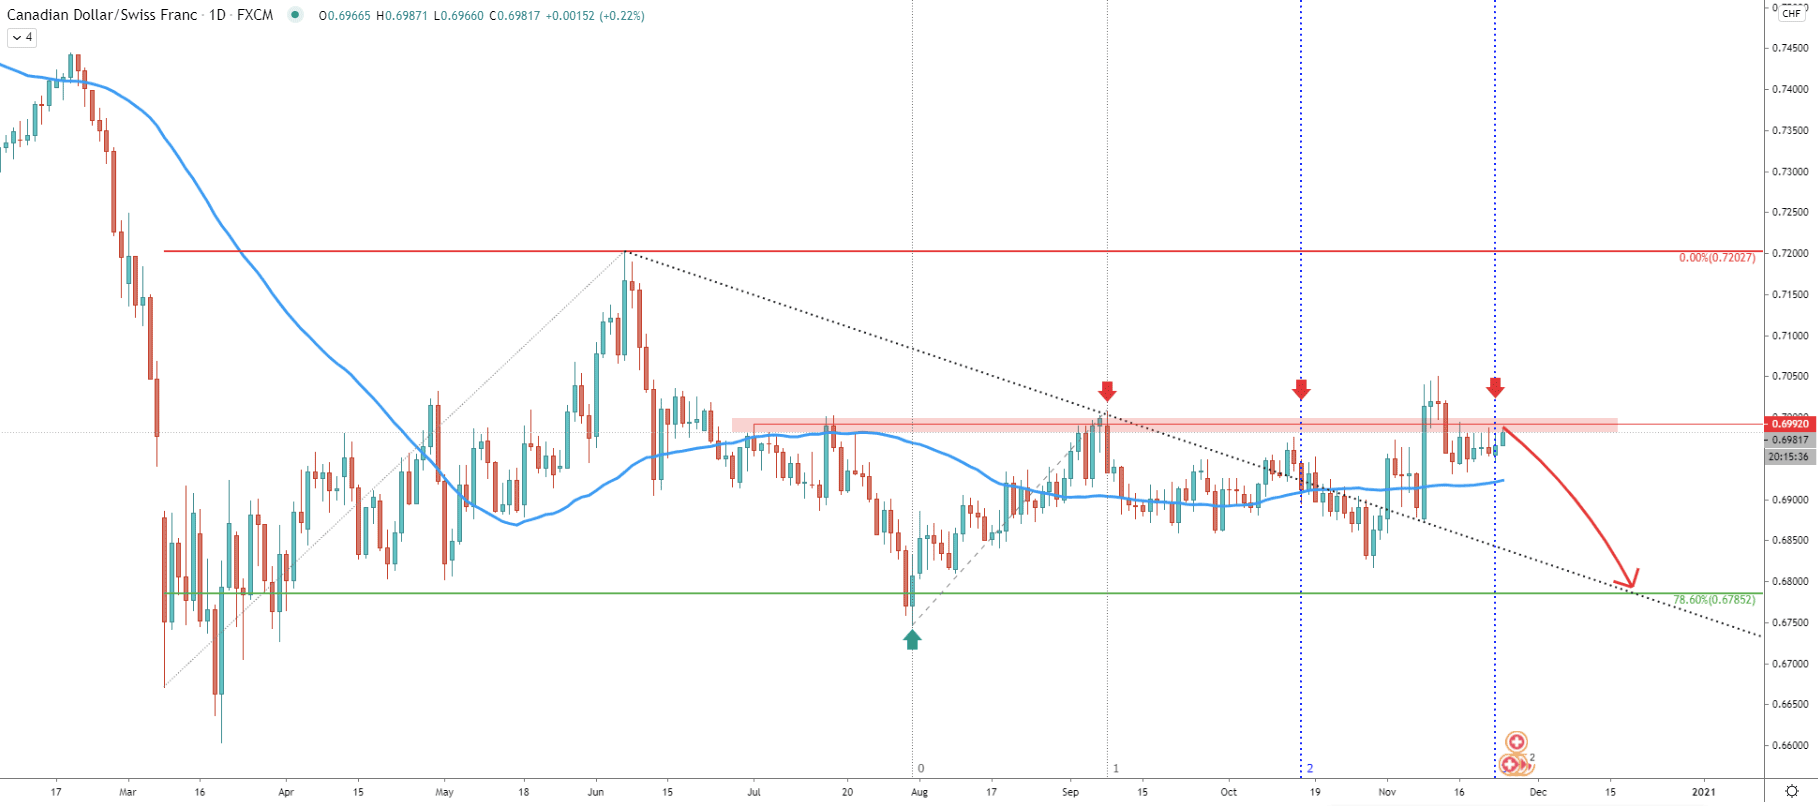
On the daily chart, the resistance area is clearly visible, which is located near 0.6992. It has already been rejected 3 times, while the last time price closed above on the daily chart, although the weekly close was below this resistance. Fibonacci cycles show, that the new cycle has just started, and considering that the price is right at the resistance, it should be very attractive for sellers.
If the price will manage to stay below the 0.7050 area, which is the recently produce high, CAD/CHF should drop by 200 pips. The downside target at 0.6785 corresponds to the downtrend trendline, which might act as support in the future. It also shows, that price can drop by 200 pips in the next 2 to 3 weeks.
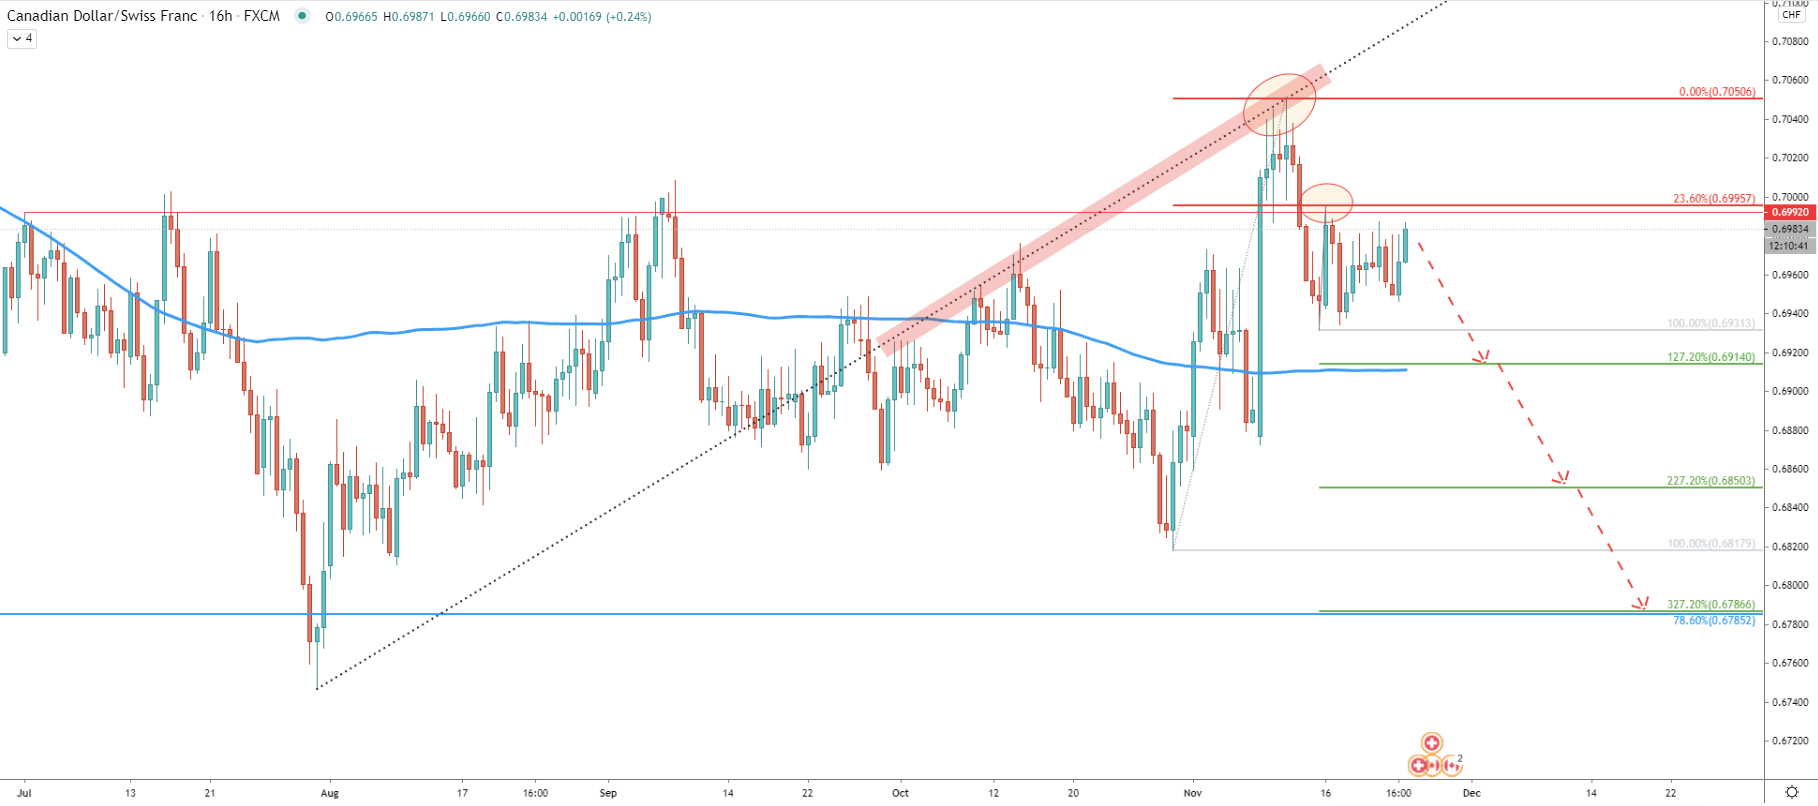
On the 16-hour chart, the uptrend trendline is consistently acting as the resistance with at least 3 rejections. The final bounce off the trendline occurred when the price tested the 0.7050 high, after which it corrected down. Recent pullback up resulted in the clear rejection of the 0.6995 level, which is a 23.6% Fibonacci retracement level. Another Fibs was applied to the pullback, and it shows that 327.2% Fibs is precisely corresponding to the previously mentioned support at 0.6786. But on the way down, other support levels must be watched, eighth for a rejection or the breakout. These are 127.2% Fibs at 0.6914, which corresponds o the 200 EMa, and 227.2% Fibs at 0.6850.
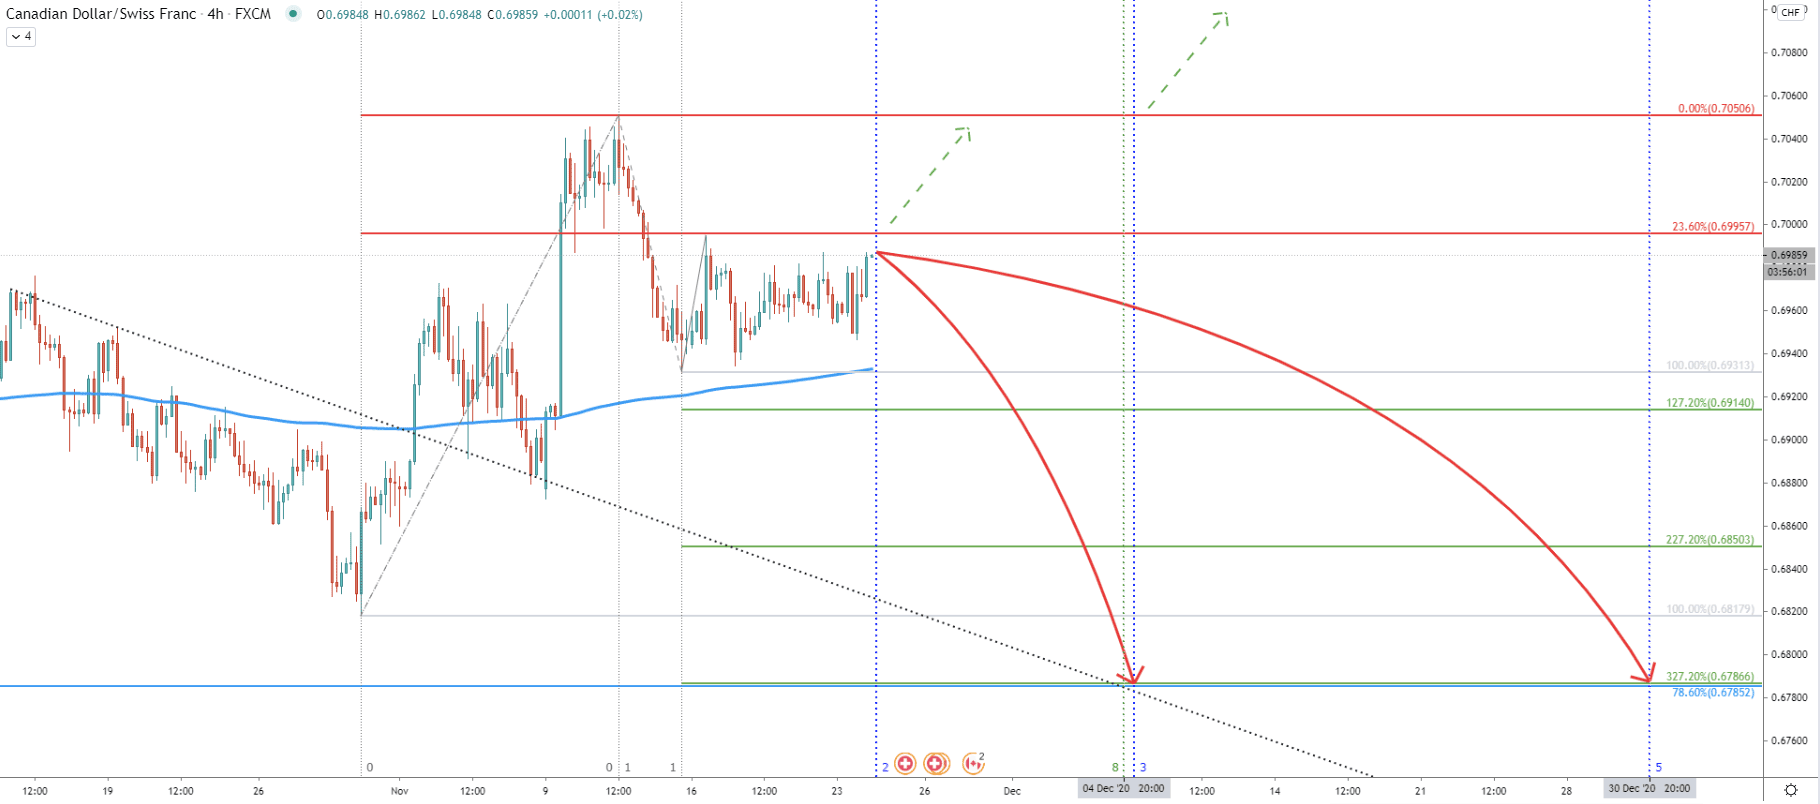
On the 4-hour chart, another Fibonacci cycles indicator was applied. Right now, CAD/CHF could be entering a new cycle, where volatility might increase due to the battle for the trend. It is possible that price will produce a spike above 0.7000 psychological resistance, although only daily break and close above will make selling opportunity less attractive.
Cycles show, that today’s price will either move up to re-test the 0.7050 resistance or will start to move down. If it will be the beginning of a downtrend, CAD/CHF could be hitting the target either on December 4 or 10 as per Fibonacci cycles.
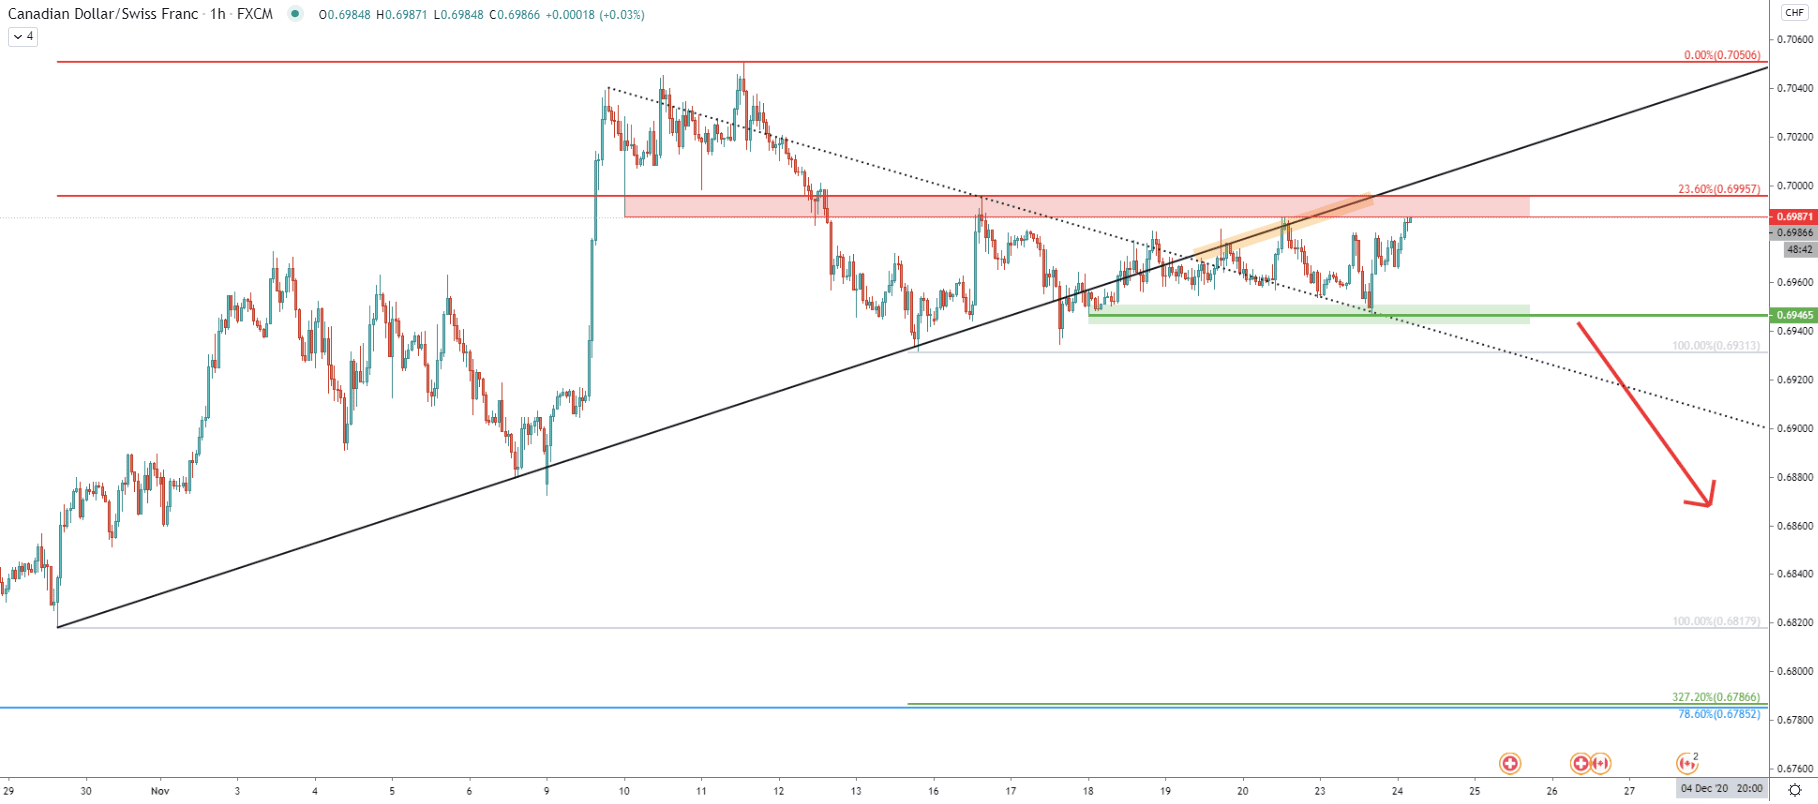
Yet another uptrend trendline is acting as the resistance, this time on the hourly timeframe. Right now CAD/CHF is trading near the resistance area, and perhaps the price will attempt to re-test the trendline before/if the downtrend will start. Another confirmation for sellers could be to break and close below the 0.6946 support, which has been formed during the past week. Up until then, CAD/CHF is likely to move slowly and consolidate between the resistance and the support trendline.
The CAD/CHF trend remains bearish as the key resistance area is being rejected on the weekly chart. While some consolidation could take place this week, selling pressure is likely to increase as long as the price remains below 0.7050. Eventually, CAD/CHF is expected to drop by 200+ pips.
As per the 4-hour chart, there are 3 target levels. Two minor levels are located at 0.6914 and 0.6850. The key support and the final downside target, confirmed by two Foibs is located at 0.6786.
Only daily break and close above the 0.7050 resistance will immediately invalidate bearish forecast and CAD/CHF long term trend might be starting to turn from bearish into bullish.
Support: 0.6946, 0.6931, 0.6914, 0.6850, 0.6786
Resistance: 0.6987, 0.7000, 0.7500