
Published: October 16th, 2020
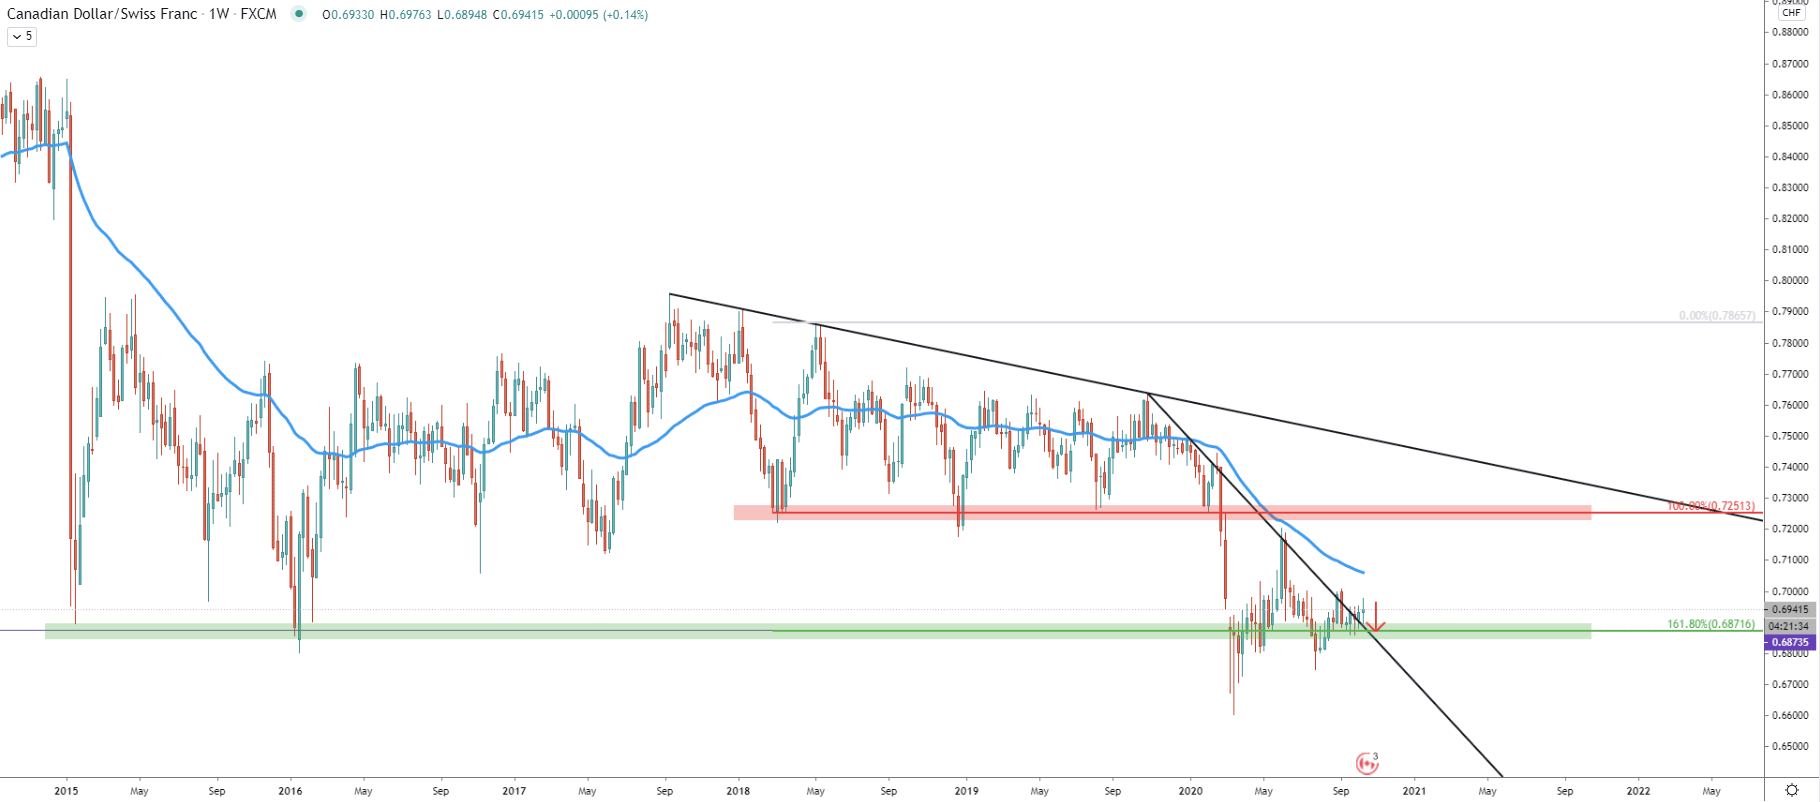
On the weekly chart, CAD/CHF is clearly trending down. In fact, the price broke below the massive support area near 0.7251 back at the beginning of this year. Since then CAD/CHF has been able to establish a new lower low, suggesting the validity of a long-term downtrend. It can be seen that the downtrend trendline has been rejected and the price remains below the 50 Exponential Moving Average. All these facts support the probability of further price decline, although the support has been also formed.
The support is located at 0.6871 and is confirmed by the 161.8% Fibonacci retracement level as can be seen on the chart. At this point, based on the analysis of the following charts, price is likely to re-test this support, before/if the major downtrend continues.
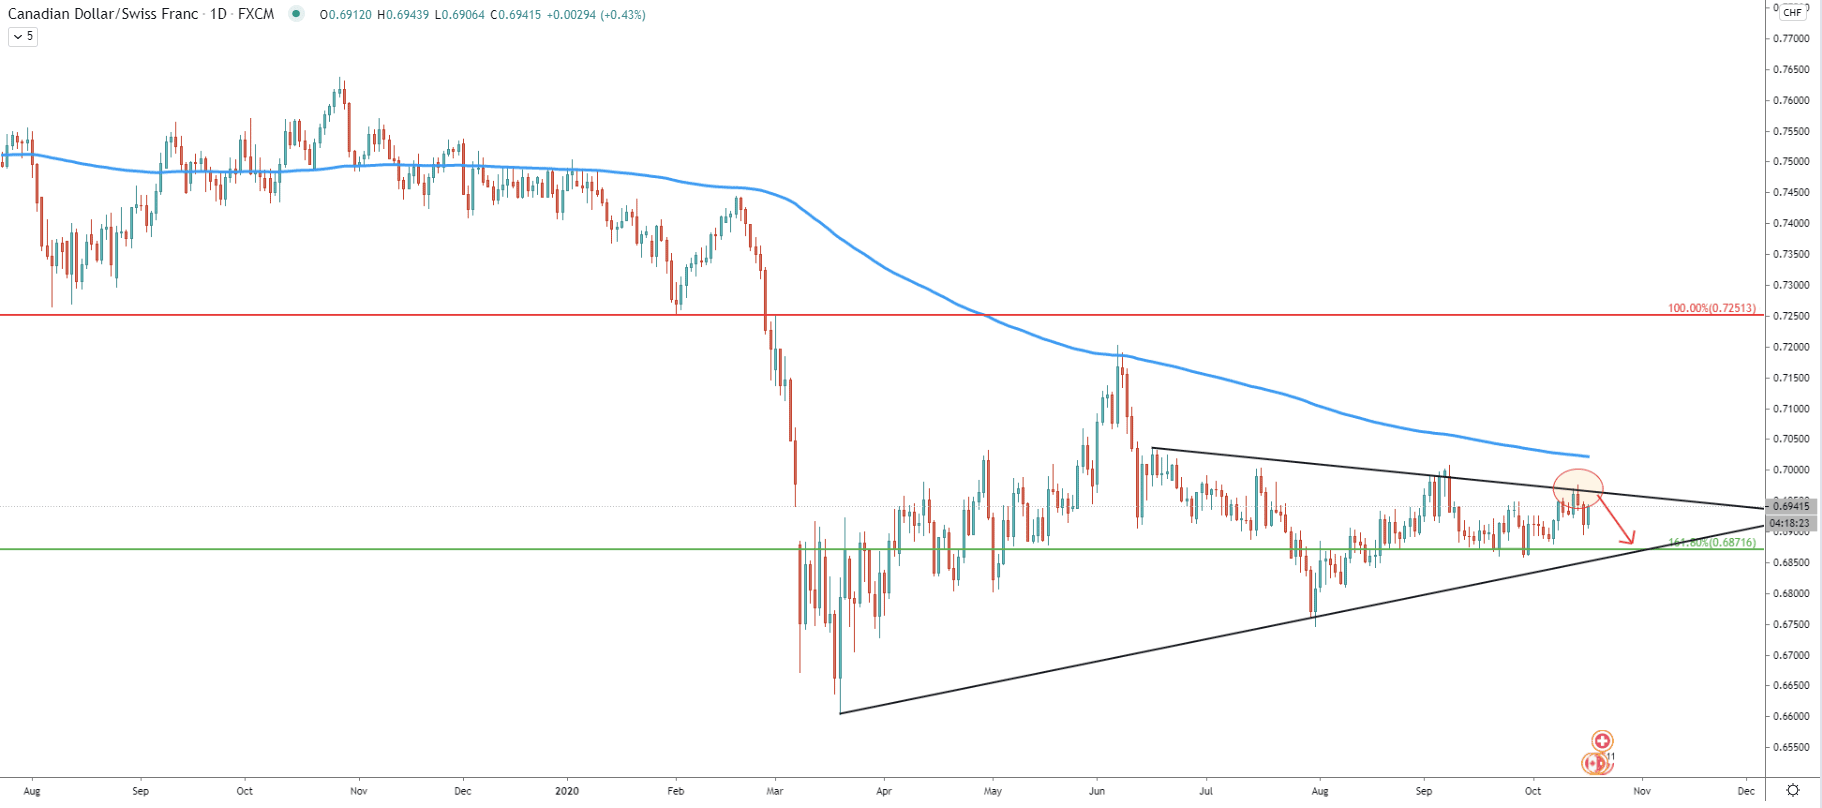
Moving on to the daily chart, the price has been stuck between the downtrend and the uptrend trendline since July of this year. Just a few weeks ago CAD/CHF has reached and rejected the downtrend trendline, which might or should result in a further price decline. Whale price stays below the 200 Exponential Moving Average, there are good chances that price will test 0.6840 support area, which also corresponds to the uptrend trendline.
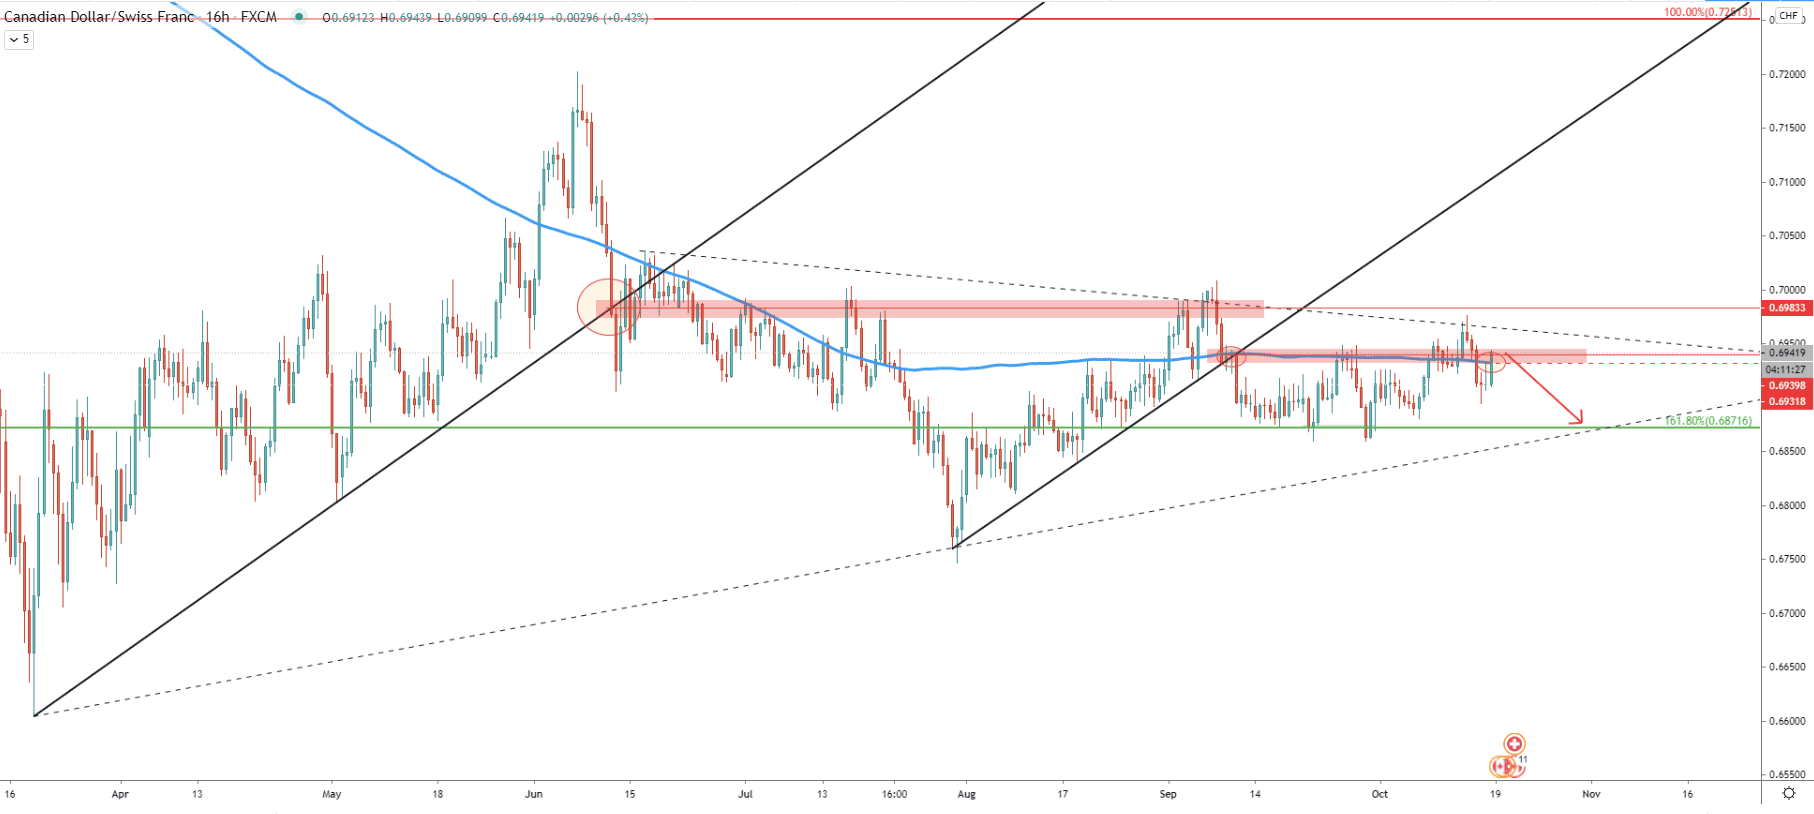
Next comes the 16-hour charts, where the price seems to be repeating the previous price action. It can be seen that back in June, CAD/CHF broke below the downtrend trendline as well as the 200 EMA. After this consolidation phase started, although in the end, it resulted in a strong downside move.
Right now it seems there is a similar scenario, where CAD/CHF broke below the downtrend trending and still continues to range. Perhaps this range-trading could have come to an end and yet another downside wave might follow. Today there was a clear rejection of the 200 EMA, where price tested the 0.6940. It will be very important to see the daily closing price today because if it will remain below 0.6940, the rejection of the Moving Average will be confirmed. In this case, sellers are likely to step in, and at the beginning of the next week, there could be a strong selling pressure for the CAD/CHF.
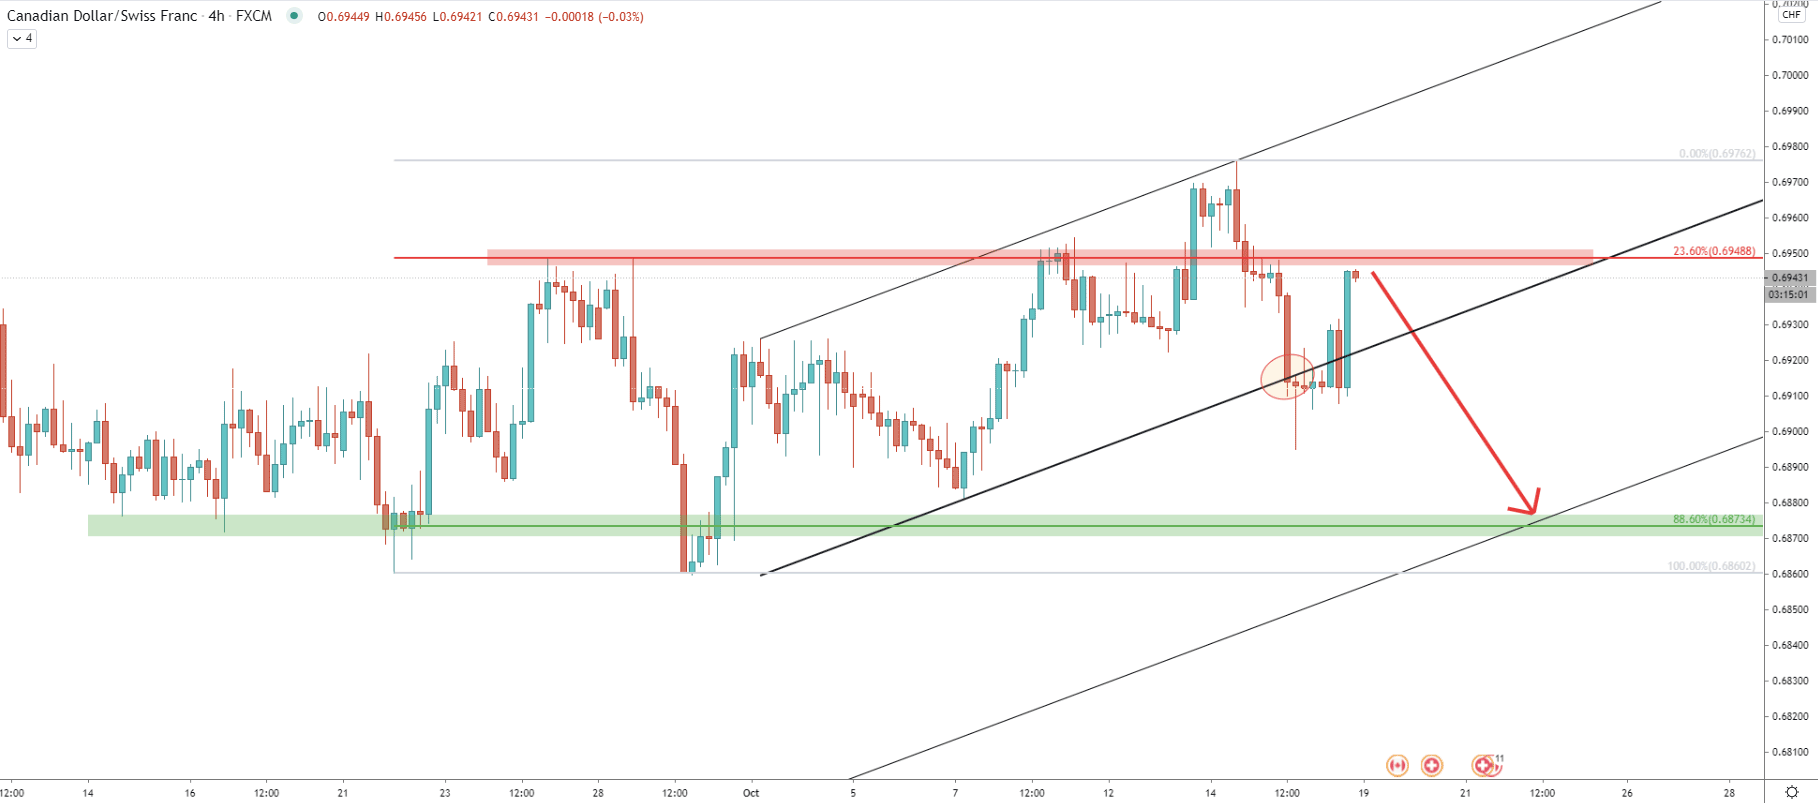
On the 4-hour chart price broke below the ascending channel and then sharply corrected up. Currently, the price has approached a strong resistance level at 0.6948, which is confirmed by the 23.6% Fibonacci retracement level. This resistance could be acting as a strong supply zone and as long as the price stays below, downtrend continuation is imminent. The previously discussed support near 0.6870, now also corresponds to the 88.6% Fibonacci retracement level as well as the bottom of the extended descending channel. Perhaps by the end of this month, there will be a strong decline produced by CAD/CHF, but only as long as the resistance is being respected.
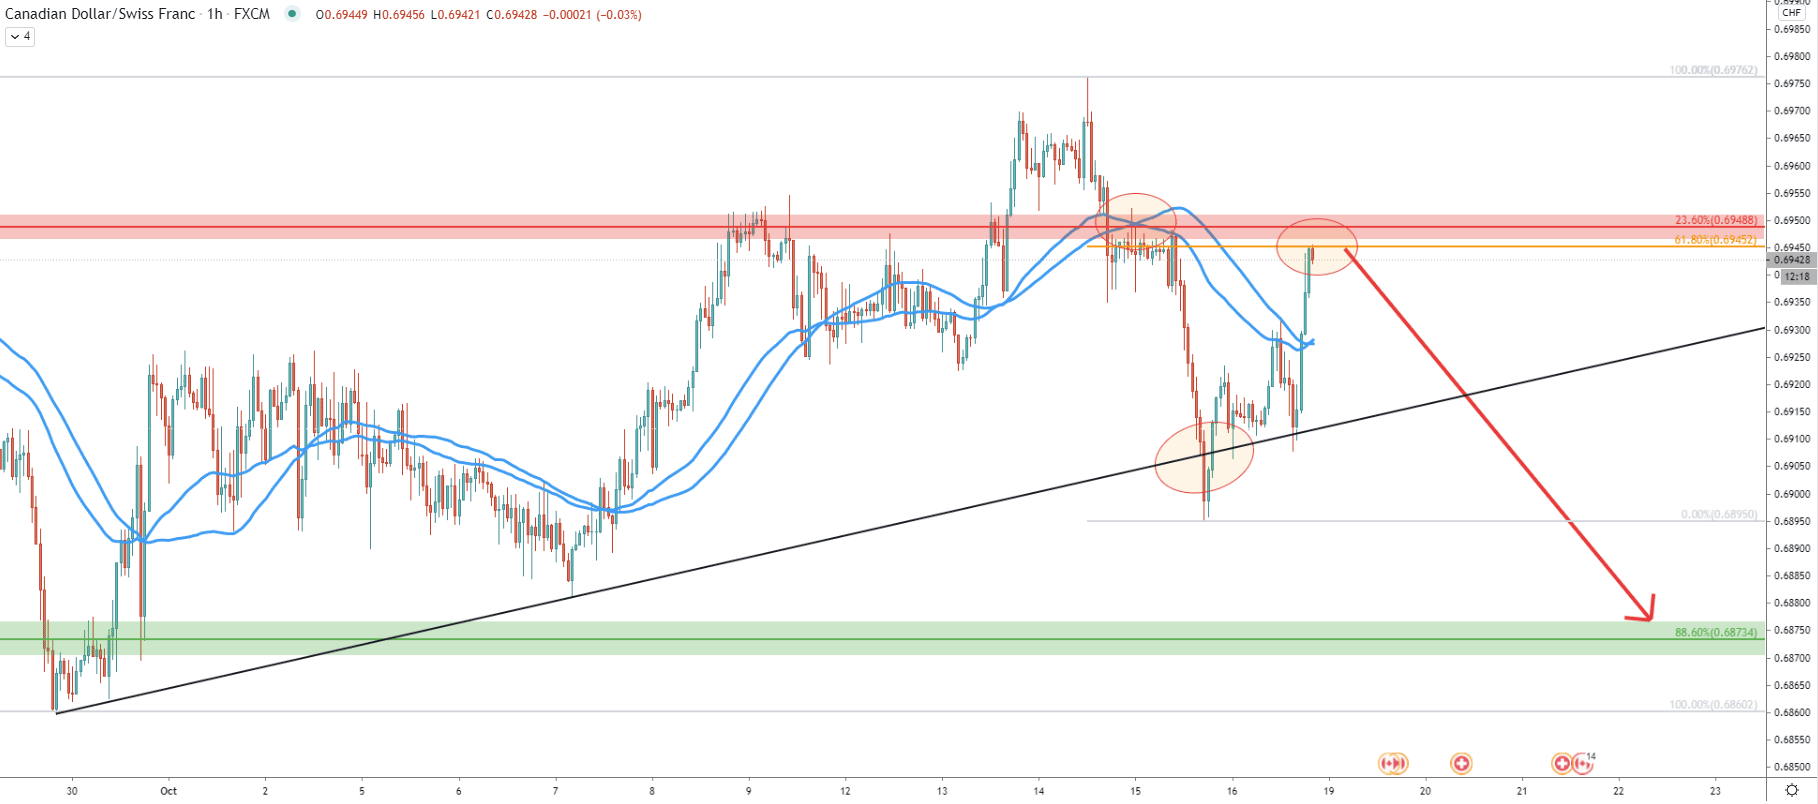
And finally, let’s observe the hourly chart. Here it can be seen that today’s price has reached and rejected the 61.8% Fibonacci retracement level at 0.6945. Prior to that CAD/CHF broke below the downtrend trendline, which was the first strong bearish signal. Considering the rejection of the resistance area, which is also confirmed by being the breakout point of both 50 Simple and Exponential Moving Average, price is highly likely to start trending down from this point onwards.
CAD/CHF is starting to look very bearish especially after today’s clean rejection of the 61.8% Fibs on the hourly timeframe. As long as 0.6945 resistance is being respected, with no daily close above this level, the downtrend should take place, which might result in the price declining by nearly 100 pips.
The key support level is located near 0.6870 and is confirmed by two Fibonacci retracement levels as per the weekly and hourly charts.
Daily break and close above the most recent resistance at 0.6950 is likely to invalidate the bearish outlook and send the price up to the 0.6976 resistance once again.
Support: 0.6895, 0.6873
Resistance: 0.6945, 0.6976


