Published: July 2nd, 2025
Amid uncertainties surrounding trade talks between the United States and key European and non-European countries before the 9th of July deadline for equivalent tariffs, French markets showed weakness on Wednesday. Investors are also analysing regional financial data, such as the French manufacturing PMI rating and news on inflation in the eurozone.
According to the European Central Bank's monthly survey statistics, short- and medium-term consumer expectations for inflation in the euro zone reduced in May as economic outlook concerns declined.
According to the ECB Consumer projections Survey, median inflation forecasts for the following 12 months decreased by 0.3 percentage points to 2.8%, while the prognosis for the next three years decreased by 0.1 percentage points to 2.4%.
According to Eurostat data, the flash estimate for Eurozone inflation on service expenses increased little in June. Annual inflation increased to 2% from 1.9% in May, again in line with forecasts.
As anticipated, core inflation, which does not include food and energy, remained constant at 2.3% in June. Monthly, the HICP increased by 0.3%. The deadline for final information is July 17.
According to S&P Global data, the HCOB France Manufacturing PMI decreased from 49.8 in May to 48.1 in June 2025; however, it was revised up from the first estimates of 47.8. This contraction was the most severe in four months.
Let's see the upcoming price projection from the CAC40 technical analysis:
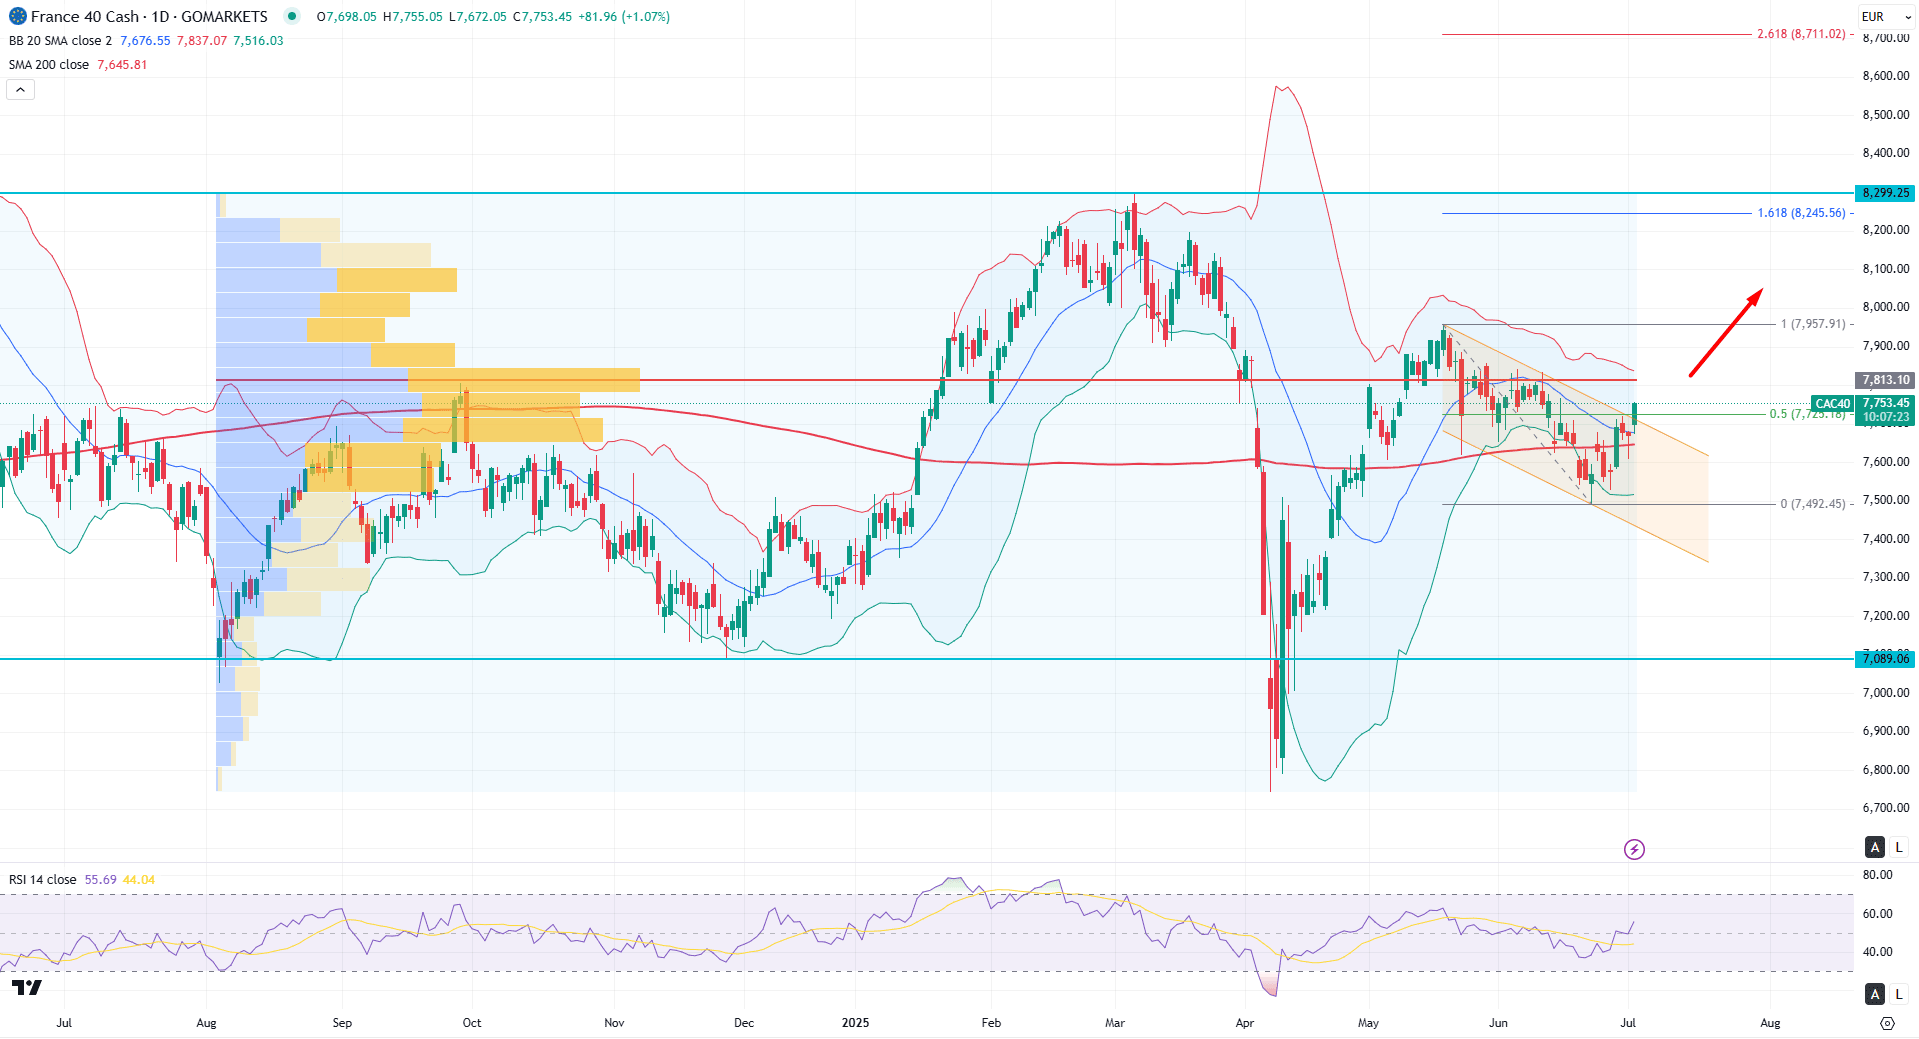
On the daily chart of the CAC 40, the most recent price action is moving sideways following a significant bullish rebound observed in April 2025. Primarily, the price is consolidating after forming a top at the 7957.91 level, which may signal a potential upward continuation.
Looking at the higher timeframe, ongoing buying pressure remains solid, as the monthly candle is consolidating after showing signs of exhaustion in April 2025. Since the price is currently moving sideways, investors might anticipate a bullish continuation following the doji candlestick pattern formed in June 2025.
The volume structure indicates a corrective phase, as the most actively traded level from August 2024 remains above the current price. However, the current price action remains bullish following the breakout from the descending channel. The high-volume level at 7813.10 may act as a strong resistance. If the price breaks above this static high-volume level, it could confirm a continuation of the bullish trend.
On the main price chart, the 200-day simple moving average is providing immediate support, suggesting a possible long-term bullish continuation. Additionally, the price has found support at the lower Bollinger Band, indicating a clear bullish recovery. The sideways market structure with a newly formed swing high also points to a potential return to the mid-Bollinger Band level, further validating the long-term bullish outlook.
In the secondary indicators, the Relative Strength Index (RSI) has formed a bullish rebound and is now trading above the neutral 50.00 level. Since it recently bounced from the oversold 30.00 level, the RSI is more likely to move toward the overbought 80.00 area.
Based on the daily market outlook, a high-probability long opportunity may arise after a confirmed breakout above the 7813.10 level with a daily close. If that occurs, the price may extend higher and test the 8245.56 level, which aligns with the 161.8% Fibonacci extension.
Furthermore, a break above the 7957.91 resistance level, followed by a consolidation, could provide another long opportunity targeting the 8299.25 level.
On the other hand, failure to hold the price above the channel resistance could pose a challenge for bulls. In that case, a bearish recovery with a daily close below the 50-day moving average could extend the correction toward the 7400.00 psychological level.
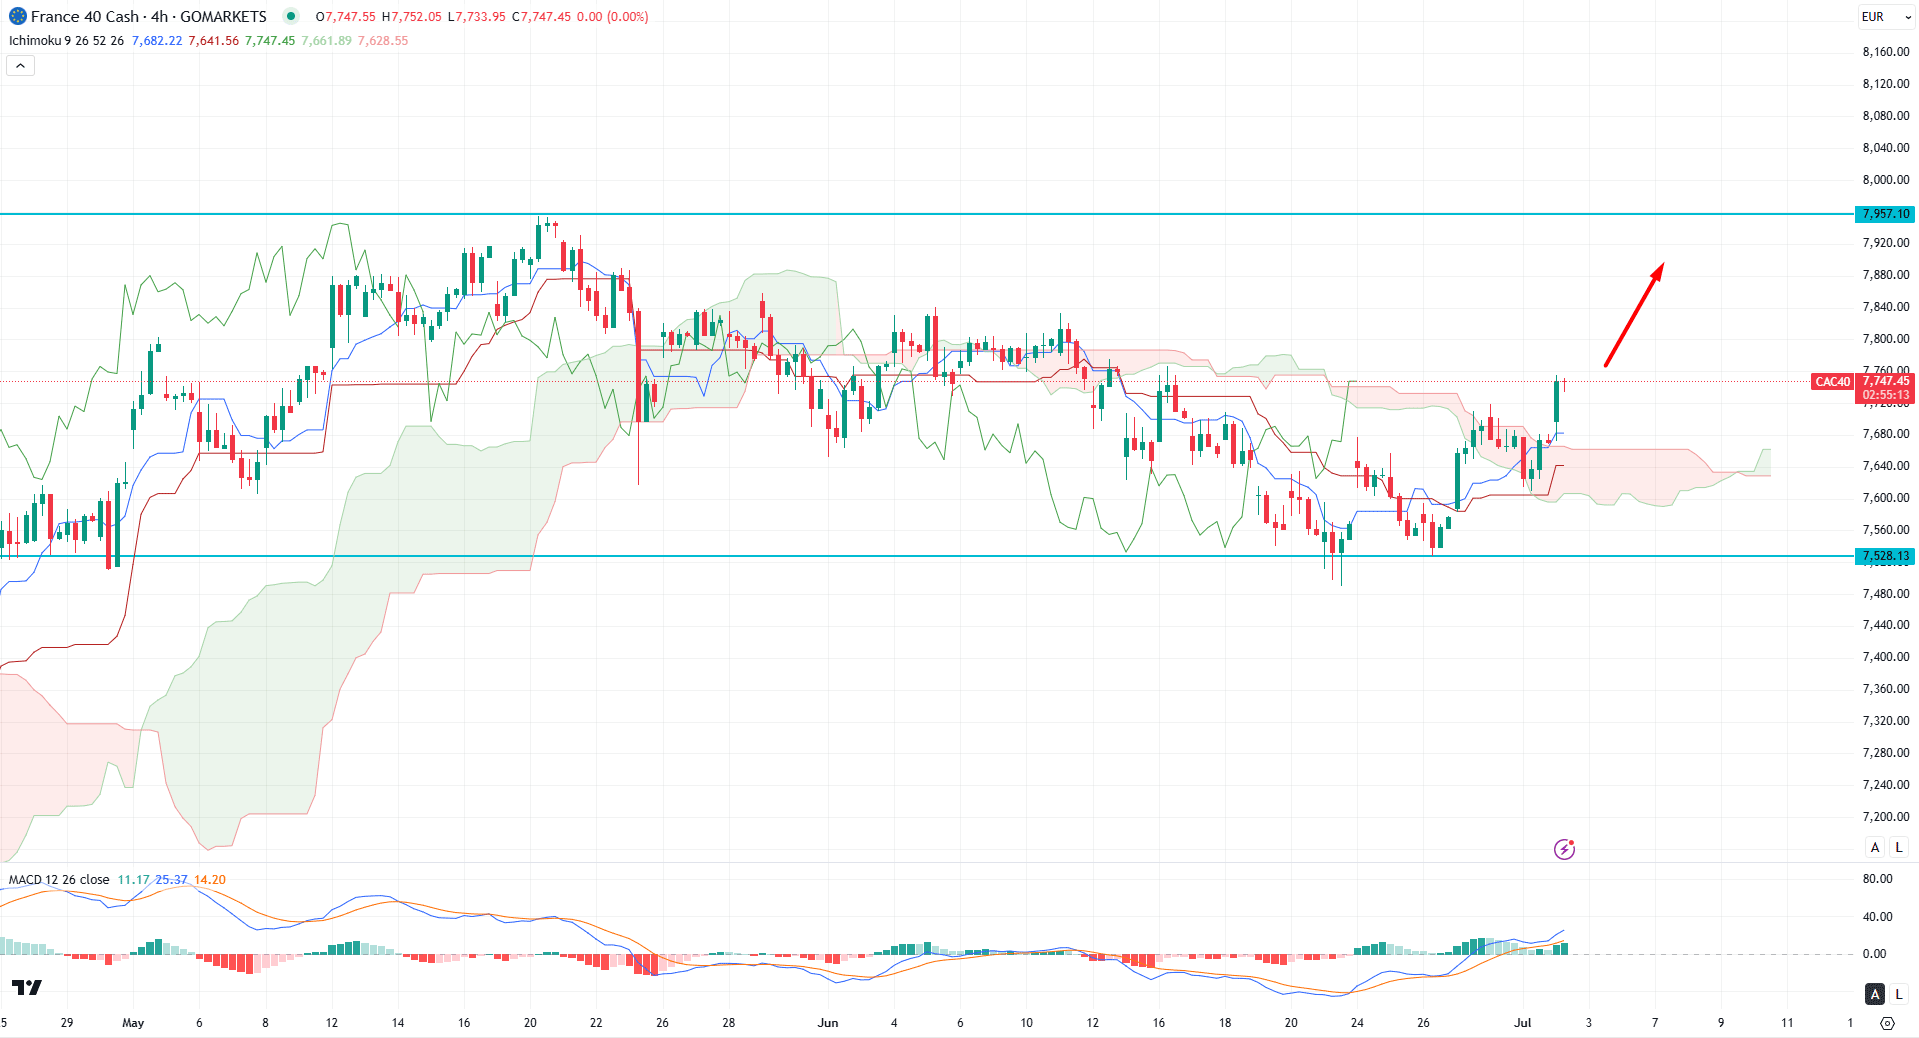
In the H4 timeframe, the recent price showed a bullish recovery after corrective bearish momentum. Primarily, the bullish break with an H4 close above the cloud zone signals a possible upward extension. The future cloud has flipped the position, where the current Senkou Span A is above the Senkou Span B.
In the secondary indicator window, the MACD signal line showed a bullish continuation as the Signal line kept moving higher. Moreover, the MACD Histogram maintained the positive momentum as the current Histogram showed a stable position in the positive zone.
Based on the 4-hour market outlook, the bullish momentum above the cloud zone could offer an immediate long opportunity, targeting the 7850.00 level.
However, a minor downside correction is pending, and the Kijun Sen would be the first level to examine. A bullish continuation is possible as long as the price holds above the cloud zone. Selling pressure with an H4 close below the 7528.13 level might lower the price towards the 7350.00 level.
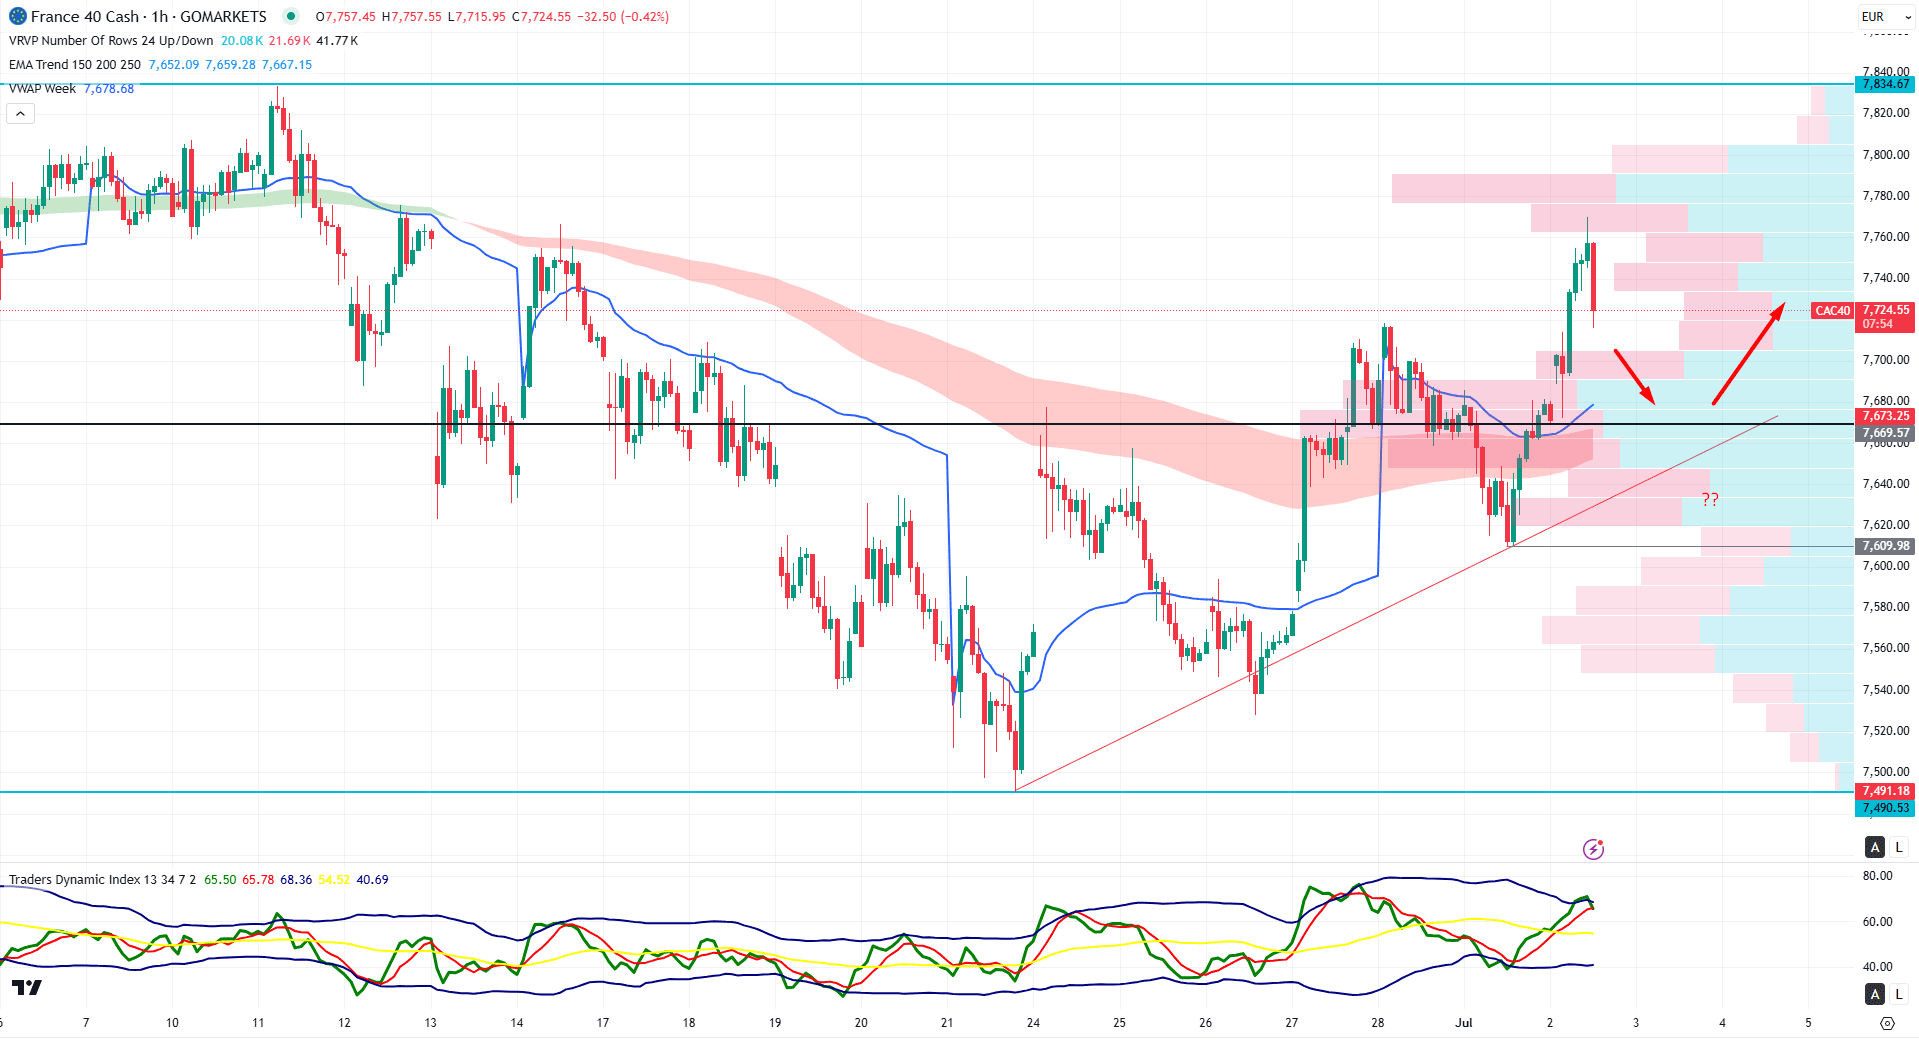
In the hourly chart of CAC 40, an intraday downside pressure is visible after setting a top at the 7769.85 level. As a result, the gap between the current price and weekly VWAP has expanded, suggesting a pending downside correction.
Moreover, the major market trend remains bullish as the MA wave is below the current price with a bullish slope, while the visible range high volume line is acting as a crucial support.
In the indicator window, buying pressure is limited as the Traders Dynamic Index (TDI) has reached the upper band area.
Based on this outlook, a minor downside correction might offer a short opportunity, targeting the 7669.57 static line. However, any bullish rebound from the VWAP line of the MA wave zone could be a long opportunity.
Based on the current multi-timeframe analysis, CAC 40 is more likely to extend the major bullish trend, which needs a proper validation from the lower timeframe price action. Investors should keep a close eye on the H4 chart as a rebound from the dynamic support area could be a long signal.


