
Published: August 28th, 2025
The US dollar (USD) remains strong amid growing concerns about the independence of the US Federal Reserve (Fed), while the price of gold denominated in dollars struggles.
The price of gold, however, may recover due to a rise in demand for safe-haven assets. Traders assess the latest news reports on the escalating conflict between the Federal Reserve and US President Donald Trump.
It has been reported that Fed Governor Lisa Cook may sue to challenge the decision by US President Donald Trump to fire her. During a Tuesday Cabinet meeting, Trump stated that he is willing to follow any court ruling but that Cook's challenge does not worry him.
Given Trump's continued pressure on the Fed to lower borrowing costs, the firing of Federal Reserve Governor Cook may increase the likelihood of significant interest rate reductions, which would attract buyers to non-interest-bearing investments like gold. It is essential to note that investors may opt for precious metals to generate higher returns when interest rates decline.
According to the CME FedWatch indicator, traders are currently pricing in odds of a drop of at least a quarter-point at the Fed's September session. Attention will turn to the Fed's favored inflation indicator, the July Personal Consumption Expenditures Price Index, which is expected later this week.
Let's see the complete price direction from the XAUUSD technical analysis:
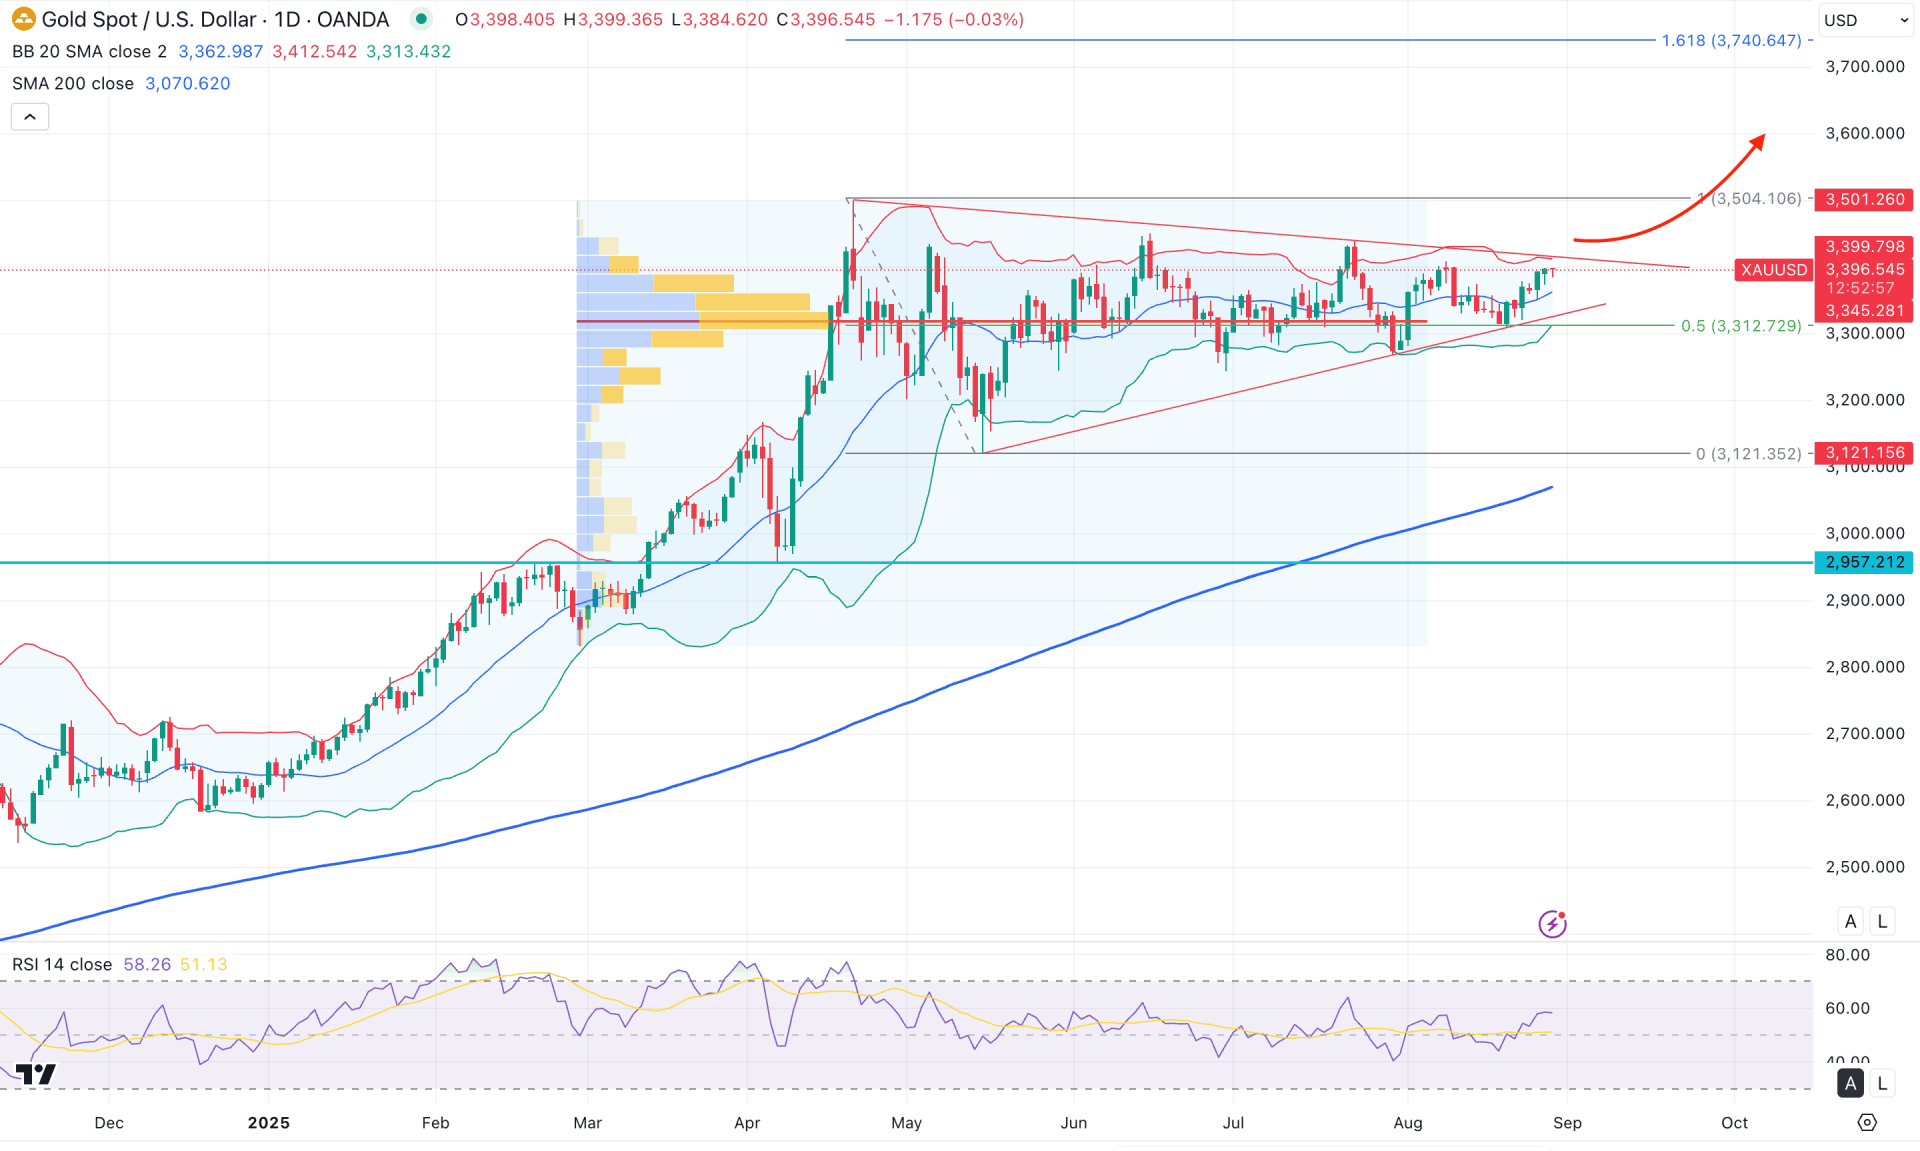
In the daily chart of XAUUSD, bearish momentum is clear as the price shows no solid downside recovery from the April 2025 peak. The most recent price action is moving sideways within a symmetrical triangle, where any breakout in line with the market trend could present a significant trading opportunity.
In the higher timeframe, the price reflects extreme corrective pressure, with no meaningful movement after the April 2025 close. Following the positive market close, the price consolidated sideways and formed three consecutive Gravestone Dojis, which signal strong indecision at the top. The overbought condition, combined with the lack of fundamental support for sellers, highlights indecision for three consecutive months. A similar outlook is also visible in the monthly and weekly charts, where the recent candles show no strong price action at the top.
Looking at the volume structure, the largest activity level since March 2025 is near the current price and within the ongoing range. This suggests an accumulation phase at the top, where both manipulation and validation phases are still pending before the trend continuation can be confirmed.
On the main price chart, the Bollinger Bands indicator has flattened after peaking at the 3504.10 level, signaling sideways market momentum. Instead of sustaining a downside recovery, the price repeatedly failed to hold below the lower Bollinger Band and formed multiple bullish reversals. Recently, a bullish breakout from the higher volume level is evident, with multiple daily candles closing above the mid-Bollinger Band. Although the overall trend remains corrective, this recovery suggests a potential bullish continuation as long as the price stays above the mid-line.
In the broader market structure, the 200-day Simple Moving Average (SMA) has remained below the current price throughout the year, with the gap between them widening. Supporting this outlook, the Relative Strength Index (RSI) is holding between the 50.00 and 70.00 levels, indicating sustained bullish momentum. As long as the RSI stays above the 50.00 neutral line, we can expect buying pressure to maintain momentum.
Based on this outlook, XAUUSD remains bullish if a breakout occurs above the triangle resistance. A daily close above the 3414.23 Bollinger Band high would validate a long opportunity targeting the 3500.00 psychological level. Furthermore, the 161.8% Fibonacci extension from the April–May swing stands at 3740.64, which could act as the ultimate bullish target.
On the other hand, the price remains confined within the symmetrical triangle, with liquidity concentrated both above and below its boundaries. A potential dip below the 3312.72 level, followed by an immediate recovery above the mid-Bollinger Band, could also provide another long opportunity. However, if extended selling pressure leads to consolidation below the 3200.00 level, further losses could follow, with the 200-day SMA acting as the next key support before another long setup emerges.
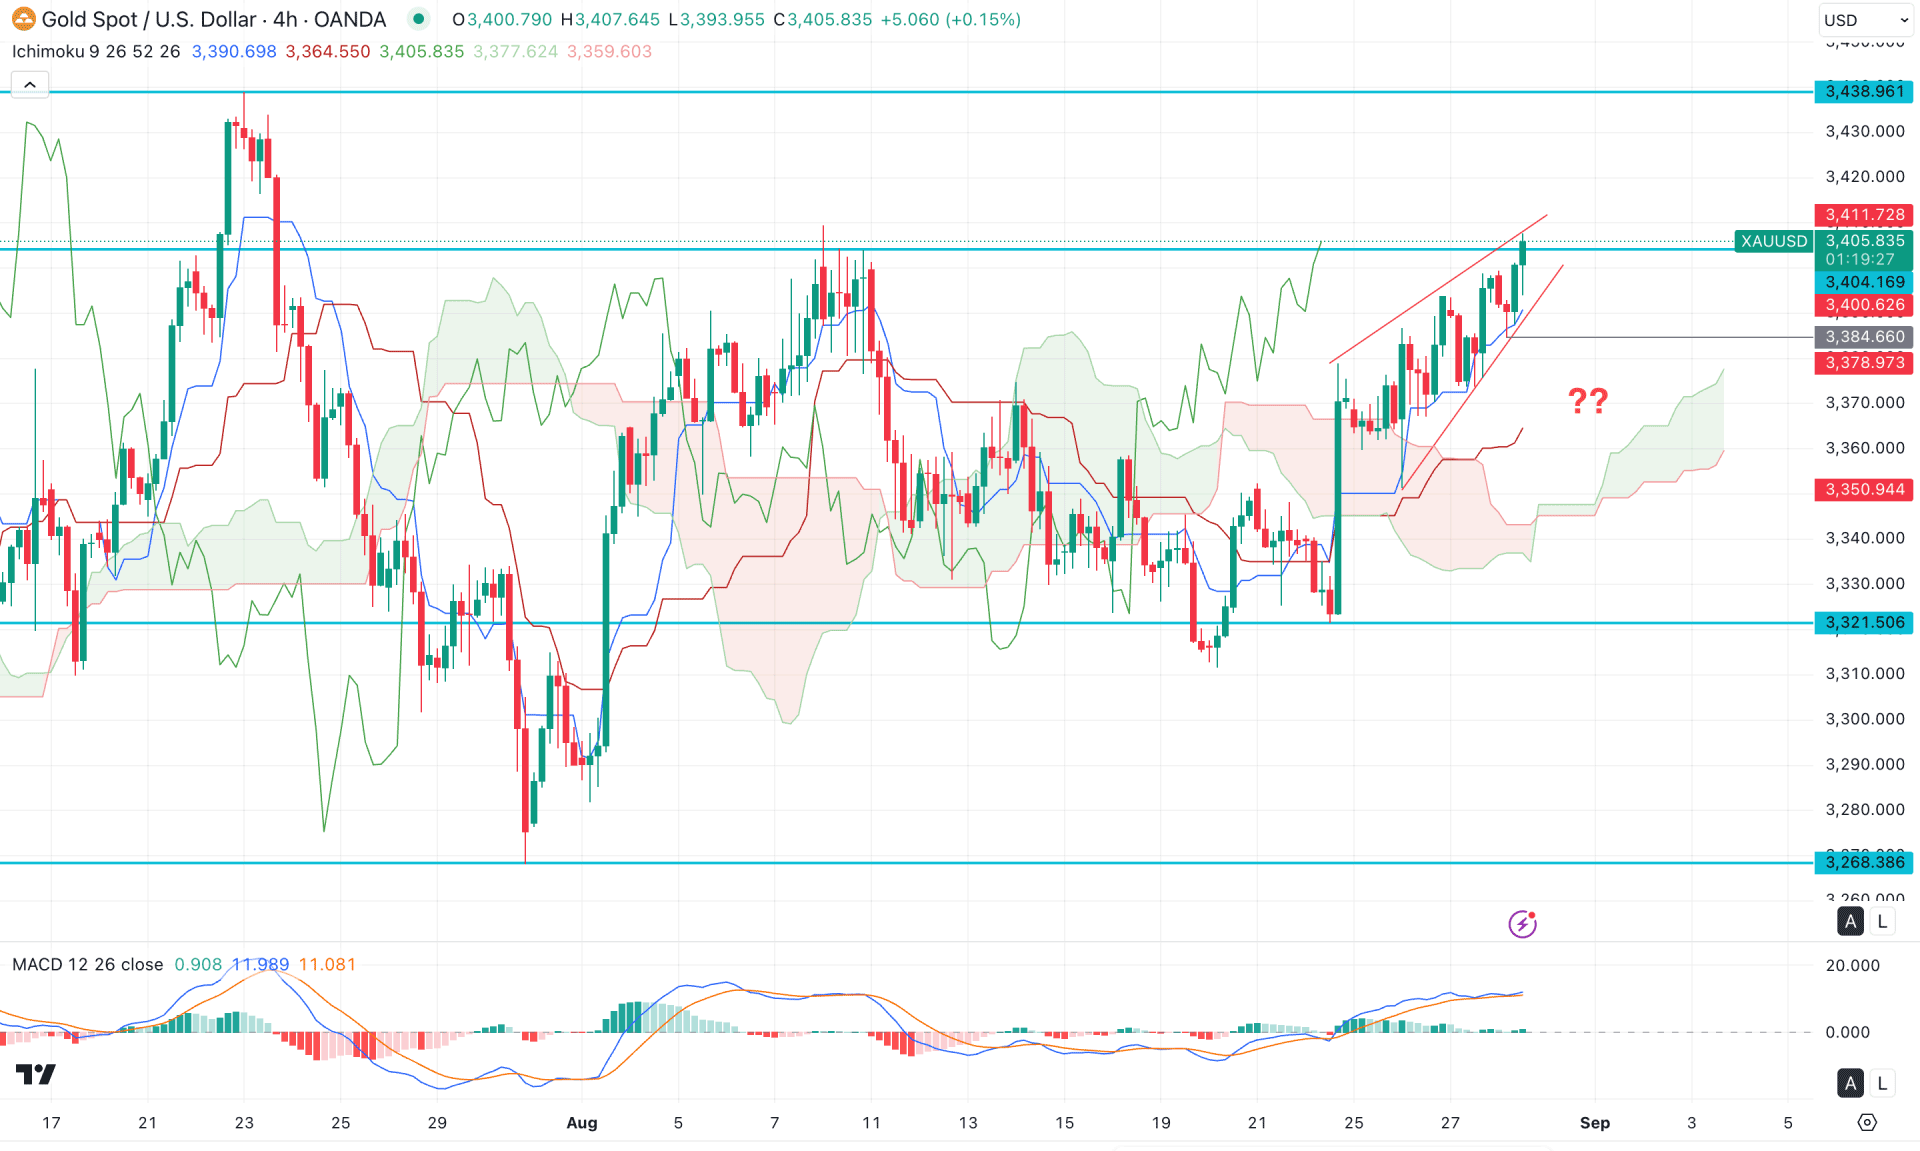
In the four-hour timeframe, a bullish breakout with a strong H4 close above the cloud area signaled a potential trend reversal on 23 August 2025. As a result, the price retested the cloud area as support before continuing higher above the 3400.00 psychological level. However, monitoring the buying pressure reveals high volatility, which is a primary sign of a trend reversal.
In the future cloud, both lines are aiming higher, signaling ongoing buying pressure. However, the MACD signal line has reached the top above the neutral area and turned flat. Moreover, the MACD histogram failed to sustain the buying momentum and has moved closer to the neutral point.
Based on this outlook, investors should remain cautious before opening long positions above the 3400.00 psychological level, as it is a crucial resistance zone. The ongoing corrective buying pressure within a rising wedge pattern suggests a possible bearish correction, but confirmation is needed. In that case, a break below the 3384.53 support level could increase the bearish opportunity towards the 3360.00 area.
However, the major bullish market structure will remain intact as long as the price trades above the dynamic Kijun Sen. On the bullish side, support could work as a strong liquidity zone, as a false break below this level followed by an immediate recovery could extend momentum towards the 3438.96 resistance level.
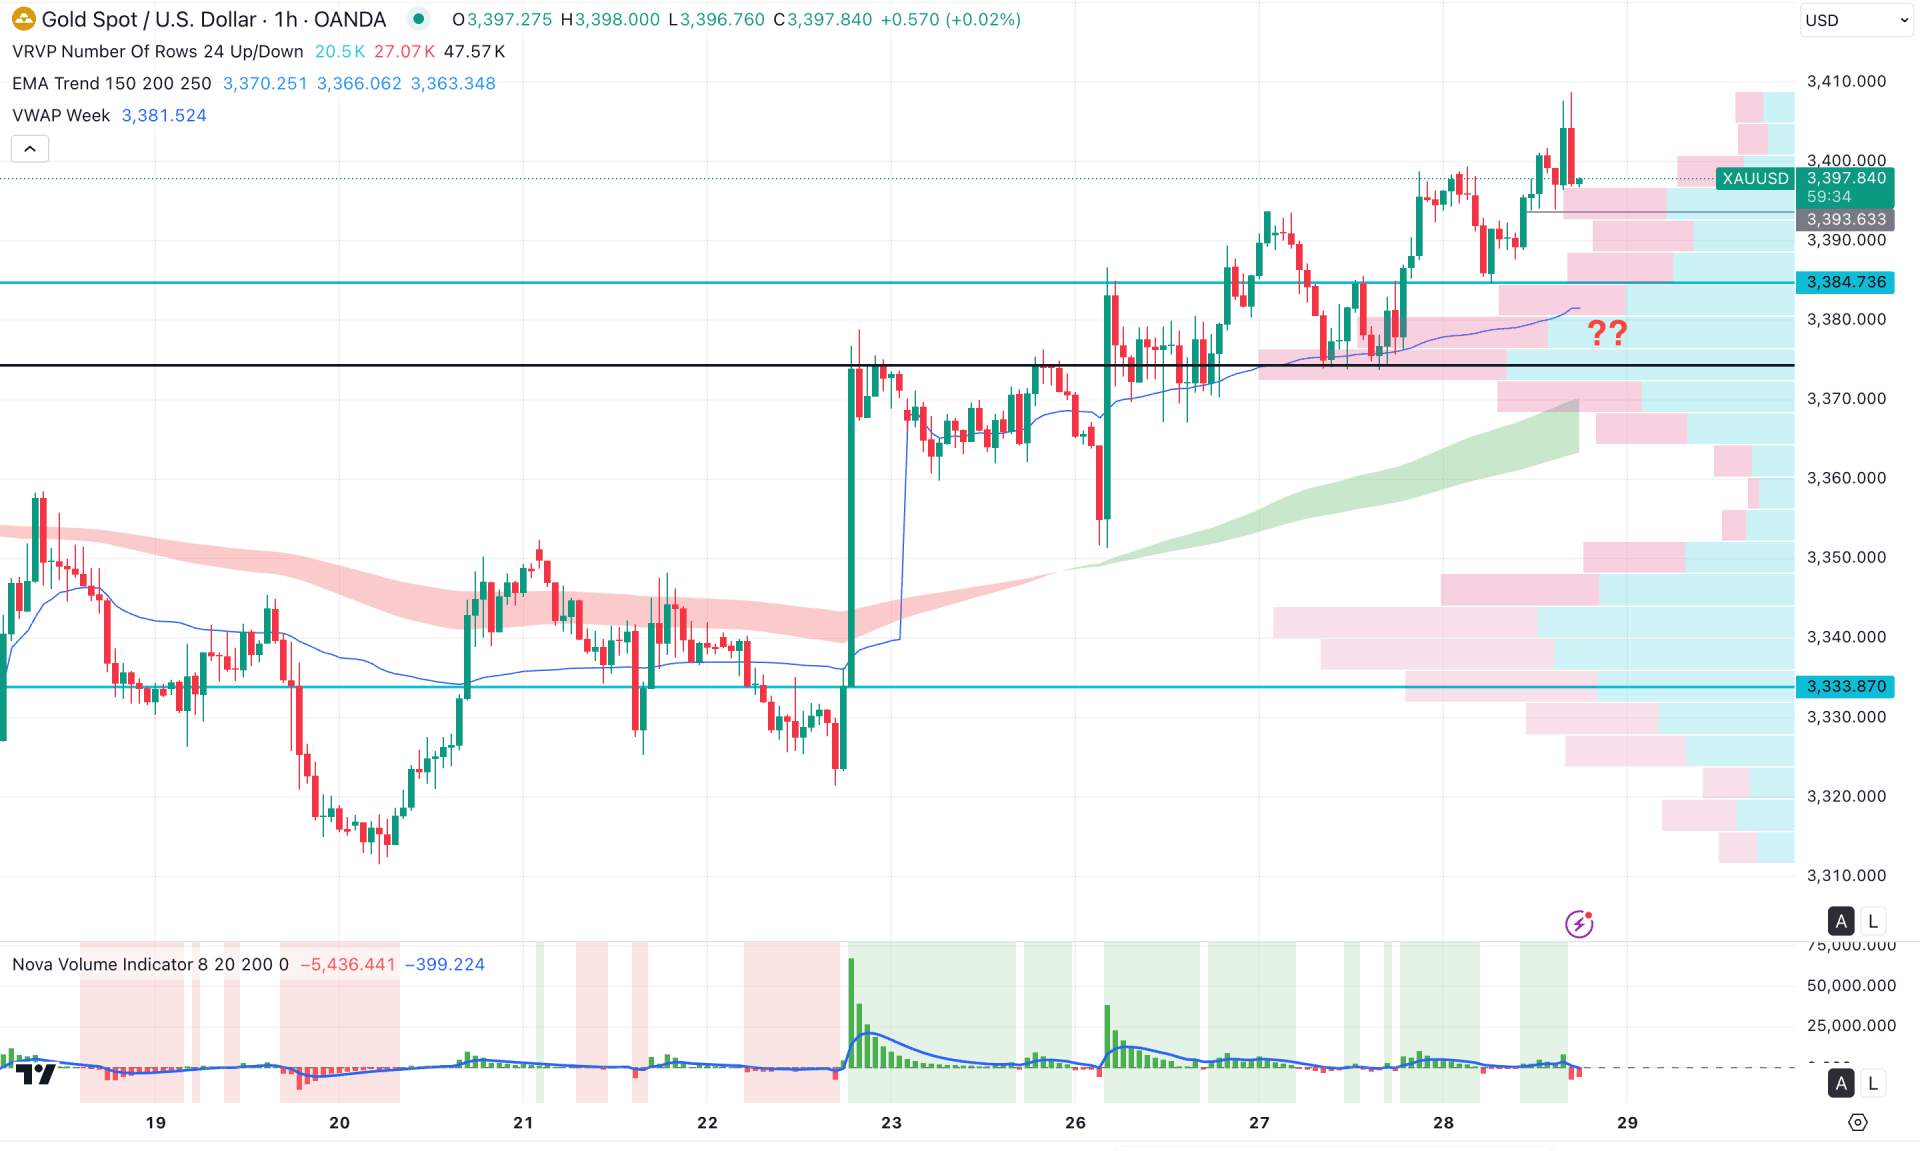
In the hourly timeframe, ongoing bullish pressure is present, although the current momentum appears highly corrective. While the price is trading higher, it is positioned well above the moving average wave and the weekly VWAP line. As a result, a potential downside correction is possible before the price continues rising further after reaching a key divergence level.
In the secondary indicator window, the volume histogram suggests a divergence with the main price action, as the volume failed to follow the price by creating new highs. This indicates a potential discrepancy in the ongoing bullish momentum, suggesting that a considerable downside correction may occur soon.
Based on the broader market outlook, investors should closely monitor how the price reacts around the 3400.00 area, which is a crucial resistance level. Failure to hold above this line could trigger a minor downside correction towards the 3384.00 level. However, a break below the 3384.00 level could lead to a major market reversal towards the 3340.00 area.
Based on the overall market structure, XAUUSD is trading within a bullish trend from where more upward pressure could come after the daily breakout. As the intraday price is aiming higher, a downside recovery is pending from where an early long opportunity might open.


