
Published: September 1st, 2021
BitTorrent is one of the popular P2P file-sharing platforms that became popular in recent years. This project was started in 2001 and was purchased by the blockchain platform TRON in 2018. Since the acquisition, BTT has got several improvements like a dedicated native token and launch on the TRC-20 blockchain.
People behind BitTorrent are famous in the crypto industry, and the main aim is to create a revolution in the entertainment industry, which is currently slow and expensive. However, this platform has faced several legal battles from copyright laws in allowing people to share music and movies among them.
In the early 2000s, BitTorrent was the biggest P2P file sharing platform that expanded its user appeal in the decentralised work with the hand of TRON. In the price chart, the most significant movement comes during the 2021 post-pandemic market recovery, where the price reached 0.01357, which is the all-time high level. However, the price crashed following the broader crypto ban, which is currently recovering.
Let’s see the upcoming price direction from the BTT/USDT technical analysis:
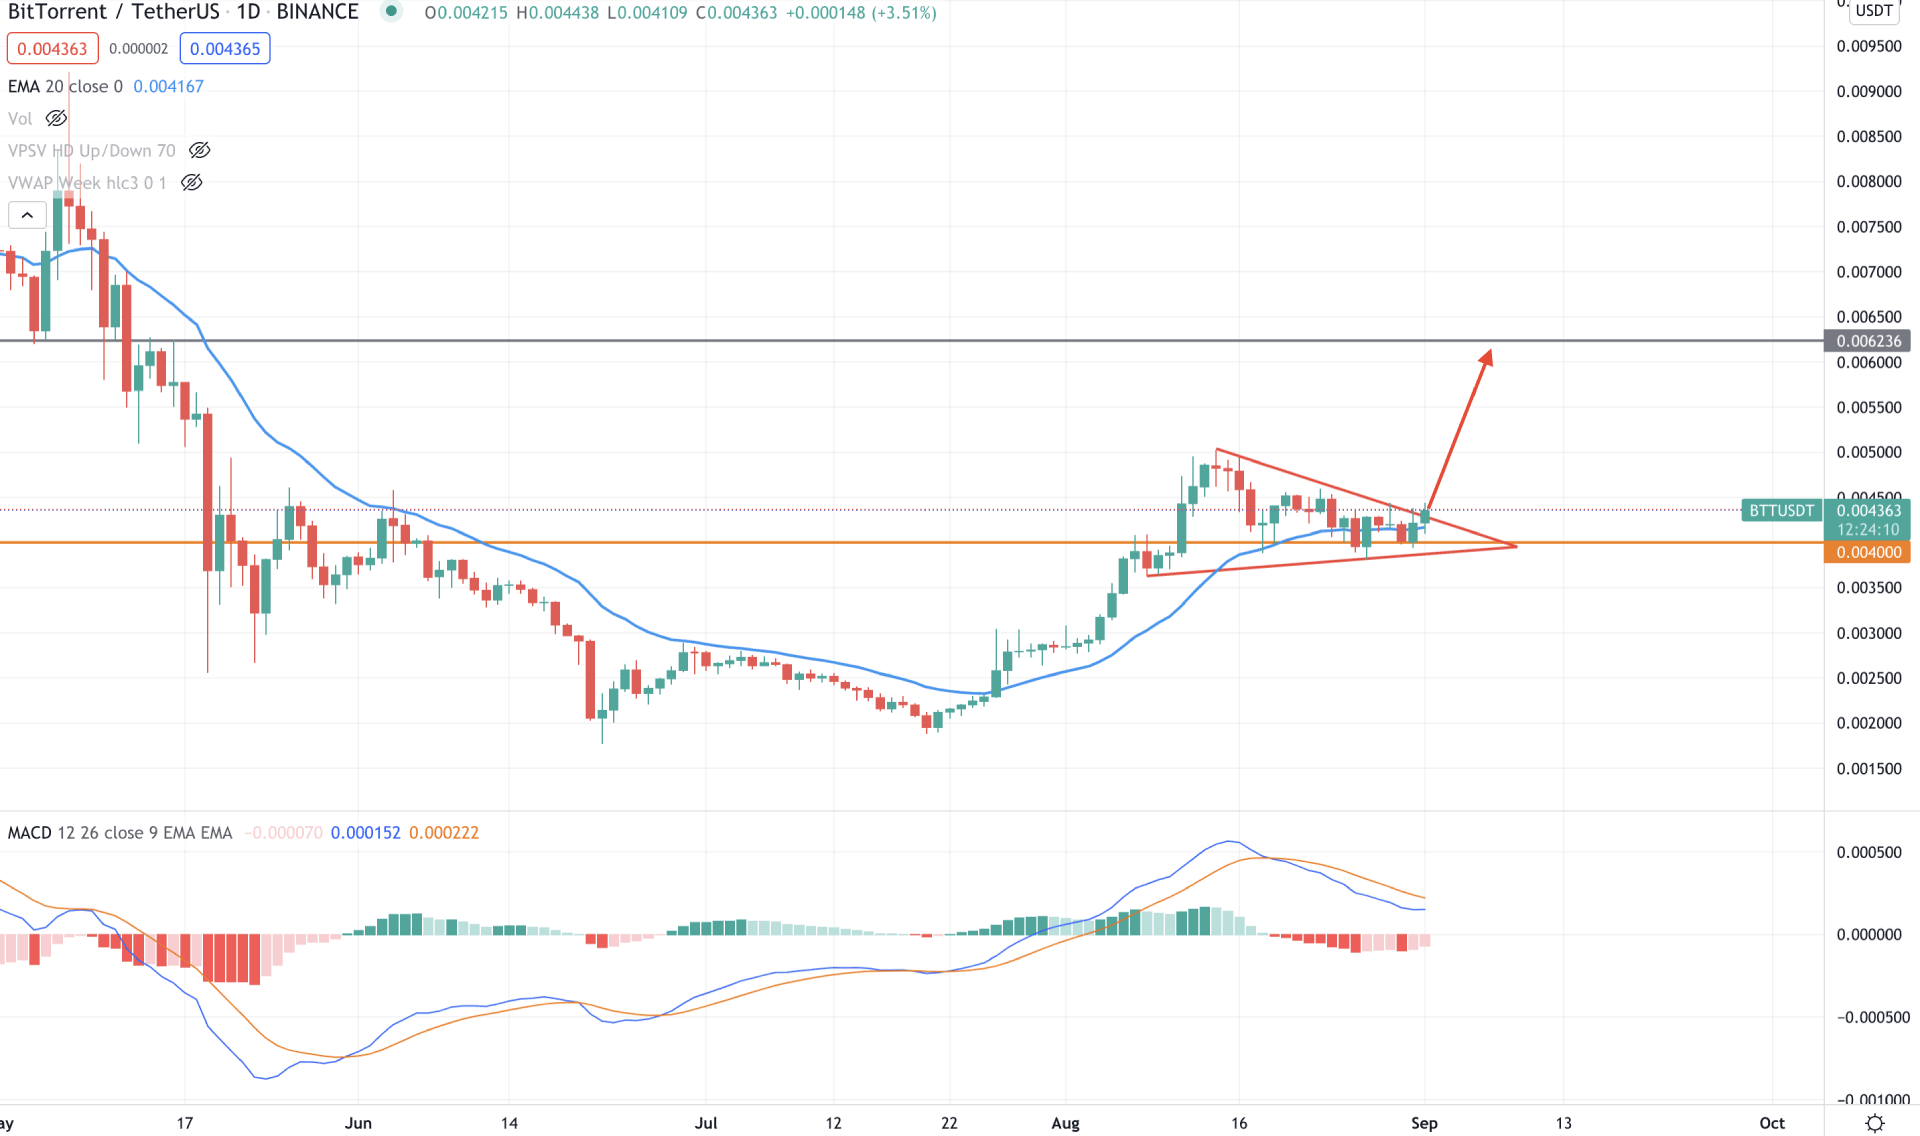
BTT/USDT moved lower from the all-time high and formed a bottom at 0.002148 level. Later on, the price tried to move below that level but failed. As a result, the daily candle moved above the dynamic 20 EMA on 21 July 2021 started the bullish pressure towards 0.005029 level before correcting lower. Currently, the price is trading above the 0.00400 event level with a bounce from dynamic 20 EMA. As long as the price is trading above the 0.00400 level, it is more likely to extend the bullish pressure in the coming days.
The above image showed that the price formed a bullish pennant pattern at the 0.00400 where the dynamic 20 EMA is working as a support. Moreover, the price moves up above the trendline resistance, where a bullish daily close is pending.
In this context, a positive MACD Histogram with a daily bullish close above the pennant pattern may initiate a bullish leg towards the 0.006236 level, the ultimate supply level. On the other hand, any sharp bearish daily close below the 0.00400 level may take the price lower towards the 0.002787 event level.
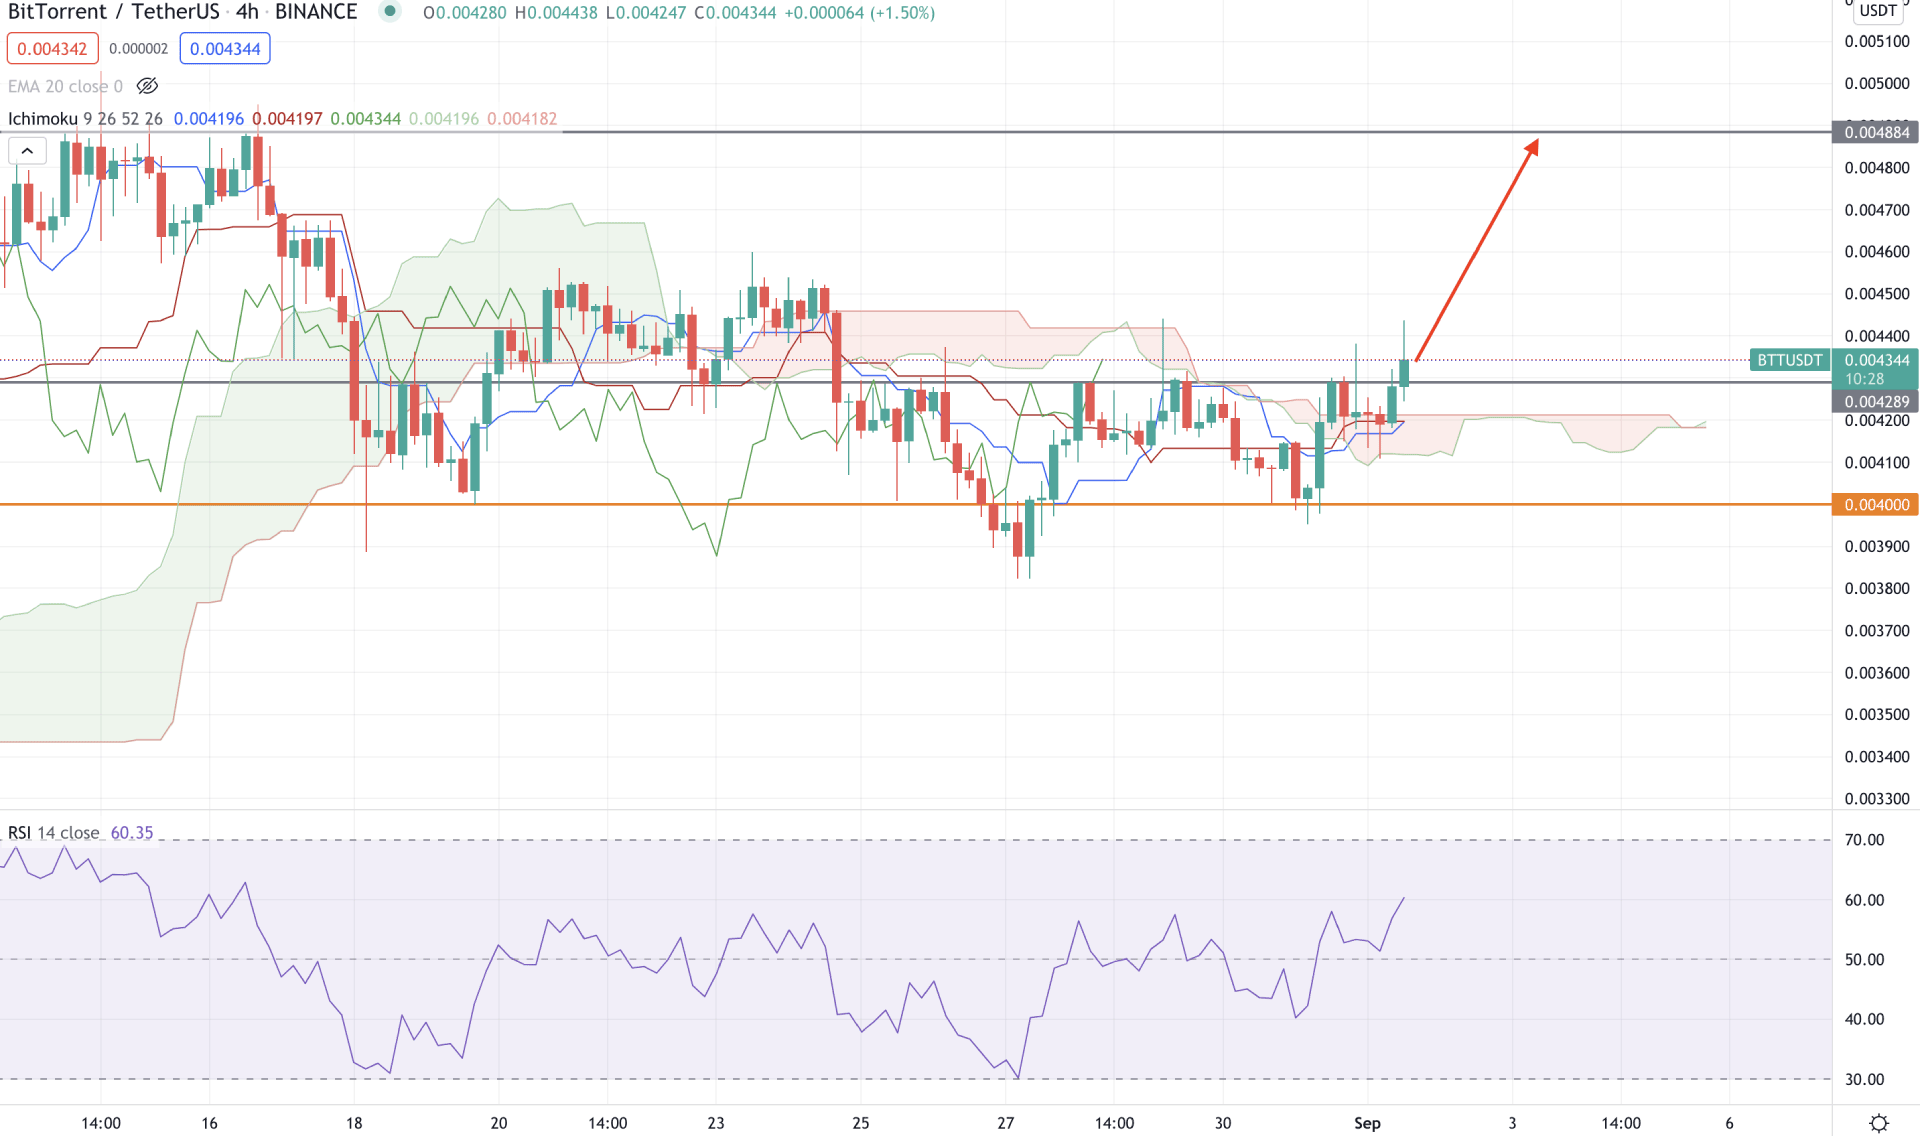
The BTT/USDT shows a bullish volatile structure in the H4 chart where the price is trading above the Ichimoku Kumo Cloud. Although the future cloud is bullish, the thickness is not satisfactory to say that the current buying pressure is impulsive. However, the price has shown multiple rejections below the Kumo Cloud and move above the 0.004344 event level. Therefore, as long as the price is trading above the 0.004344 level, it is more likely to extend the bullish pressure in the coming days.
In the H4 chart, we can see that the dynamic Tenkan Sen and Kijun Sen are below the price and providing support. It is an indication that the short term buyers are still in the market and may make a new high at the 0.004884 level. Besides, the RSI is still bullish and yet to reach the potential 70 levels from where a bearish pressure may come.
In this context, the buying pressure is valid as long as the price is trading above the 0.004344 to 0.004000 level. Any bearish H4 close below the 0.004000 bottoms may take the price lower towards the 0.003588 level.
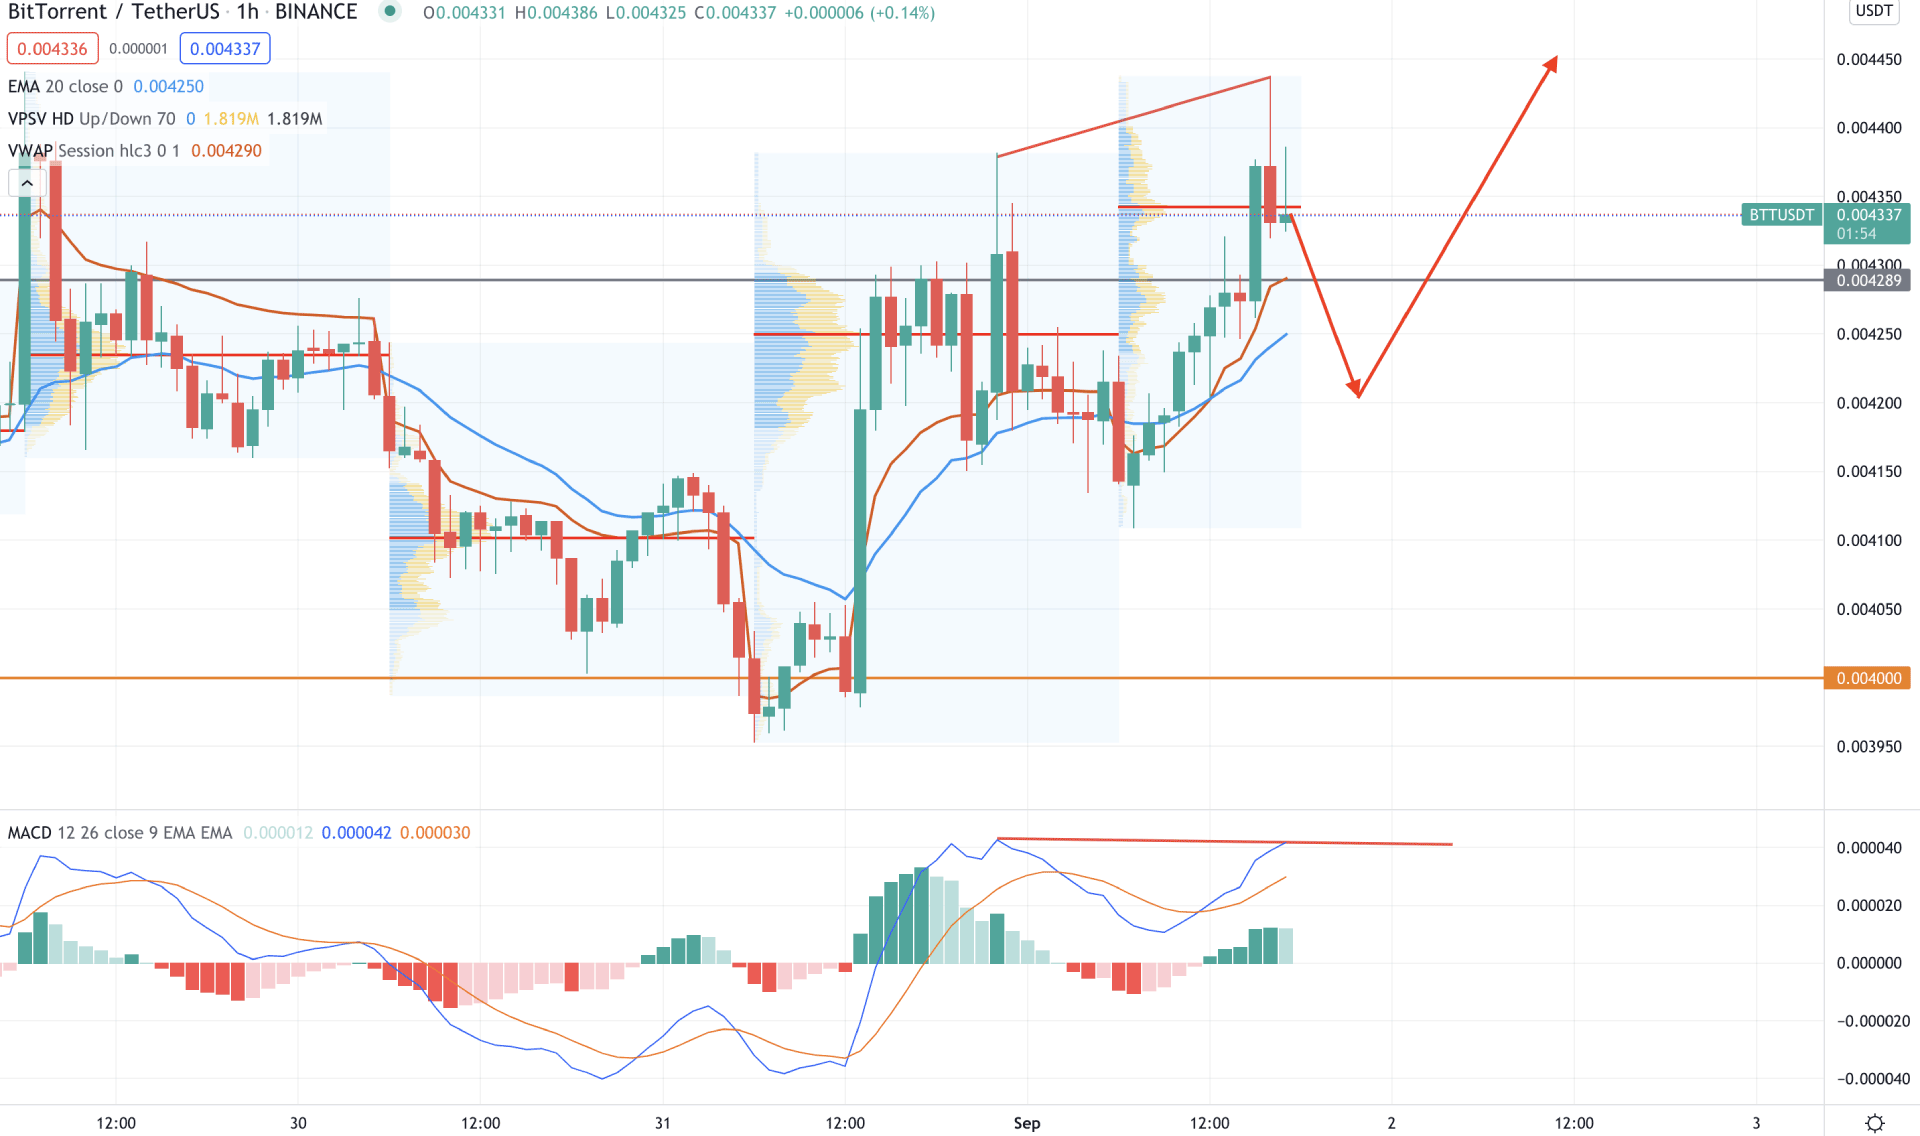
In the intraday chart, the price became very volatile after making a new intraday high. Therefore, the price formed a bearish H1 close below the most recent high volume level of 0.004343, followed by a regular divergence with MACD. However, the price is still above the dynamic 20 EMA and vwap from where a bounceback may happen.
The above image shows that the price trading is above the 0.004289 intraday support level with a volatile market structure. In that case, the price has a higher possibility of coming lower. However, the dynamic vwap is below the 0.004289 support level, from where any bullish pressure may take the price up.
In the indicator window, MACD Histogram remained bullish where any new high may influence the buying pressure.
As of the above observation, BTT/USDT is more likely to extend the current bullish pressure if the price is trading above the 0.004000 level. Any intraday bullish pressure from the dynamic vwap in the H1 chart may initiate a bullish trend towards the 0.006266 level.
On the other hand, a bearish H4 close below the 0.004000 level may alter the current market structure and take the price lower towards the 0.003500 level.