
Published: March 18th, 2020
It is very interesting to follow the Bitcoin price action in recent weeks. It is an amazing trading experience to watch yet another financial crisis. Will it be similar to the one in 2008? Around the world, there are big issues with Fiat money, which are constantly inflating. The problem is that we don’t know the rate of inflation and we can’t predict it. The purchasing power of any currency is highly manipulative and there was no solution to this until Bitcoin has appeared.
With Bitcoin, we know exactly the rate of inflation and we know exactly when it will occur - the Bitcoin having. This, perhaps, makes Bitcoin the most predictable and transparent currency in the world. And this is the reason why it could be the new world currency in the coming years, or maybe even months.
This financial crisis can reveal the true power of Bitcoin and we should find out this very soon. Let’s start by looking at the BTC/USDT long term perspective on a weekly chart.
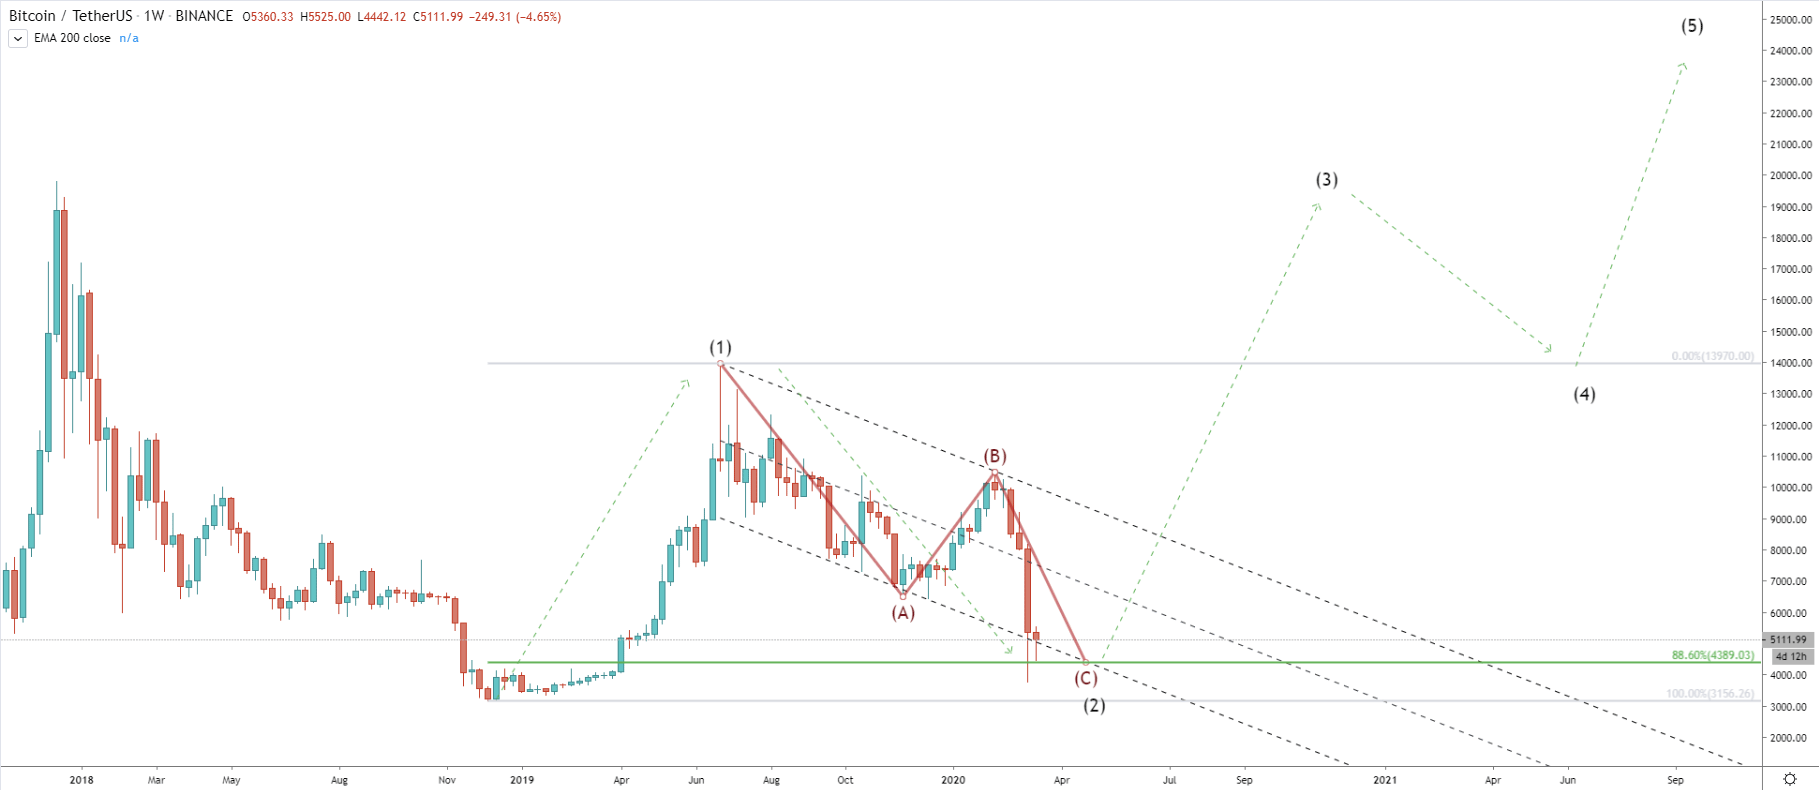
Based on the Elliot wave theory, a corrective move can be in two waves. Currently, we might be witnessing the second corrective wave down, which could be final. Price still remains above the lower trendline of the descending channel, which seems to provide a good support for the Bitcoin. At the same time, BTC/USDT has reached the 88.6% Fibonacci retracement level and yet, failed to close below. This is the key support area, which could trigger the beginning of a long term uptrend continuation.
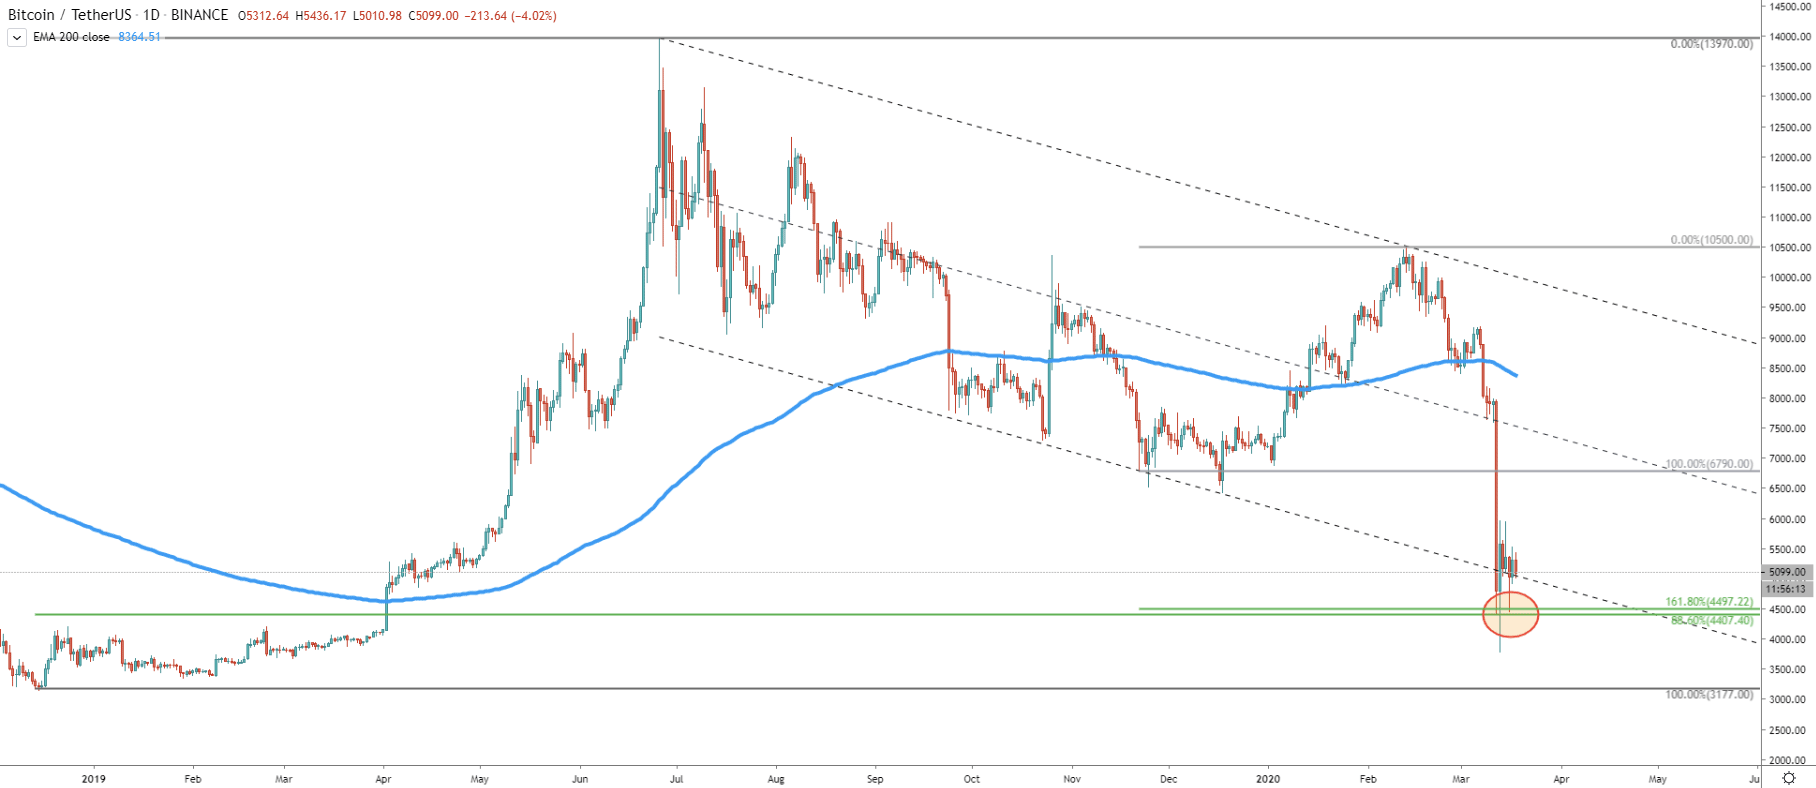
The daily chart shows that price has reached and rejected so fart two Fibonacci levels. First is 88.6% and second, being 161.8% Fibs applied the last corrective wave up. Now, between $4000 and $5000 levels we might see some consolidation for a relatively short period of time. This could be the most important time for any long term investor because it can be a depiction-making price range.
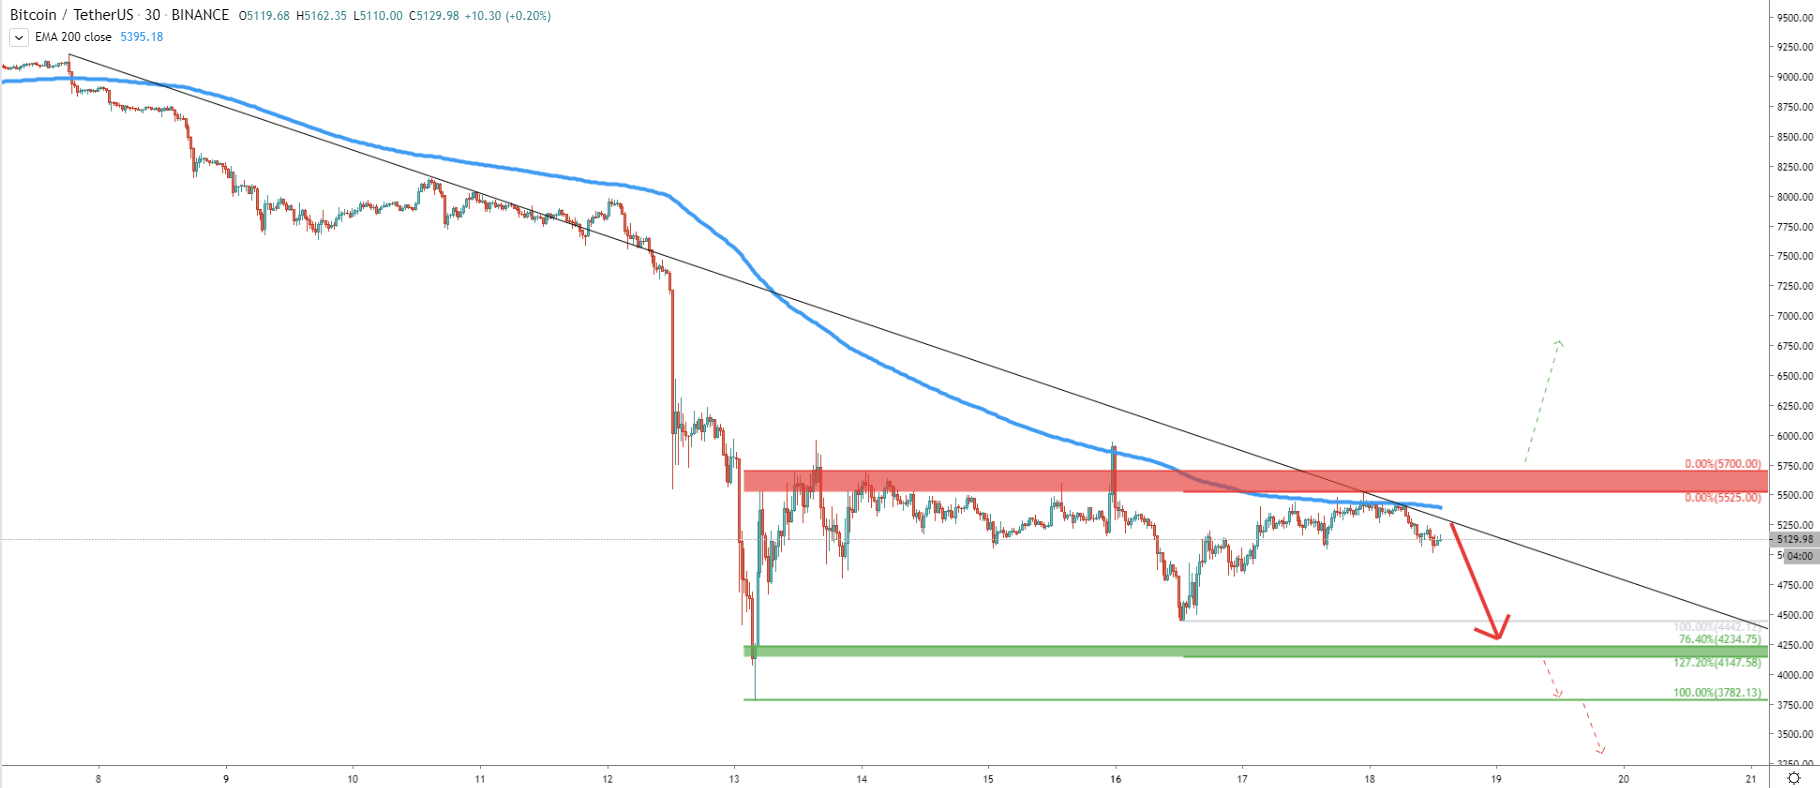
On the 30M chart, the picture is getting a little more clear. Price is still trending down as we can see the recent rejection of the downtrend trendline, along with the 200 Exponential Moving Average. It makes $5500-5700 a key resistance area for the Bitcoin. But while the trend down it will be very important to see the price holding above the recently established low at $3782.
The next important moment is the $4235-4150 support area. It could be the most-watched price during past years. This level, if rejected, could be the key demand zone for long term investment. If there will be a clean bounce off any of the support, and the price will manage to break above the $6k, then this perhaps a confirmation that uptrend continues for the long run.
Bitcoin is still trending down. Although it’s approaching the key buying zone. For now, selling remains the priority, but if the support near $4200 area is rejected, it could be the end of the long term correction down.
4235, 4150
Only the rejection of a $4235-4150 support area, followed by the daily break and close above $6k psychological level might be a confirmation of an uptrend.
Support: 4235, 4150, 3780
Resistance: 5525, 5700, 6000


