Published: February 25th, 2020
Bitcoin has been gaining more and more interest over 2019, where the price made a very strong come back. BTC/USD went all the way up to $13,880 from $3,122 bottom of 2018. Such an increase resulted in a 344% growth, although after each rally there is either a correction, a consolidation or even a trend reversal. Today we will try to understand which of the scenarios can be expected in the coming weeks.
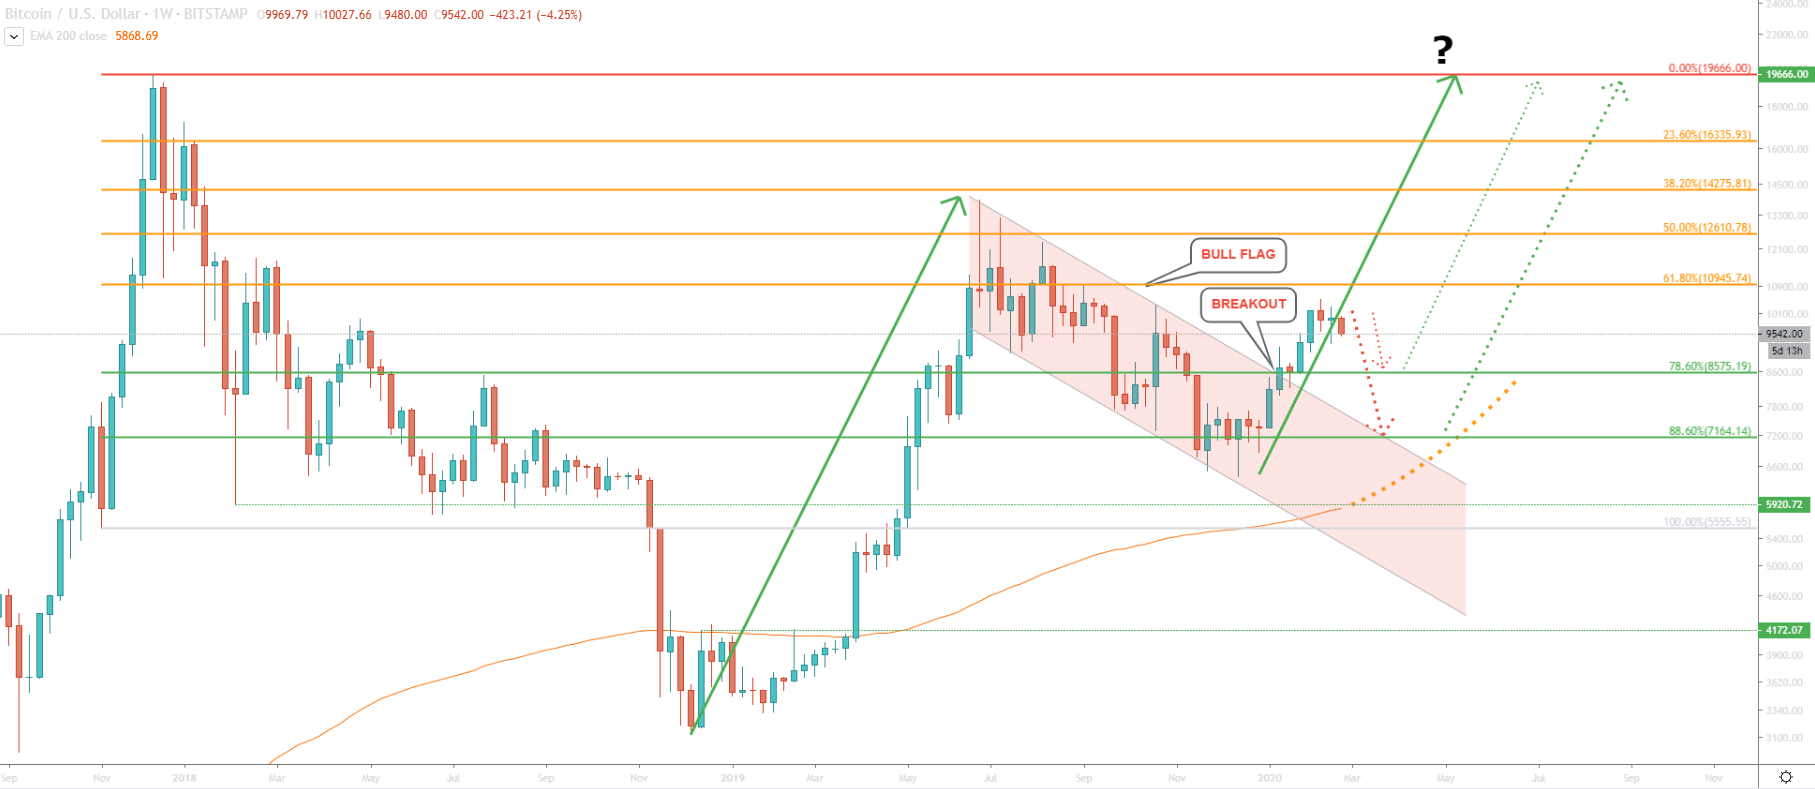
Above is a BTC/USD weekly chart from Bitstamp. We have applied the Fibonacci retracement level to the last impulse up, prior to establishing an all-time high. Such Fibonacci approach provides strong support and resistance levels, because of the importance of that market move.
After the 2019 rally, the price has formed a bull flag pattern by breaking above the descending channel on January 13. Following the breakout, BTC/USD reached the $10,500 high and currently corrected down to $9,500 area. It seems very obvious to everyone, that there is a massive psychological resistance area around $10,000. Most investors are watching this area in order to make a decision. Yet, the price remains below, which still shows bearish domination in the short term.
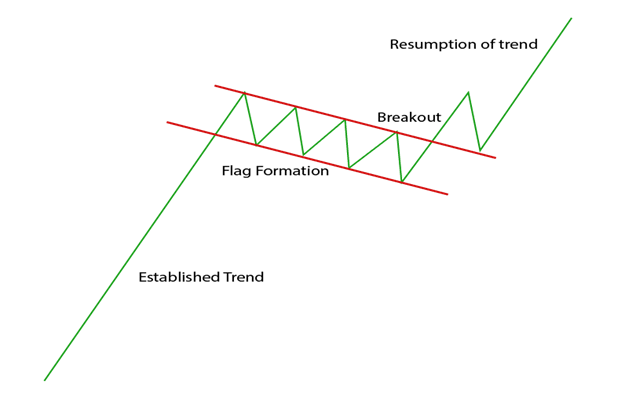
Above is a classic bull flag pattern, which is a very similar looking graph compared to Bitcoin price on a Weekly chart. In this scenario, price retraced back to the descending channel, after which strong rally has begun. Let’s look at the Daily chart to see how far down BTC can correct, and whether it is in fact a correctional move only.
In a zoomed-in version of a Weekly chart, we can see that on September 2, 2019, price formed resistance at 61.8% Fibonacci retracement level at $10945. This was a very clean bounce off the Fibonacci, which makes it an important level to watch.
On February 12, Bitcoin has tested $10500 high, which corresponds to the previous level of resistance established back on October 26. Price failed to break and close above, and we could see a selling pressure once again.
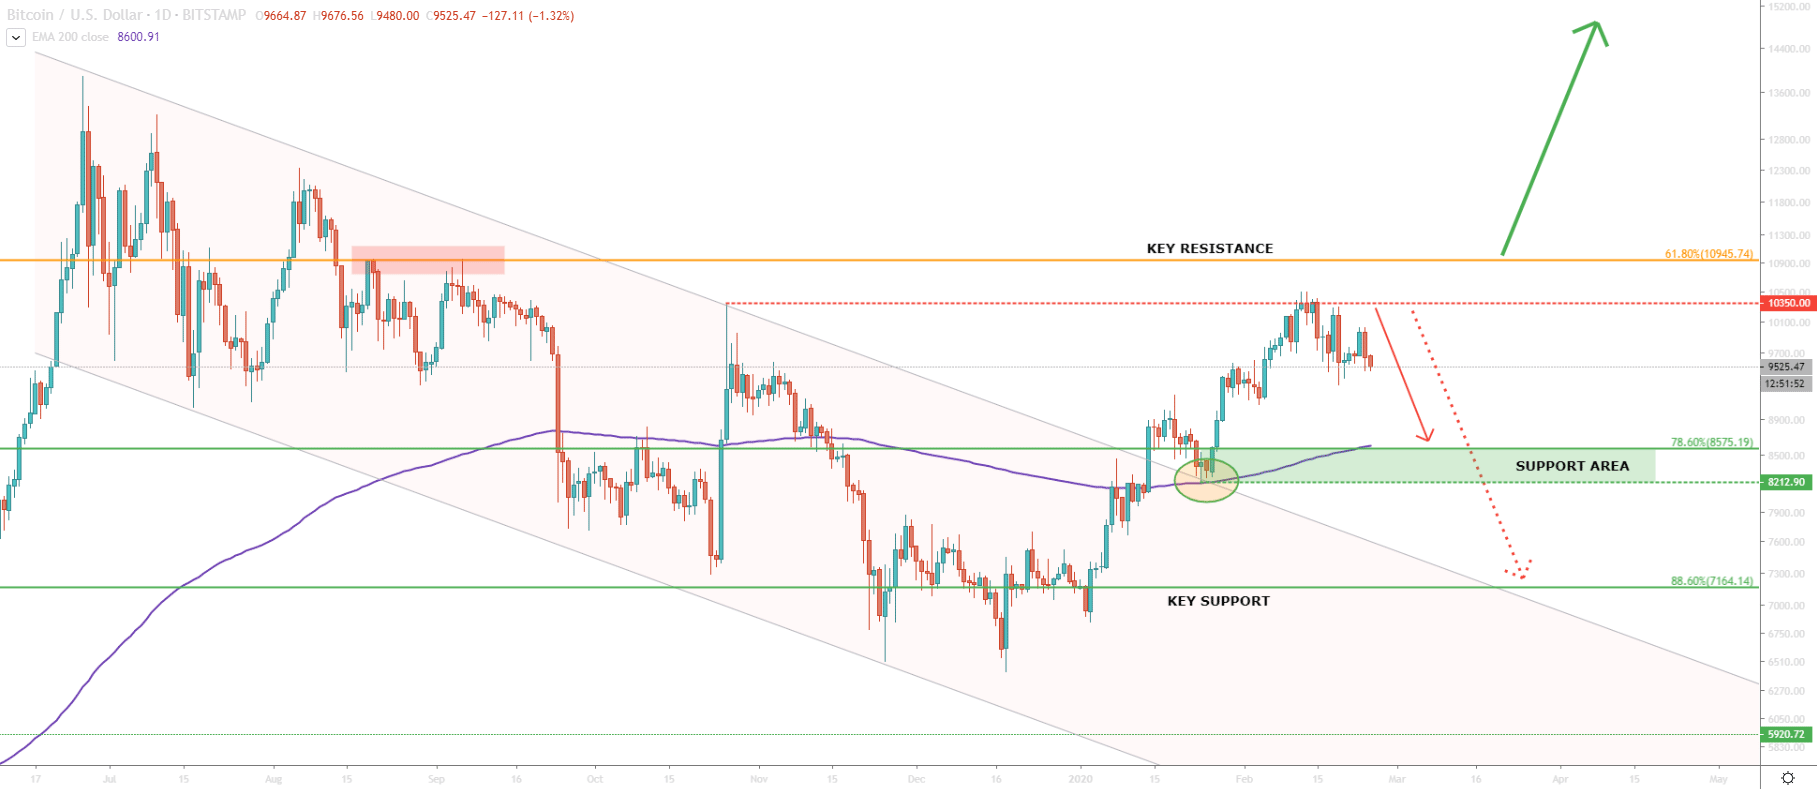
On the other hand, the BTC/USD broke above the descending channel and then rejected the 200 Exponential Moving Average at $8212. Therefore, current selling pressure can be interpreted as a correctional move down, rather than a trend reversal. But at the same time, the BTC price must remain above the support area between $8212 and $8575.
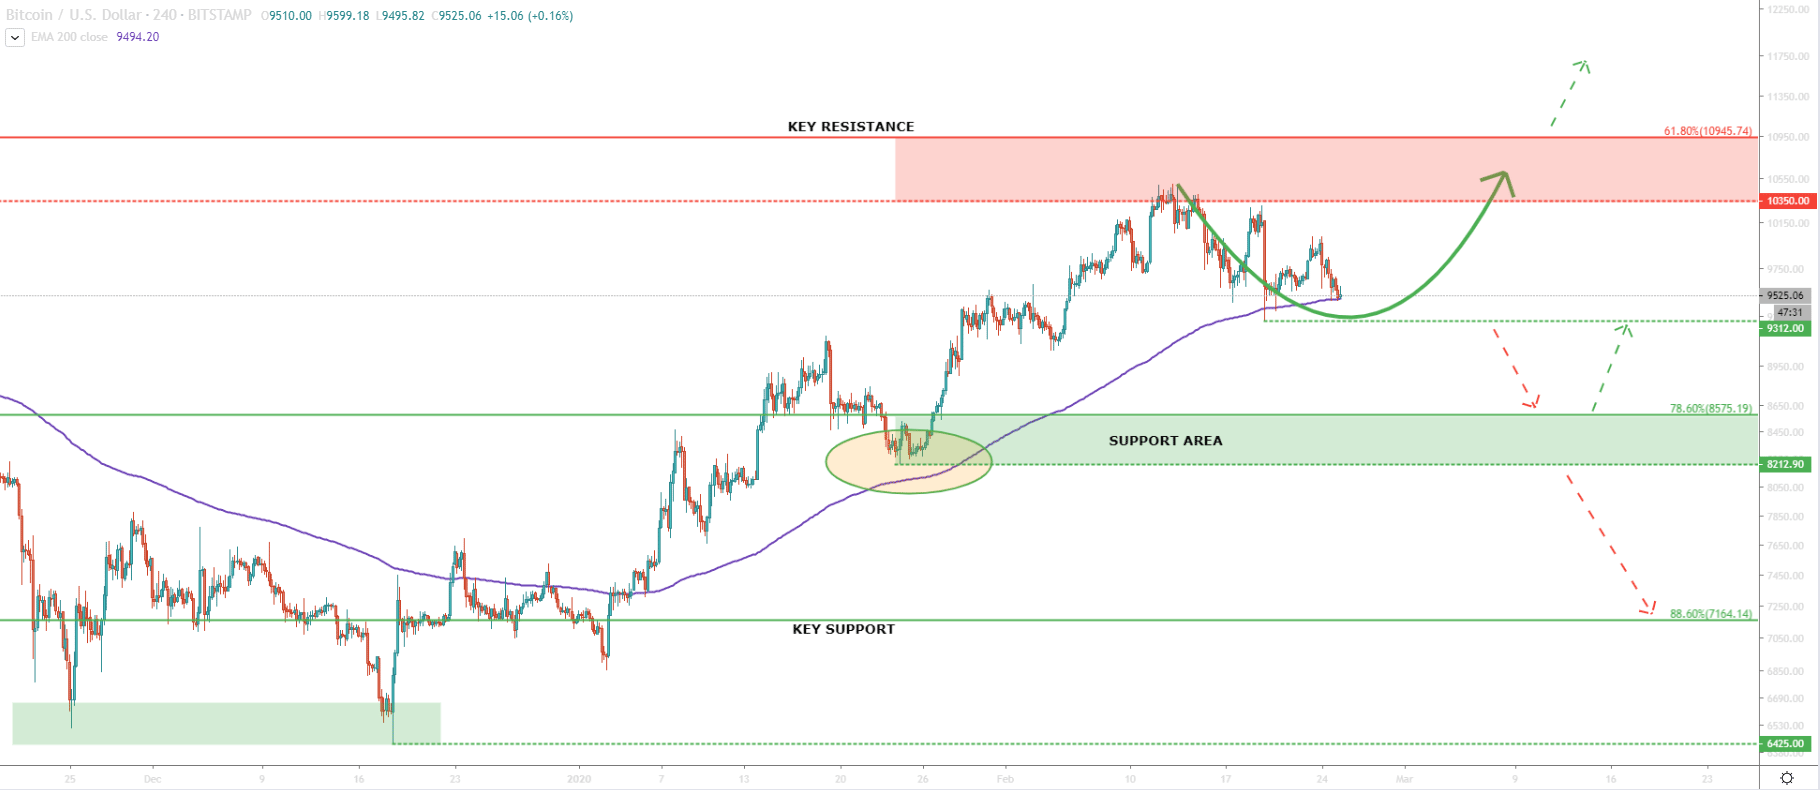
And finally, the 4H chart analysis shows yet another price dimension. What we are witnessing currently is price trading near the 200 EMA, which acts as the support. Daily break and close below the $9312 can confirm price further weakness. But if that support holds, BTC is likely to consolidate between $10350 and $9312 for the time being.
Perhaps long term investors would be waiting for either for a clean break and close above the $11000 or a stronger correction down.
On a Weekly chart, price formed a bull flag pattern, indicating a strong bullish trend. However, this pattern can be completed in two scenarios. Either price will correct strongly towards $8575 or even $7165 support area. Or, breaks above the $11000 resistance. Currently, it is a waiting time for investors, but traders will continue speculating on the price, making it quite volatile.
If $11k will be cleared, Bitcoin can easily go for the previous all-time high, to test $20,000 once again. The upside rally can also result in a much bigger growth pushing price as high as $40,000.
While there are no strong indications that the upswing will continue, sellers will try to capitalize on the current state of the market. This might send BTC down to $8,575 area. At the same time, daily break and close below $8,212 will push the price even lower, towards 88.6% Fibonacci level at $7,165.
Support: 9312, 8575, 8212, 8165, 6425
Resistance: 10350, 10945


