

Published: November 11th, 2026
Brookfield Corporation is forecast to report a decline in earnings this week.
According to the analysts, the company could post revenue of $1.8 billion. This would signal a 90.5% decline from the $18.92 billion reported in the same quarter last year. Earnings are projected at 72 cents per share. Meanwhile, Wall Street analysts have set the 12-month price target at $55.50, representing upside potential.
Separately, Brookfield and Drax have announced plans to develop more than one gigawatt of data centre capacity at the Drax Power Station estate. The initial phase, with capacity of up to 100 megawatts, is expected to become operational in the first quarter of 2028, subject to planning permissions, regulatory approvals and securing a tenant.
Brookfield estimates that the first phase could generate approximately £2.5 billion in investment. The development will utilise the site's existing infrastructure, including four gigawatts of grid access and 2.6 gigawatts of dispatchable power generation capacity. The project aims to capitalise on rising demand for AI and high-performance computing infrastructure.
Let's look further into this stock based on technical analysis:
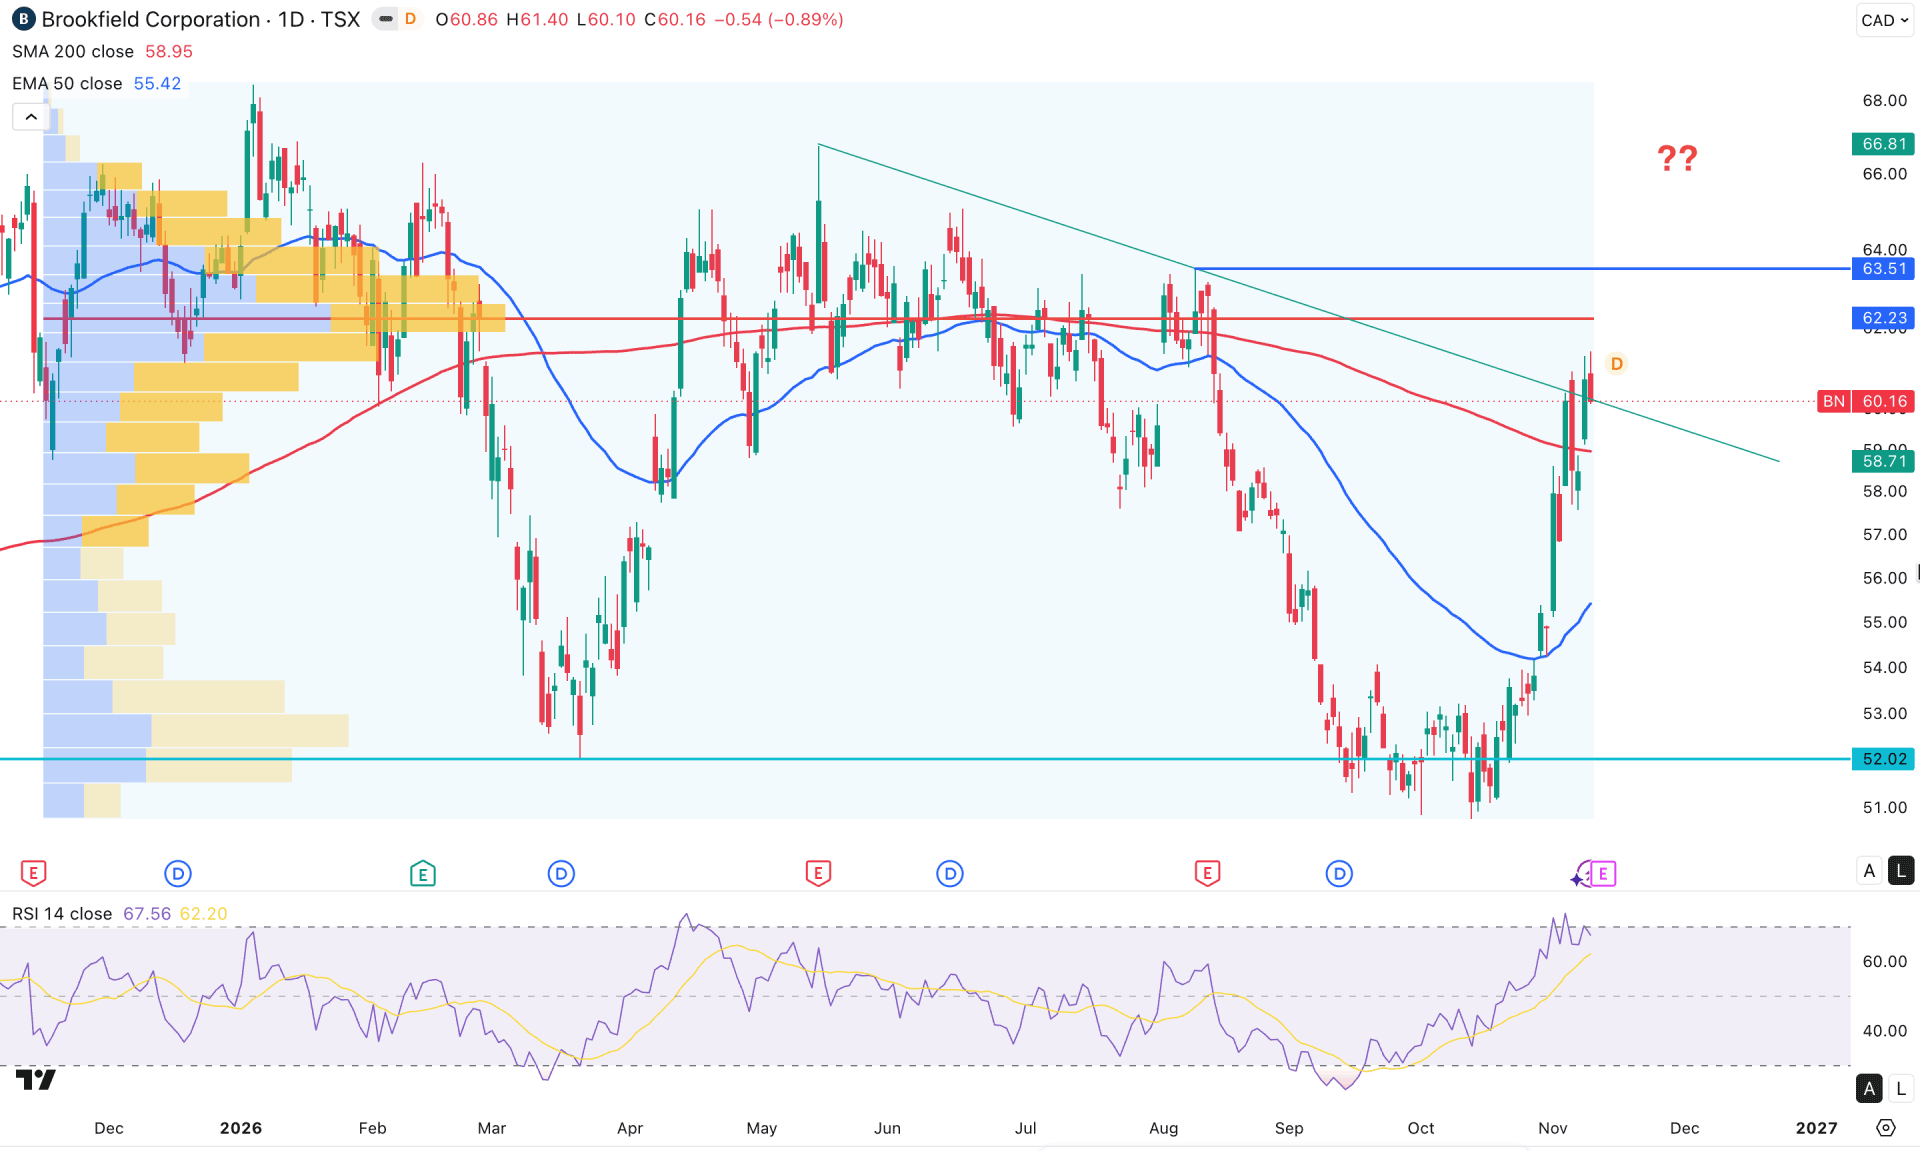
A day later, Brookfield Corp stock (BN) remains bullish after a valid sell-side liquidity grab at 52.02 bottom. The price went higher with counter-bullish momentum but the current location is not solid for anticipating further gain.
Looking at the higher timeframe, the overall market structure looks bullish, with the monthly timeframe forming a valid bullish rebound and overcoming existing monthly resistance. The weekly timeframe tells the same story: the rebound is solid but has yet to validate the bullish breakout.
The volume structure tells a different story. According to the high-volume indicator, the most significant level since November 2025 is at 62.23, just above the current price. As the price is still trading below this line, we might need more clues before opening a long opportunity.
In the main price chart, price is hovering above the 200-day SMA for two consecutive trading days. Meanwhile, the 50-day EMA is below the current price, signalling medium-term buying pressure.
The relative strength index is in the peak area, where the current line is testing the 70.00 overbought level.
Based on the overall market structure, BN stock is trading within a bullish structure, but more confirmation is needed before anticipating further bullish pressure. The price is already trading below the 62.23 high-volume resistance line, which must be overcome before anticipating further bullish pressure.
As price nears the 200 SMA, any bearish rebound with a daily close below this line could initiate downside momentum and test the 50-day EMA again.
On the other hand, sharp bullish pressure and a recovery above the 63.51 key resistance level could validate the long-term bullish move, with the ultimate target being a test of the 66.81 level before creating a new high.
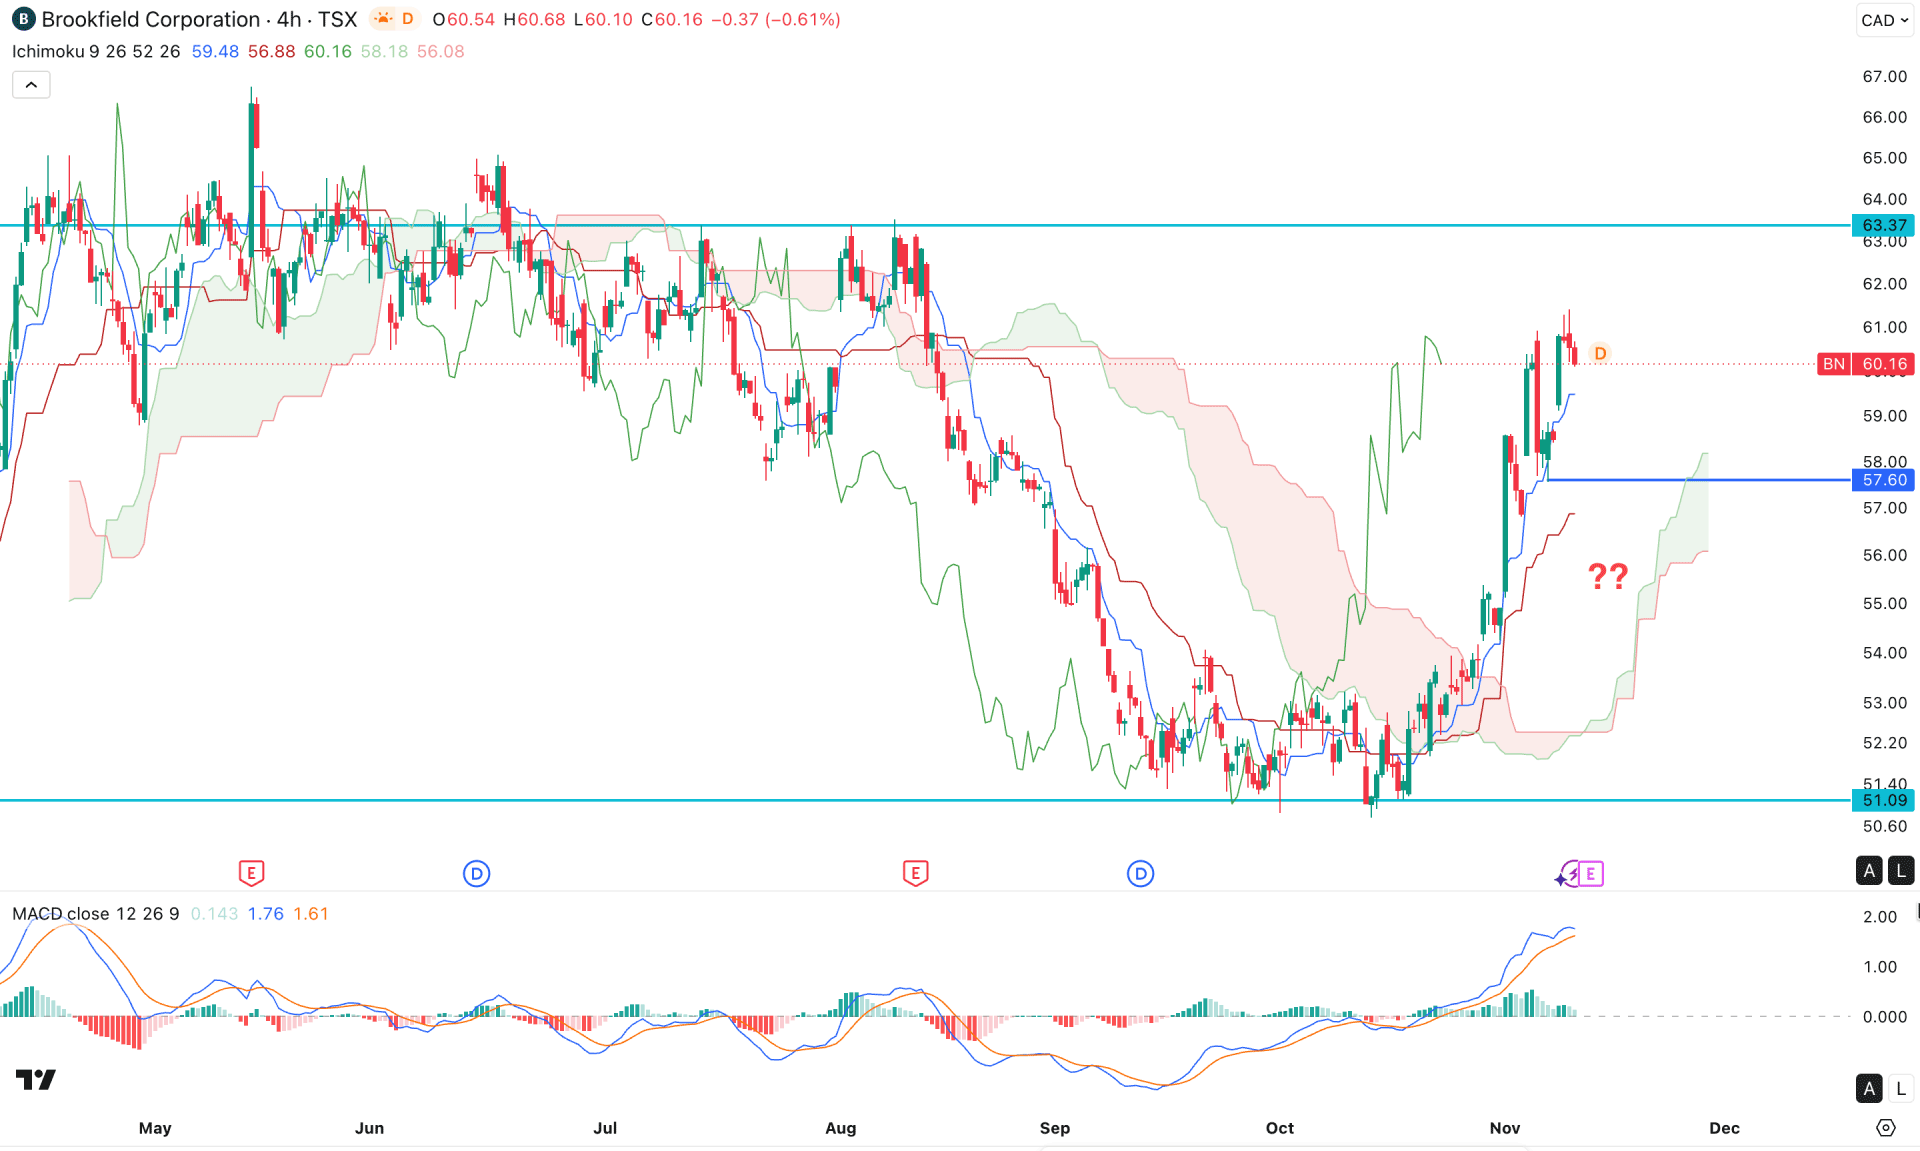
On the four-hour timeframe, the BN price is trading above the cloud support, suggesting a valid bullish trend formation. Moreover, the future cloud has flipped position and is aiming higher, signalling a positive impact on buyers.
Moreover, price is still holding above dynamic support lines, signaling an ongoing bullish push. However, the gap between the current price and Kijun-sen indicates a pending downside correction as a mean reversion.
In the secondary indicator window, the MACD shows a corrective structure. The signal line has reached the bullish peak area, where the histogram has remained above the neutral level.
Based on this structure, we may consider the bullish momentum valid as long as the price remains above the cloud support. However, the current bullish overextension signals a decent possibility of a downside correction.
In that case, any failure to overcome the 63.37 resistance level could present a short-term bearish opportunity targeting the 54.00 level.
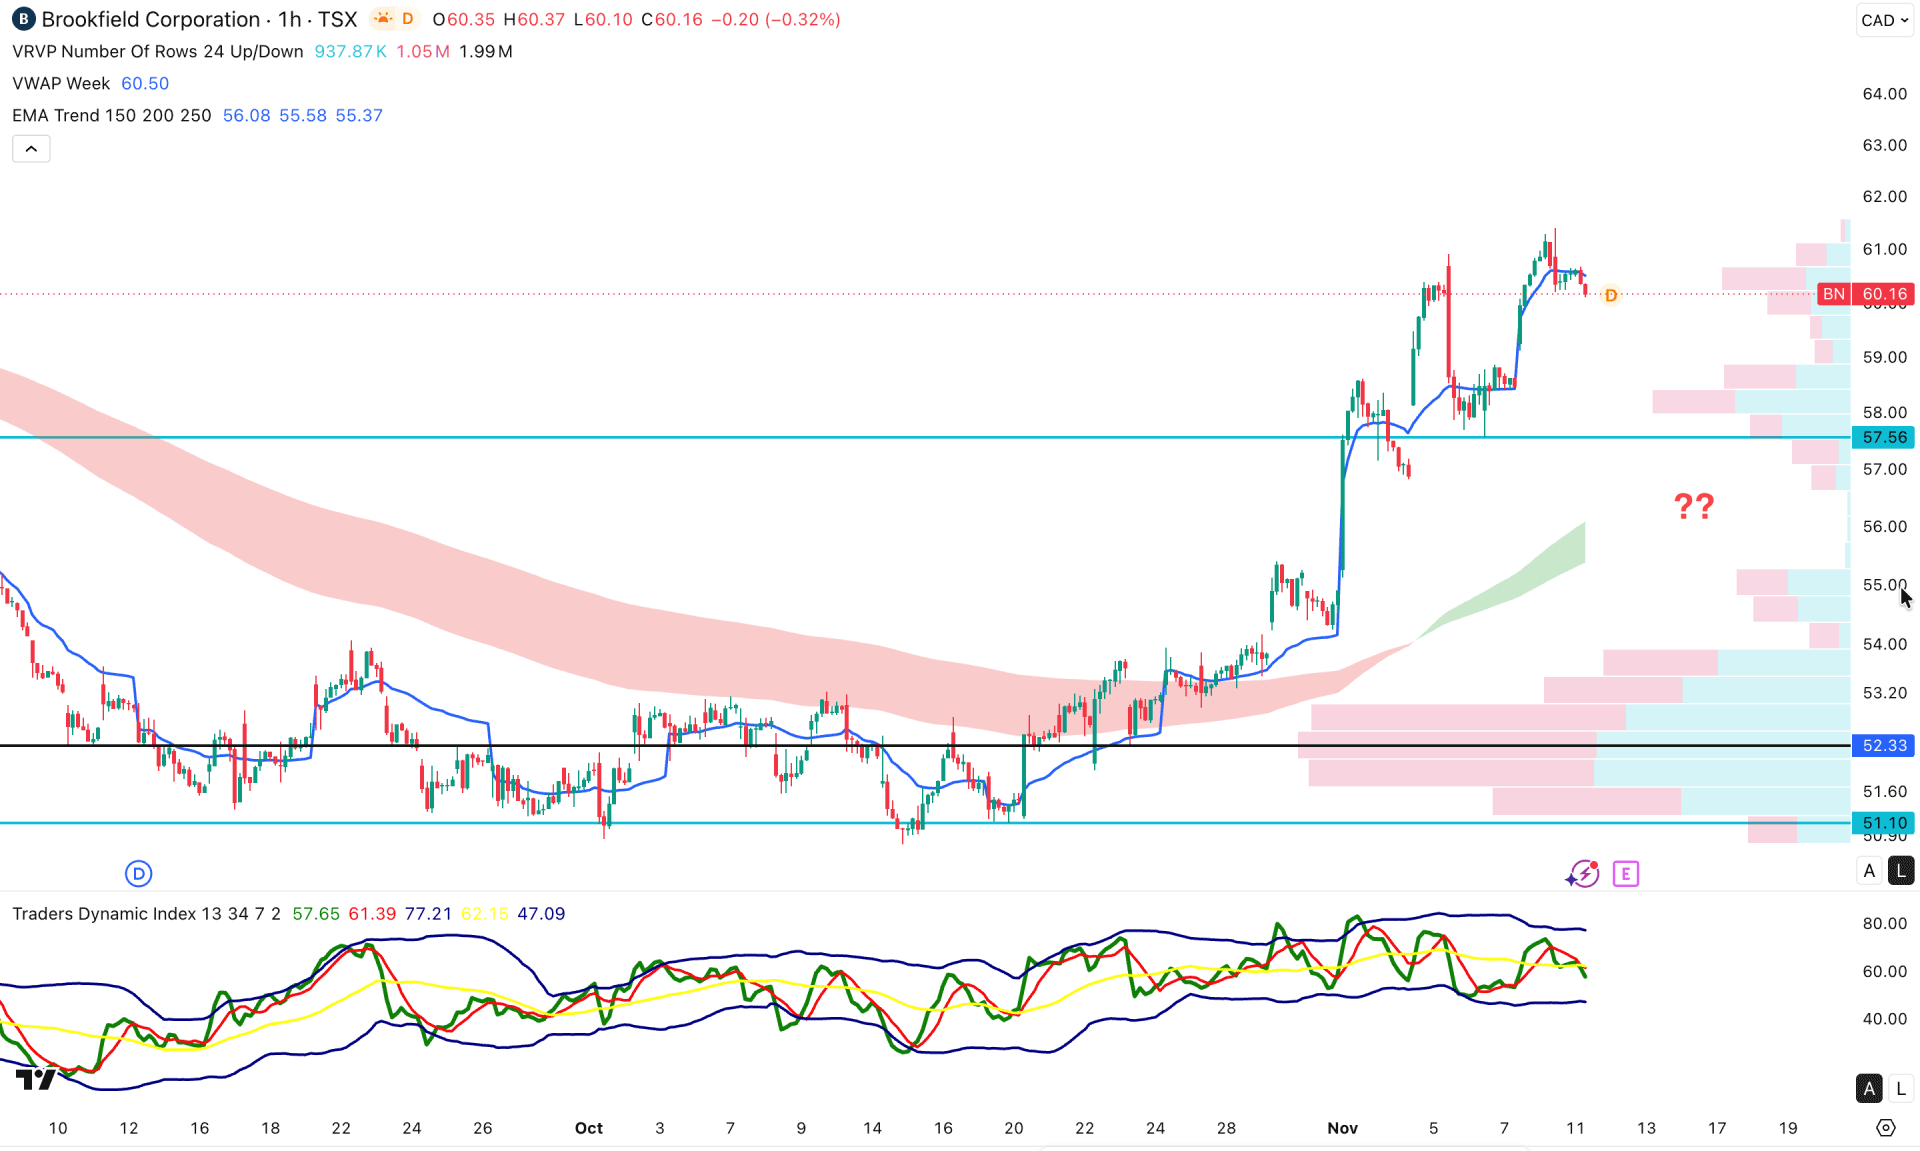
On the hourly timeframe, BN stock is trading in a bullish as a valid tend continaution. Primarily, the rebound came on a valid bullish trendline breakout, signaling positive momentum to buyers. However, the recent price action has gone sideways after creating multiple higher highs.
The most recent price is trading below the weekly VWAP level, while the gap between the current price and the exponential moving average wave has expanded.
In the secondary indicator window, a bearish divergence is visible. The Traders Dynamic Index has failed to maintain momentum in line with the price swings on the main chart. Moreover, the TDI level moved below the 50.00 neutral line, signaling active selling pressure on the intraday chart.
Based on the overall market structure, BN stock is trading in a bullish peak area, from which a considerable downside correction is possible. Investors should closely monitor the support level of 57.56, as a failure to hold above this line could be challenging for buyers. Moreover, the next support level below this line to watch is 52.33, which could be a crucial area for a bullish rebound.
Based on the overall market structure, BN stock is trading within a bullish pre-breakout structure, where the recent rebound from the bottom is an early sign of a possible bullish breakout. As price is still trading near the potential trendline resistance level, investors should closely monitor how it reacts in this area before deciding on the next price direction.


