
Published: November 11th, 2025
In the most recent quarter, favorable markets enabled Brookfield to spend $23 billion in investment opportunities and facilitated a sale of $25 billion net of assets, which included $15 billion in equity value.
Distributable earnings, a gauge of cash that may be given back to shareholders, increased 6.8% to $661 million, or 41 cents.
Net income rose from $544 million, or 34 cents per share, compared to $724 million in the same quarter previous year. In the just-concluded quarter, fee-related earnings reached a record high of $754 million, up 17% from the $725 million economists had predicted.
Due to improvements in management and incentive costs as well as carried interest income, revenue rose to $1.25 billion in the preceding three months from $1.12 billion the previous year.
The seventh vintage of Brookfield's recently established private equity investments flagship fund and the initial close of its first AI infrastructure fund. The artificial intelligence infrastructure fund is anticipated to be one of Brookfield's biggest initial initiatives.
By the close of September, Brookfield owned $125 billion in uncalled fund commitments, of which $55 billion, according to the company. Its balance sheet showed that the company had around $2.6 billion in cash, short-term financial assets, and undrawn ability on a revolving credit.
Let's see the upcoming price direction of this stock from the technical perspective:
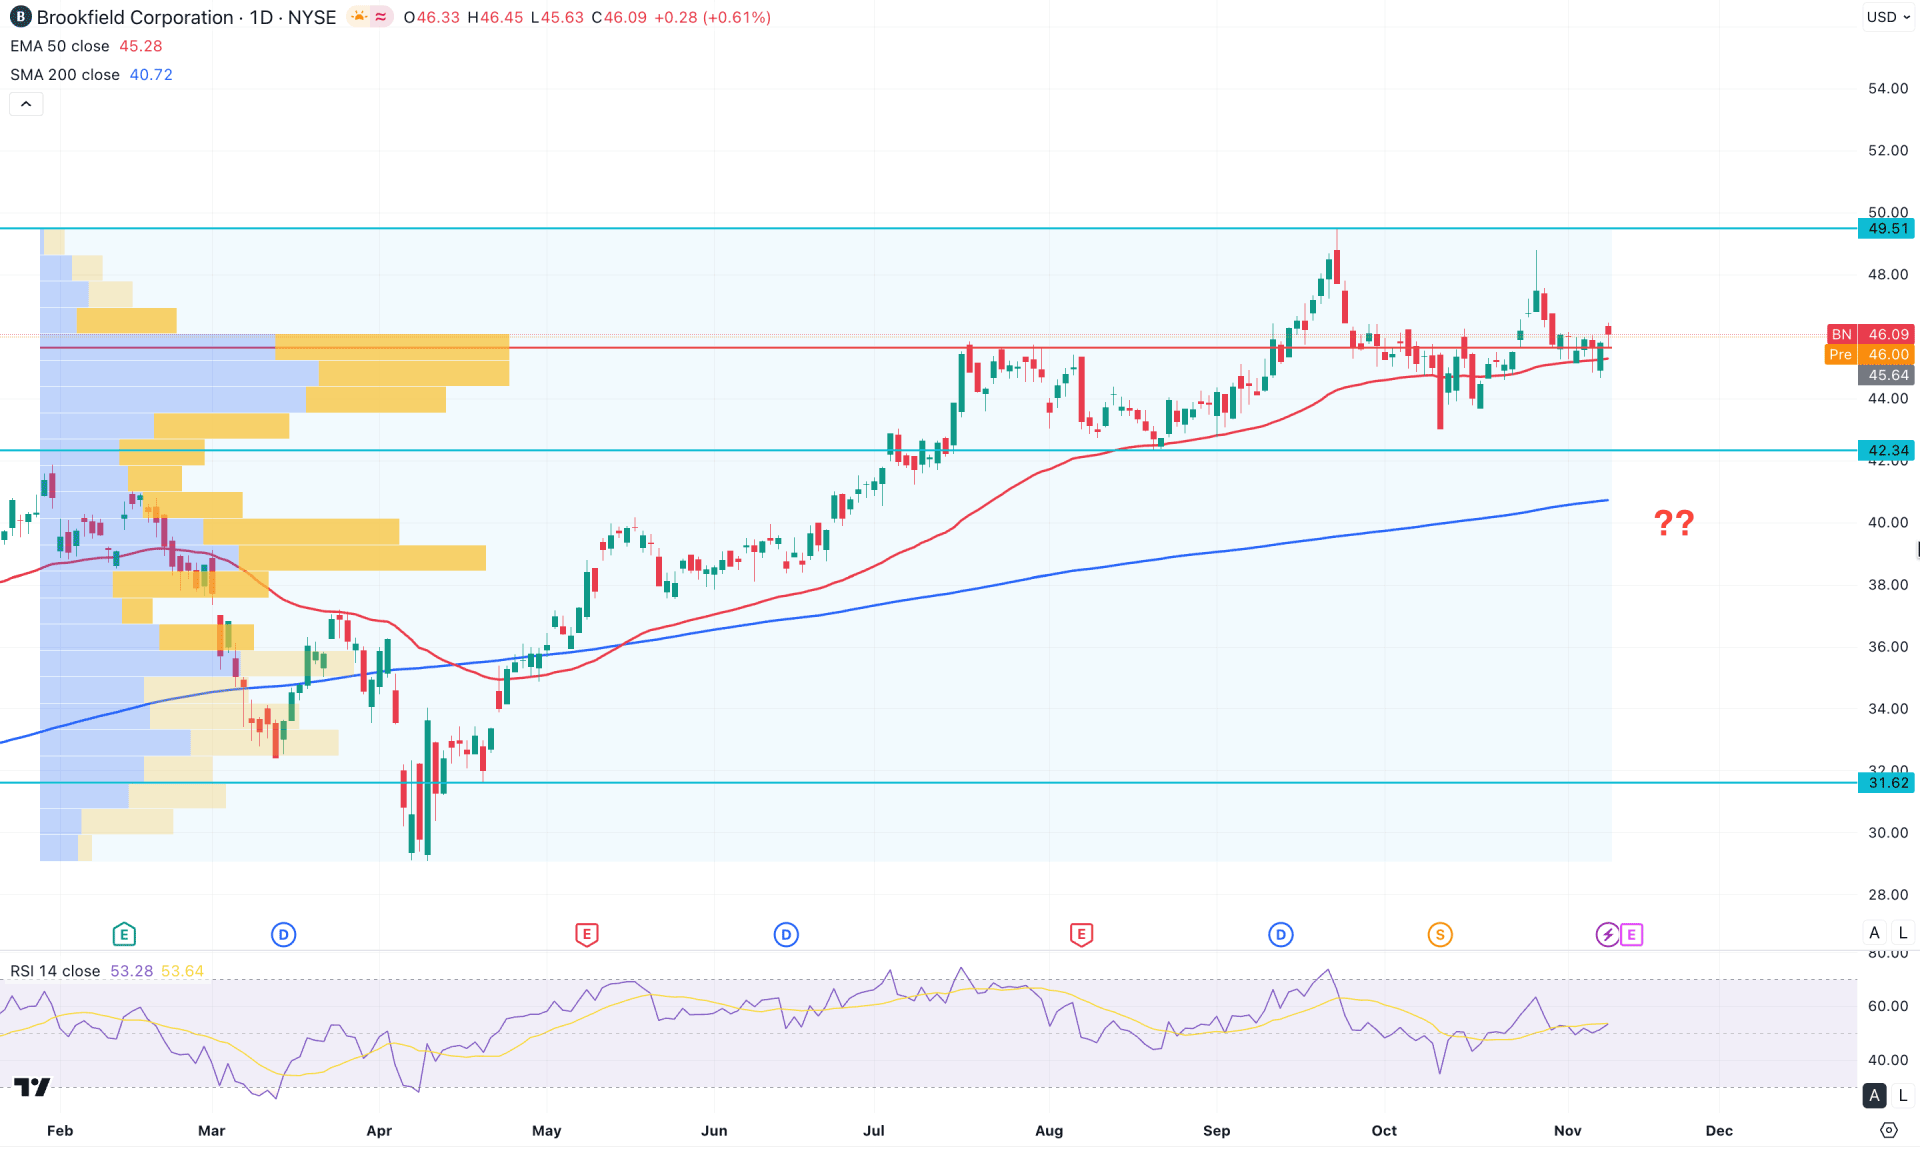
The overall market momentum for Brookfield Corp (BN) remains strongly bullish. An ongoing bullish rally is evident, supported by a massive sell-side liquidity sweep in April 2025. Since the recent price action shows no significant selling pressure at the all-time high level, we may anticipate the price to extend its bullish momentum.
Looking at the higher timeframe, a corrective phase is visible as the monthly chart displays multiple indecision candles. However, the weekly chart remains bullish since the current price is trading above the previous weekly high of 46.00, signaling a potential long-term bullish continuation.
In terms of volume activity, the price is trading within a consolidation zone, indicating an accumulation phase around the current price area. The highest activity level since February 2025 is at 45.64, which sits just below the current price and lies within a symmetrical triangle pattern.
On the main price chart, the 50-day Exponential Moving Average is acting as immediate support, showing strong bullish reversal characteristics. Meanwhile, the 200-day Simple Moving Average lies below the entire structure, serving as a major support level just above the 40.00 psychological mark.
In the secondary indicator window, the Relative Strength Index (RSI) shows a strong bullish recovery with stable momentum above the 50.00 line. However, the recent sideways movement near the neutral zone suggests ongoing consolidation from corrective market pressure. Moreover, the Average Directional Index (ADX) remains below the 20.00 level, indicating a weak trend or corrective momentum.
Based on the overall market structure, Brookfield Corp stock (BN) continues to trade with bullish momentum. The uptrend is likely to persist as long as the price stays above the 44.00 psychological support level. On the upside, immediate resistance is seen around 49.51, which could act as a key barrier before a potential move toward the 55.00 area.
Conversely, a deeper pullback could occur if the price tests the 200-day SMA, which may act as a strong support barrier for buyers. However, a break below the 42.34 support level could be an alarming signal, possibly extending losses toward the 41.60 to 42.00 support zone.
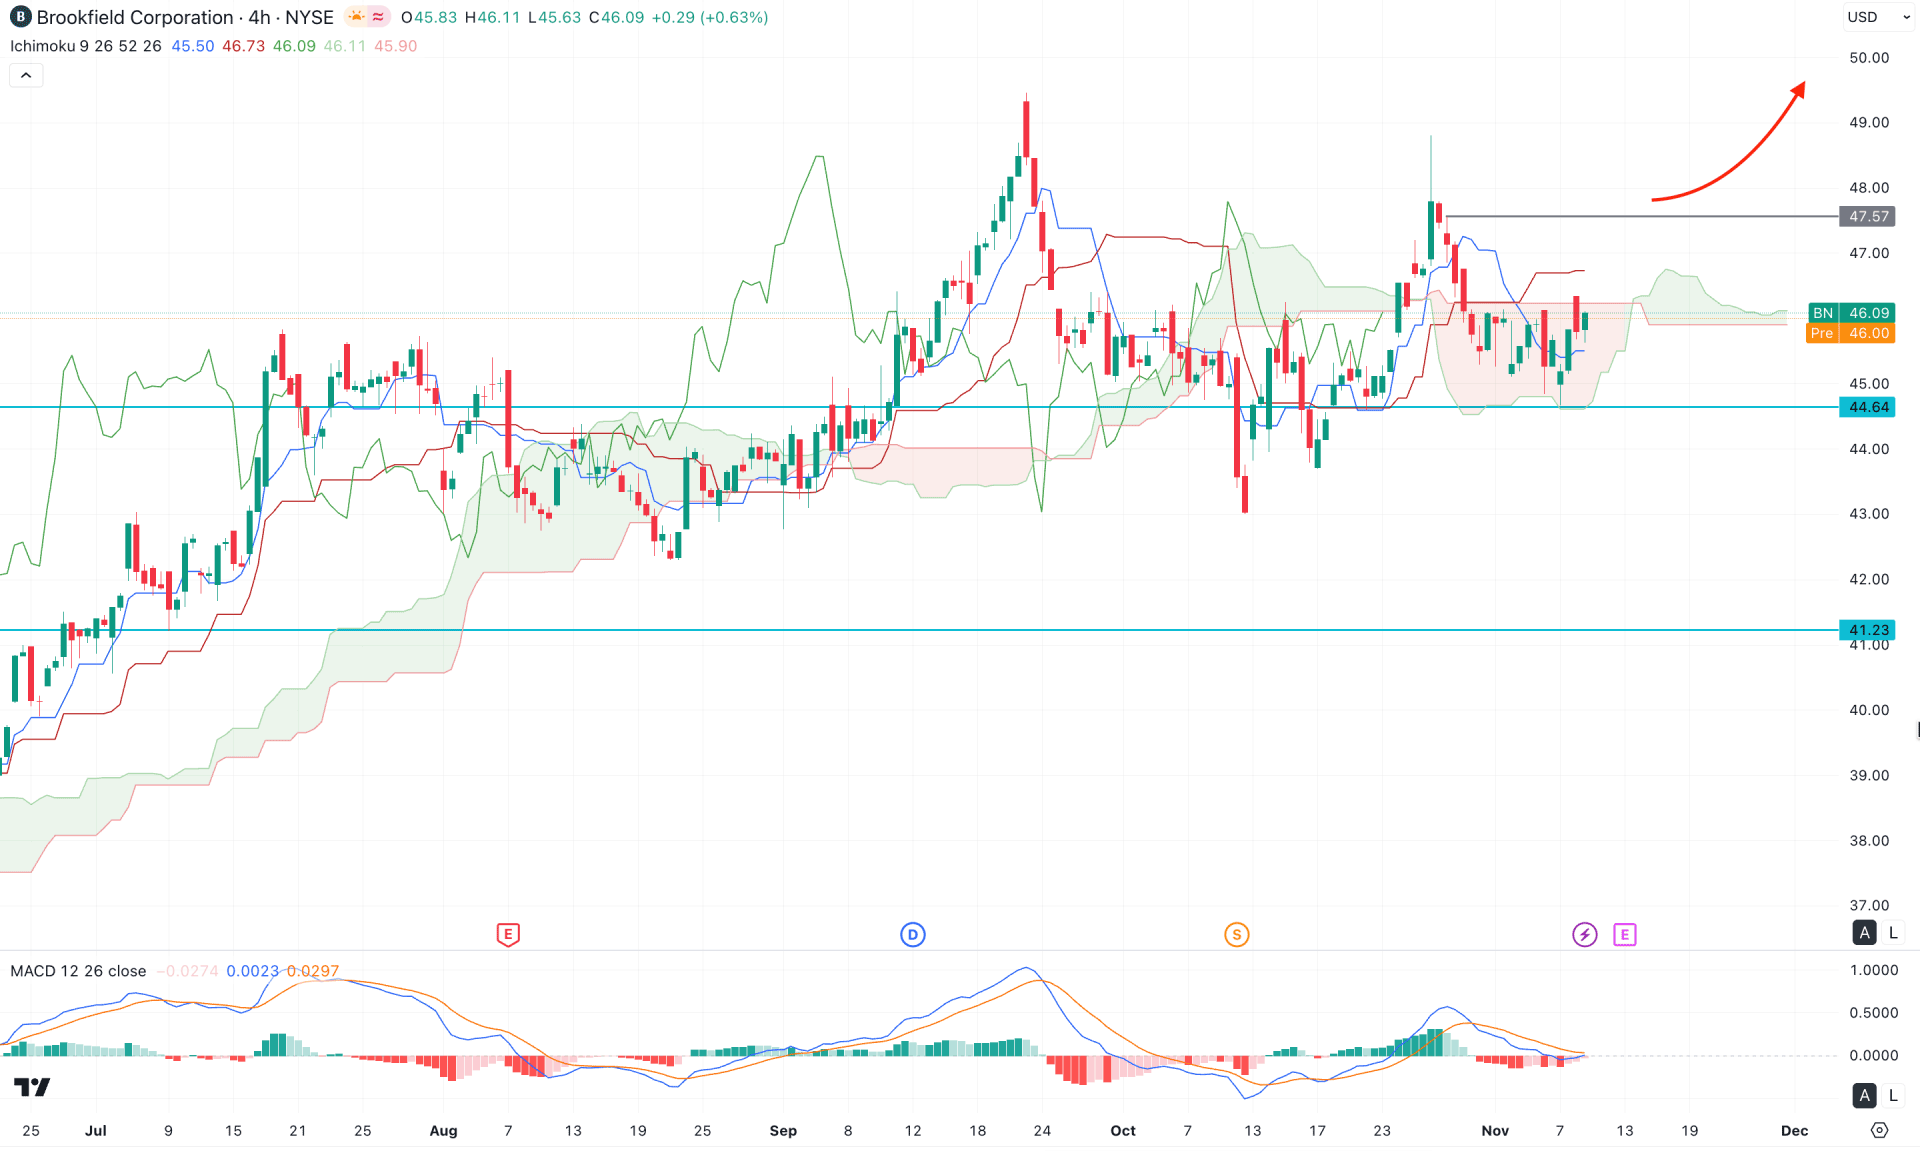
In the 4-hour timeframe, a bullish break of structure is visible above the Ichimoku Cloud area, while the current price is trading sideways within the cloud. A clear bullish breakout from the cloud zone is needed to confirm continuation to the upside, where the Kijun-sen level is acting as a crucial resistance area.
Looking at the future cloud, both leading span lines are pointing upward, suggesting sustained bullish momentum. Meanwhile, the MACD histogram is recovering from the negative zone toward the neutral point, indicating a shift in sentiment. Additionally, the MACD signal line is hovering above the neutral area, hinting at a potential bullish crossover, which could serve as a confirmation for long entries.
Based on the current market structure, Brookfield Corporation stock is more likely to extend buying pressure once it successfully breaks above the 47.57 resistance level. On the bullish side, a stable price above the Kijun-sen level could further strengthen momentum toward the 50.00 psychological level.
Conversely, immediate support lies around 44.64, and a break below this zone could temporarily challenge the bullish outlook — though the structure remains valid as long as the price holds above the 41.23 support level.
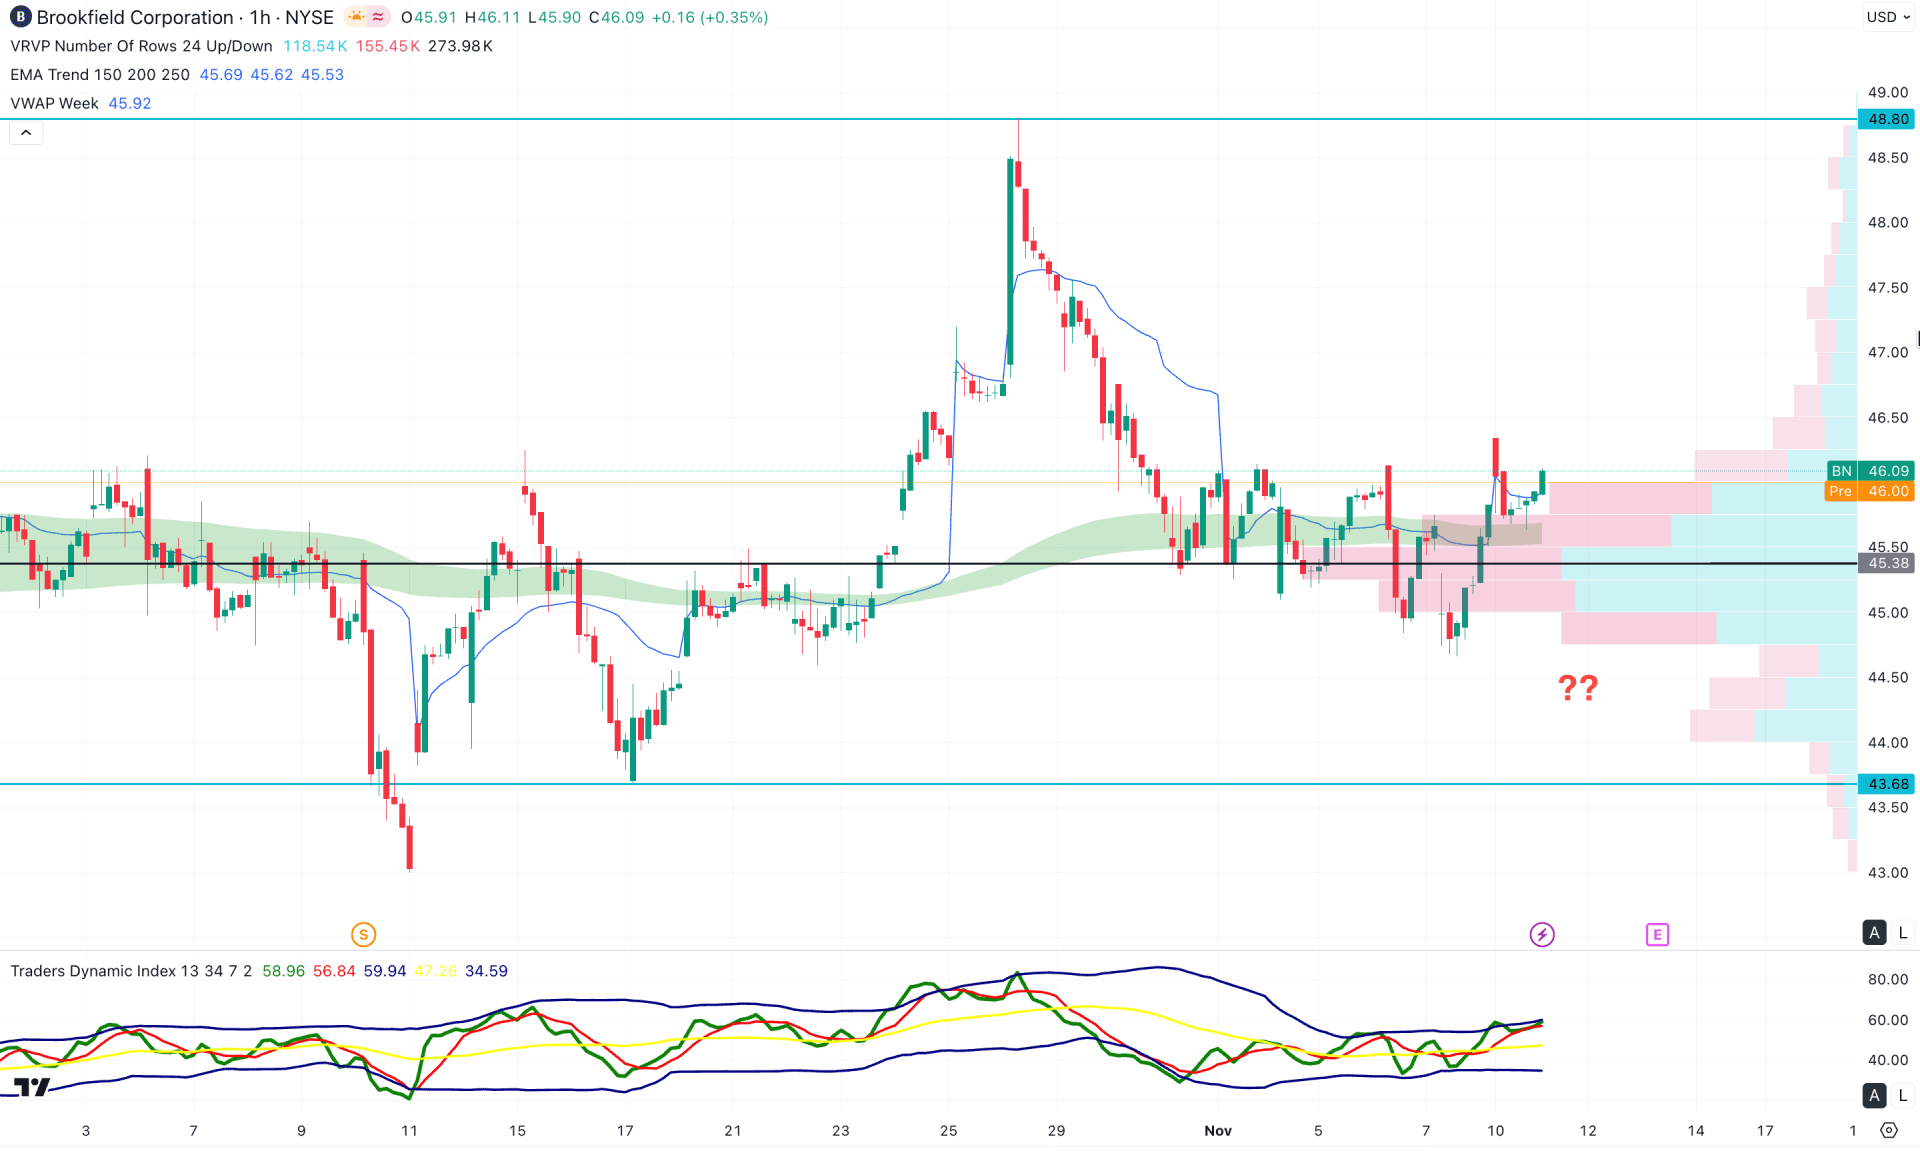
On the hourly timeframe, the current price is trading above the visible range high-volume node, suggesting corrective buying pressure emerging from the bottom. Additionally, the weekly VWAP level is positioned close to the current price, supported by the Exponential Moving Average wave. Since both dynamic lines are positioned below the current price, investors might expect a bullish continuation opportunity soon.
In the secondary indicator window, the Traders Dynamic Index (TDI) has reached its bullish peak, indicating ongoing buying momentum. In this scenario, we may expect bulls to dominate the market as long as the TDI level remains above the 50.00 neutral line.
Based on the overall market structure, a bullish rebound from the 44.50 bottom suggests potential buying pressure in the market. If the price manages to break above the 48.50 high, it could serve as a strong bullish confirmation, with the ultimate target set near the 48.80 key resistance level.
Conversely, a failure to hold above the 45.38 intraday high may trigger a short-term decline, with the next support level expected around the 43.68 area.
Based on the overall market outlook, Brookfield Corp (BN) stock is trading within a bullish continuation phase, where a potential bullish range breakout is needed to extend the ongoing upward trend. As the current market pressure remains on the buyers' side, any breakout above the range high could present a high-probability trend trading opportunity.


