
Published: May 9th, 2024
In the current month, the chip maker's stock (AVGO) declined 1.93%, which is lower than the gains of 0.89% for the Computer and Technology sector and 0.35% for the S&P 500.
Investors avidly anticipate Broadcom Inc.'s forthcoming earnings report, slated for June 12, 2024. Analysts predict earnings of $10.70 per share, which signifies a moderate increase of 3.68% from the previous year. The anticipated revenue of $11.95 billion represents a significant increase of 36.87% compared to the corresponding quarter of the previous year.
Analysts Estimate project annual revenues of $50.37 billion and earnings per share of $46.95 for the entire fiscal year. These figures represent growth rates of +11.12% and +40.61%, respectively, compared to the previous year.
Additionally, valuation metrics are vital factors to consider. Broadcom Inc. exhibits a Forward Price-to-Equity (P/E) ratio of 27.91, which signifies a discount compared to the industry mean of 35.78.
Moreover, with a PEG ratio of 2.04, AVGO demonstrates a prudent equilibrium between its price and the anticipated growth of its earnings. In contrast, the Electronics-Semiconductors sector exhibited a mean PEG ratio of 3.07 during the preceding trading session.
Let's see the further aspect of this stock from the AVGO technical analysis:
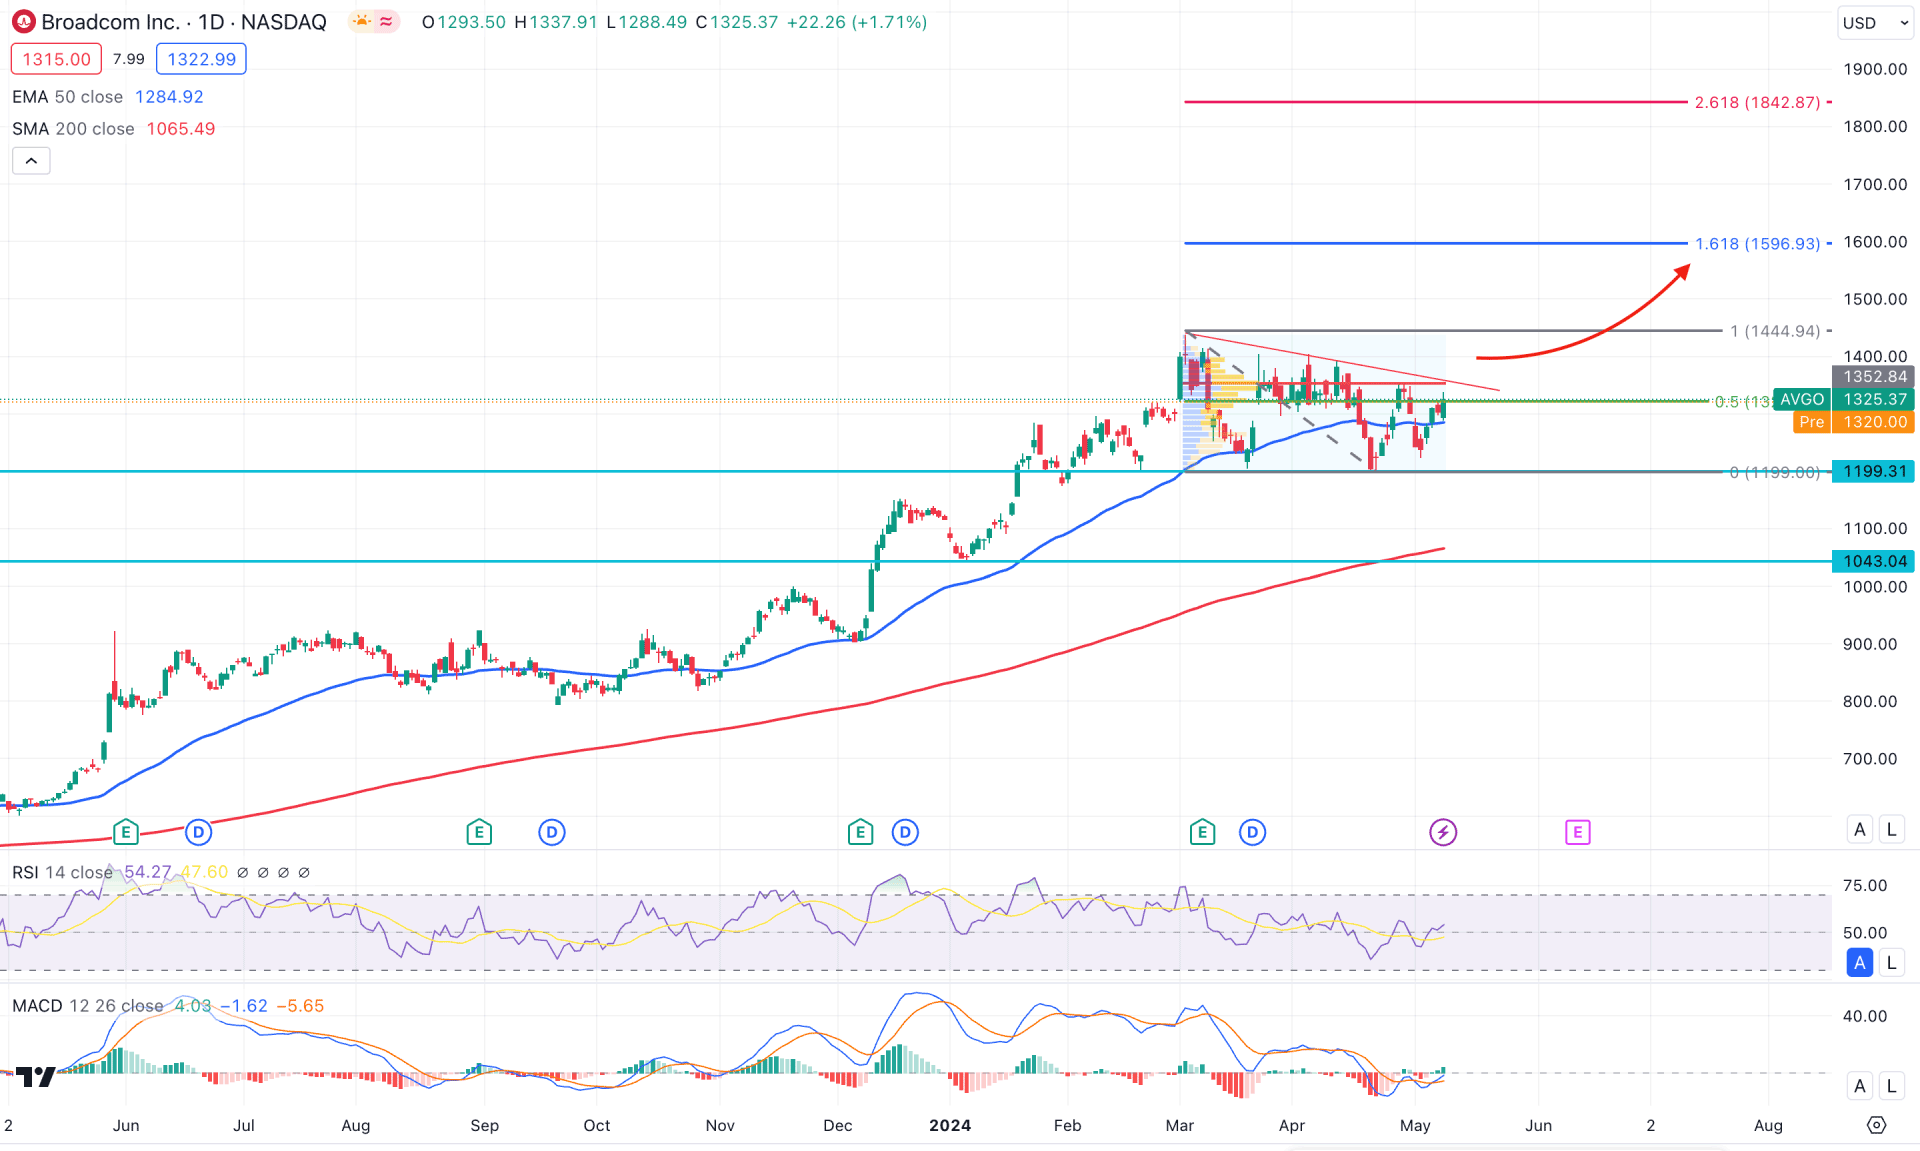
In AVGO's daily chart, a clear bullish trend is visible. Classic technical analysis could offer a decent long opportunity from a trend continuation strategy.
A proper validation must come from the higher timeframe, where the last two monthly candles showed an indecision following the major trend. The classic approach considers the Doji candlestick as a continuation signal for a major trend. The weekly price shows what is inside the monthly doji candles- in a rectangle pattern. Therefore, the weekly rectangle breakout above the 1401.74 weekly resistance could work as a confluence bullish factor shown in the monthly chart.
In the daily price, the 200-day Simple Moving Average aimed higher and moved above the 1043.03 static line, suggesting major support. Moreover, the 50-day Exponential Moving Average is closer to the current price, supported by a bullish V-shape recovery.
The indicator window shows the same story. The MACD Histogram moved above the neutral line, supported by the bullish crossover in the signal lime. The Relative Strength Index (RSI) shows corrective momentum as the current level hovers just above the 50.00 line.
Based on the daily outlook of AVGO, investors should closely monitor how the price reacts to the current high volume level. The ideal bullish approach is to look for a daily candle above the current trendline resistance. Therefore, a bullish D1 candle above the 1932.94 level could be a valid long signal, targeting the 1600.00 psychological level. A stable market above the 1444.94 level could increase the possibility of reaching the 1842.87 Fibonacci Extension level.
On the other hand, a failure to hold the buying pressure above the trendline resistance could be a challenging factor for bulls. In that case, a daily candle below the 1222.46 swing low could lower the price in the coming days. In that case, another long opportunity might come after extending the loss towards the 1043.40 to 1000.00 area.
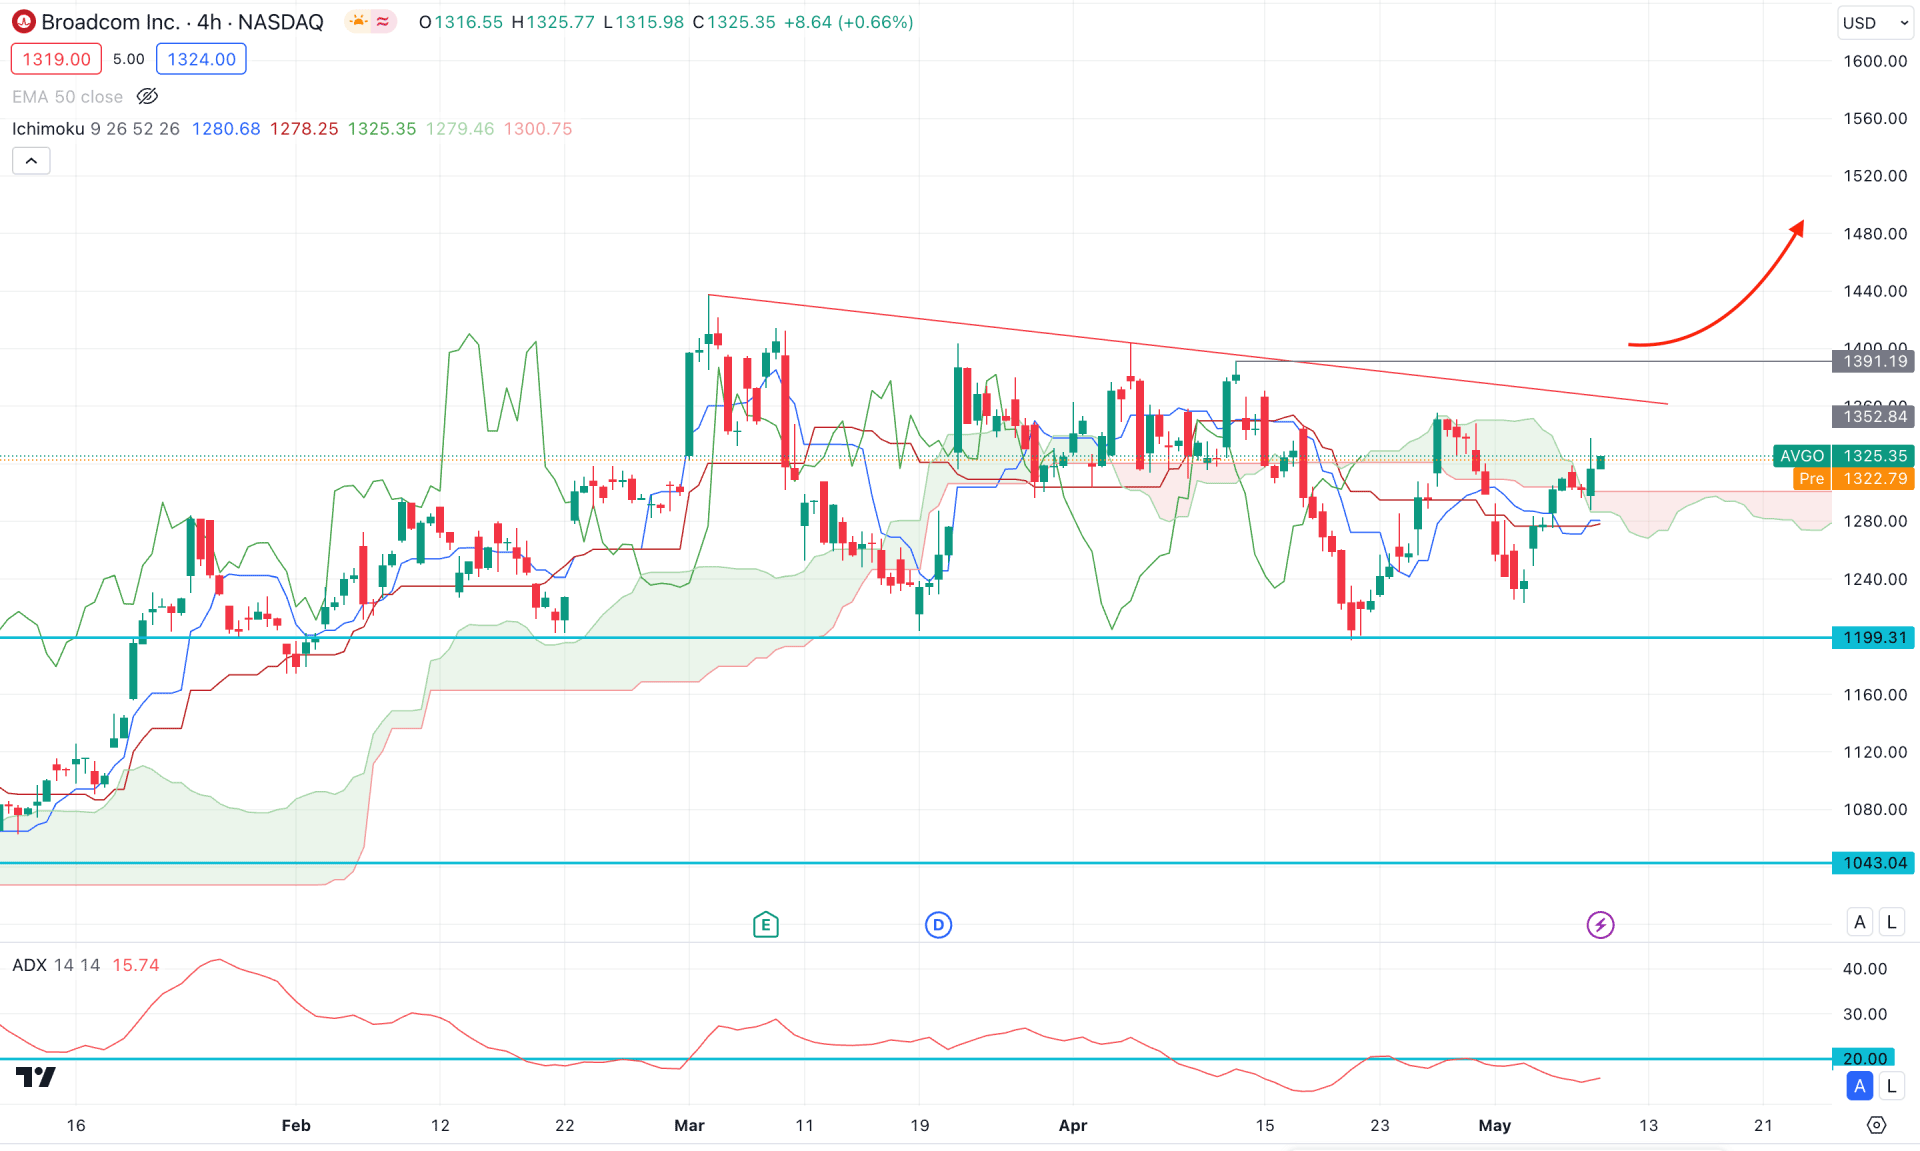
In the H4 timeframe, the overall market momentum is bullish, where the most recent price shows a consolidation above the dynamic Ichimoku Cloud zone. Moreover, the future cloud suggests a corrective structure where the Senkou Span B is flat.
In the indicator window, the Average Directional Index (ADX) suggests a corrective pressure as the current level is below the 20.00 line. However, the most recent level shows a bullish rebound, which needs a validation after overcoming the 20.00 line.
Based on the h4 structure, a high probability of a long opportunity might come after having a bullish H4 candle above the 1931.19 swing high. In that case, the bullish opportunity might extend towards the 1600.00 psychological line.
On the other hand, a deeper discount is possible, where a valid downside pressure below the dynamic Kijun Sen support could lower the price toward the 1043.00 support level.
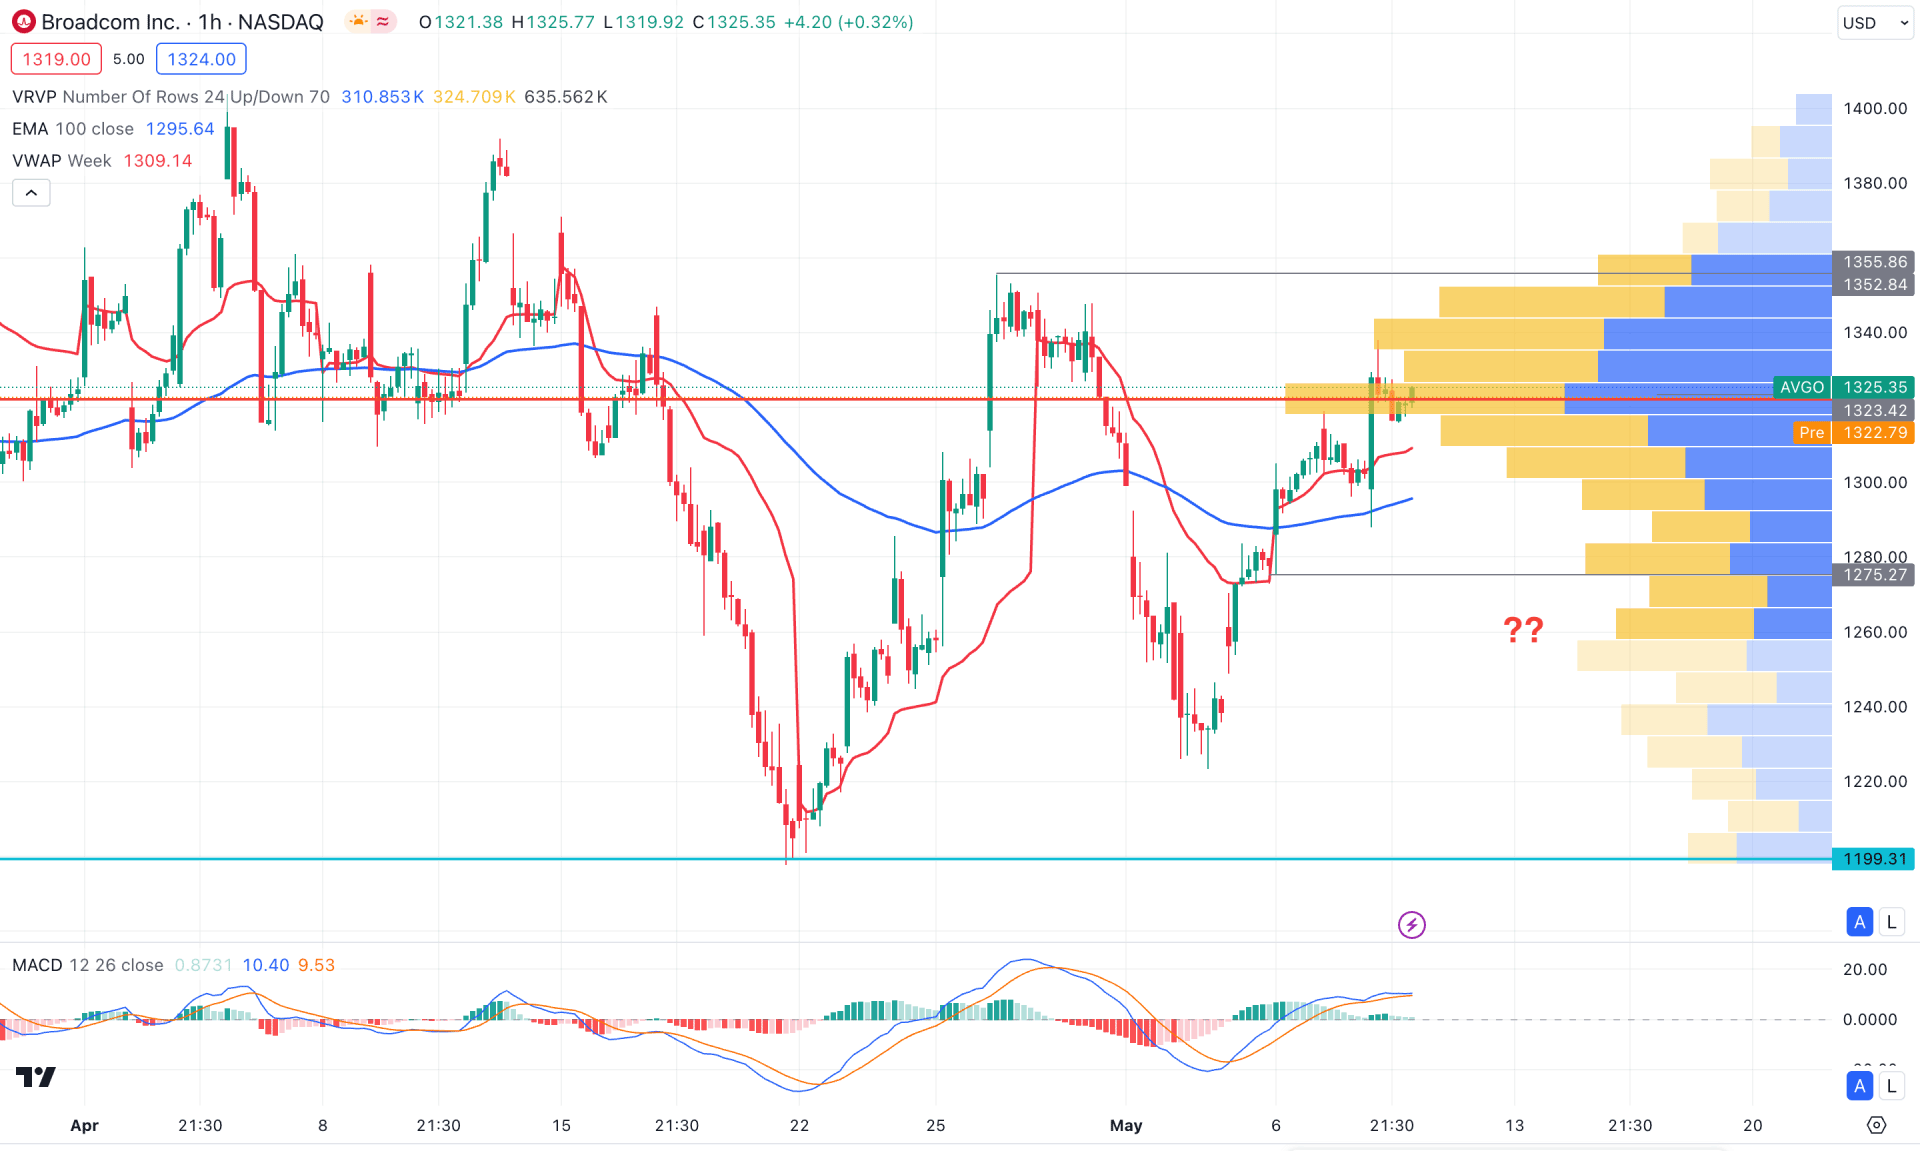
In the H1 timeframe, the current price trades in line with the visible range high volume level suggesting an ongoing order building. In that case, a potential breakout from this level could create an impulsive wave at any time. As the daily trend is bullish, any bullish breakout from the high-volume line could work well in this stock.
In the secondary window, the MACD Histogram remained sideways, where the signal line became flat at the bullish zone.
Based on the H1 structure, investors might expect a bullish trend after finding a breakout from the high volume line. However, an immediate downside pressure below the dynamic 50 EMA line could lower the price towards the 1240.00 level.
Based on the current market outlook, AVGO trades within a bullish trend, where a trend continuation strategy could offer a high probability of a long opportunity. Investors should closely monitor how the price trades at the daily trendline resistance before finding the potential long signal.


