
Published: August 15th, 2023
As Broadcom Inc. approaches its forthcoming earnings report slated for August 31, 2023, investors are anxiously anticipating a great result from the company.
On that day, it is anticipated that Broadcom Inc. would report earnings of $10.42 per share, representing a noteworthy growth of 7.09% from the prior year. According to our most recent average estimate, revenue for the quarter would total $8.86 billion, up 4.64% from the same time the previous year.
The yearly Consensus Estimates predict $42.08 in profits per share and $35.76 billion in revenue. If accomplished, these numbers would represent tremendous increases of +11.8% and +7.69%, respectively, from the previous year.
Additionally, investors need to be aware of recent alterations to analyst forecasts for Broadcom Inc. These alterations usually reflect the most recent short-term business trends, which are subject to frequent change. Therefore, upbeat improvements in these projections can be seen as encouraging signs for the company's future prospects.
Should you buy Broadcom stock now? Let’s see the complete price outlook from the Broadcom Stock (AVGO) technical analysis:
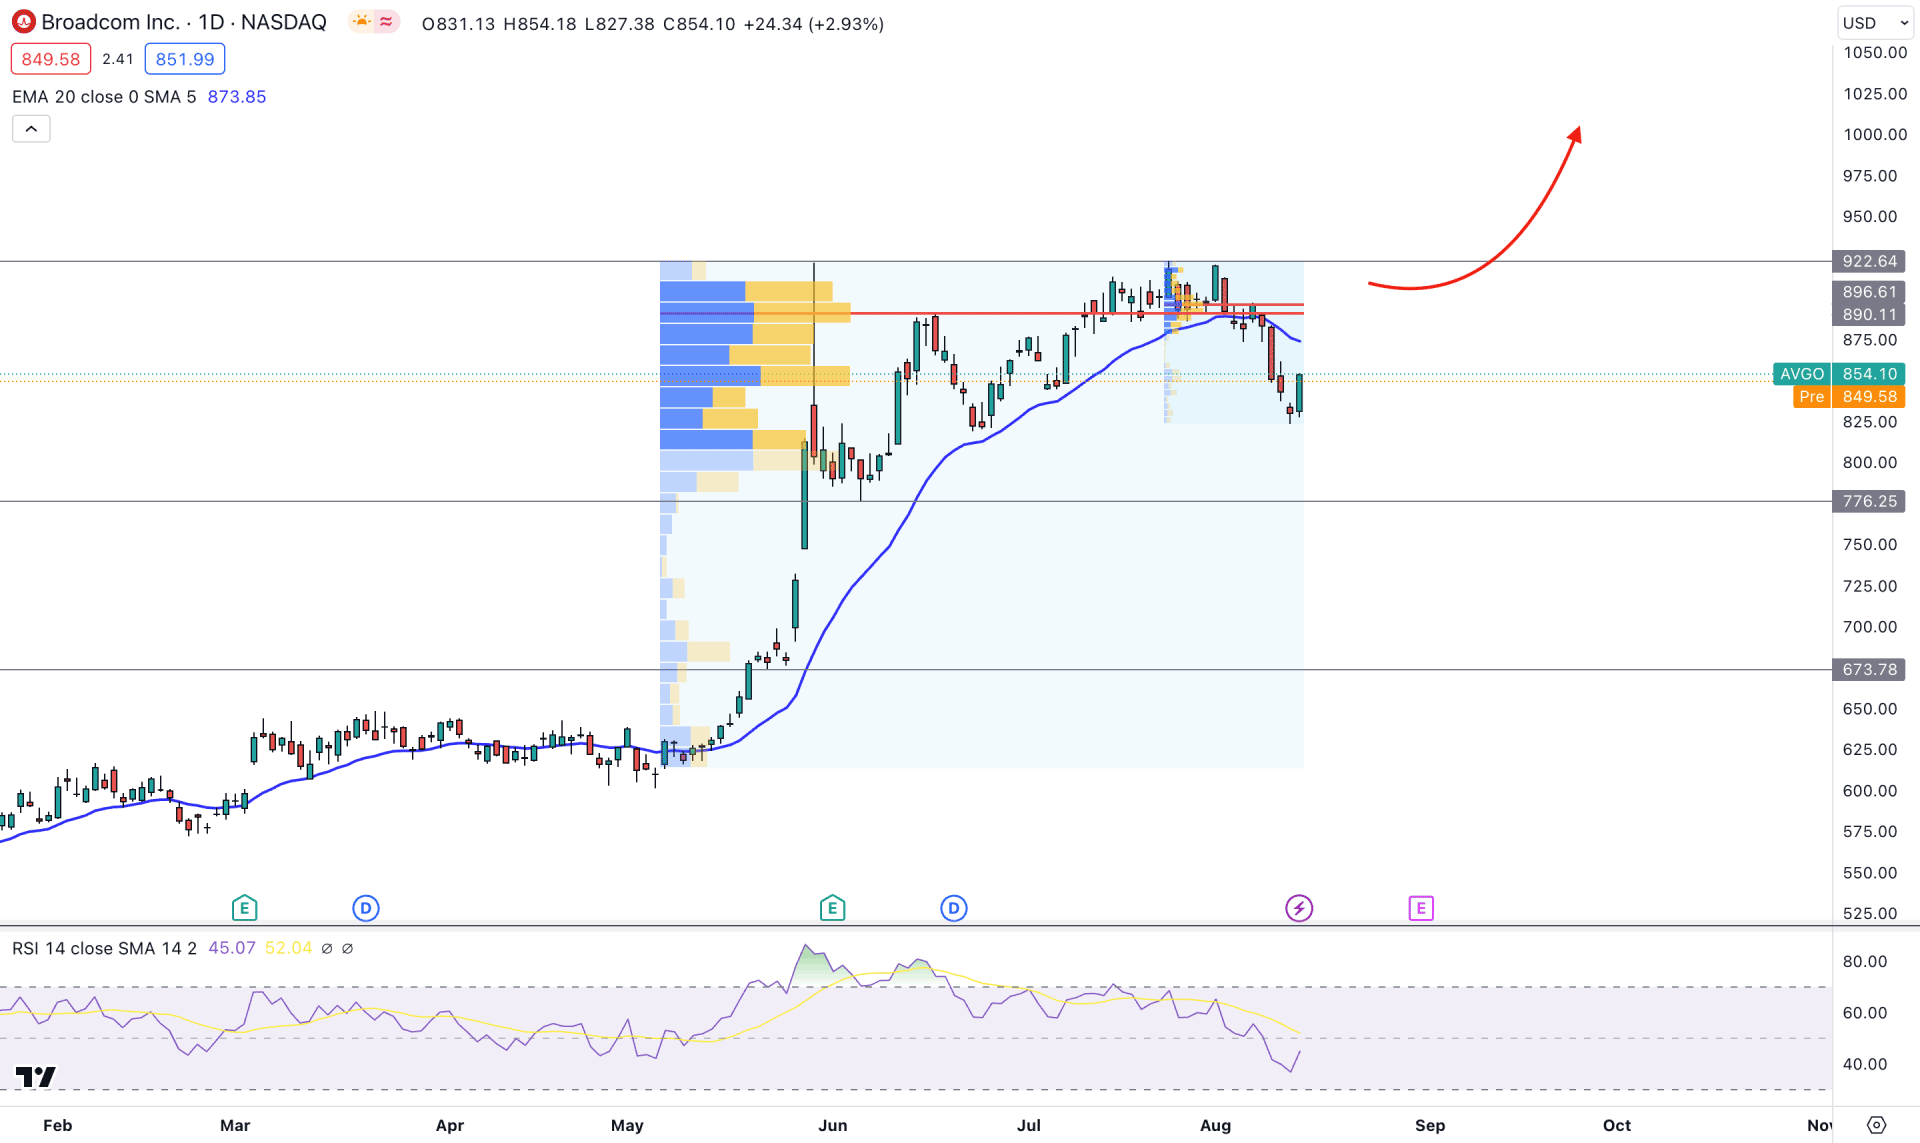
In the daily price of AVGO, the overall structure is bullish, supported by an upward slope in the dynamic 20-day EMA. Also, the higher timeframe price action is bullish with a solid fundamental outlook.
Despite the existing bullish trend, the current monthly candlestick formation shows a reversal possibility as it took July 2023 low and formed a bearish weekly candle below this. Moreover, the latest weekly candlestick came bullish within a strong bearish close, which is a sign of an Inside Bar trend continuation pattern. Based on the higher timeframe’s price action, bullish momentum needs a solid rebound before offering the trend continuation.
A similar behavior is visible with the volume structure. As per the high volume level indicator, the highest volume level since 05 May is at 890.11 level, which is above the current price. Another high volume level from 25 July 2023 is spotted at the 896.61 level, which is barely above the previous level. As these highest activity levels are above the current price, we can say that an existing bearish momentum is present in the market.
In the main chart window, the dynamic 20 EMA is working as a resistance, while the current RSI is below the 50.00 line.
Based on the daily price outlook of AVGO, a strong bullish recovery needs a valid price action above the 892.00 level before aiming for the 1000.00 psychological level.
On the other hand, the existing selling pressure might regain momentum at any time, where the next support level is at 776.25 level.
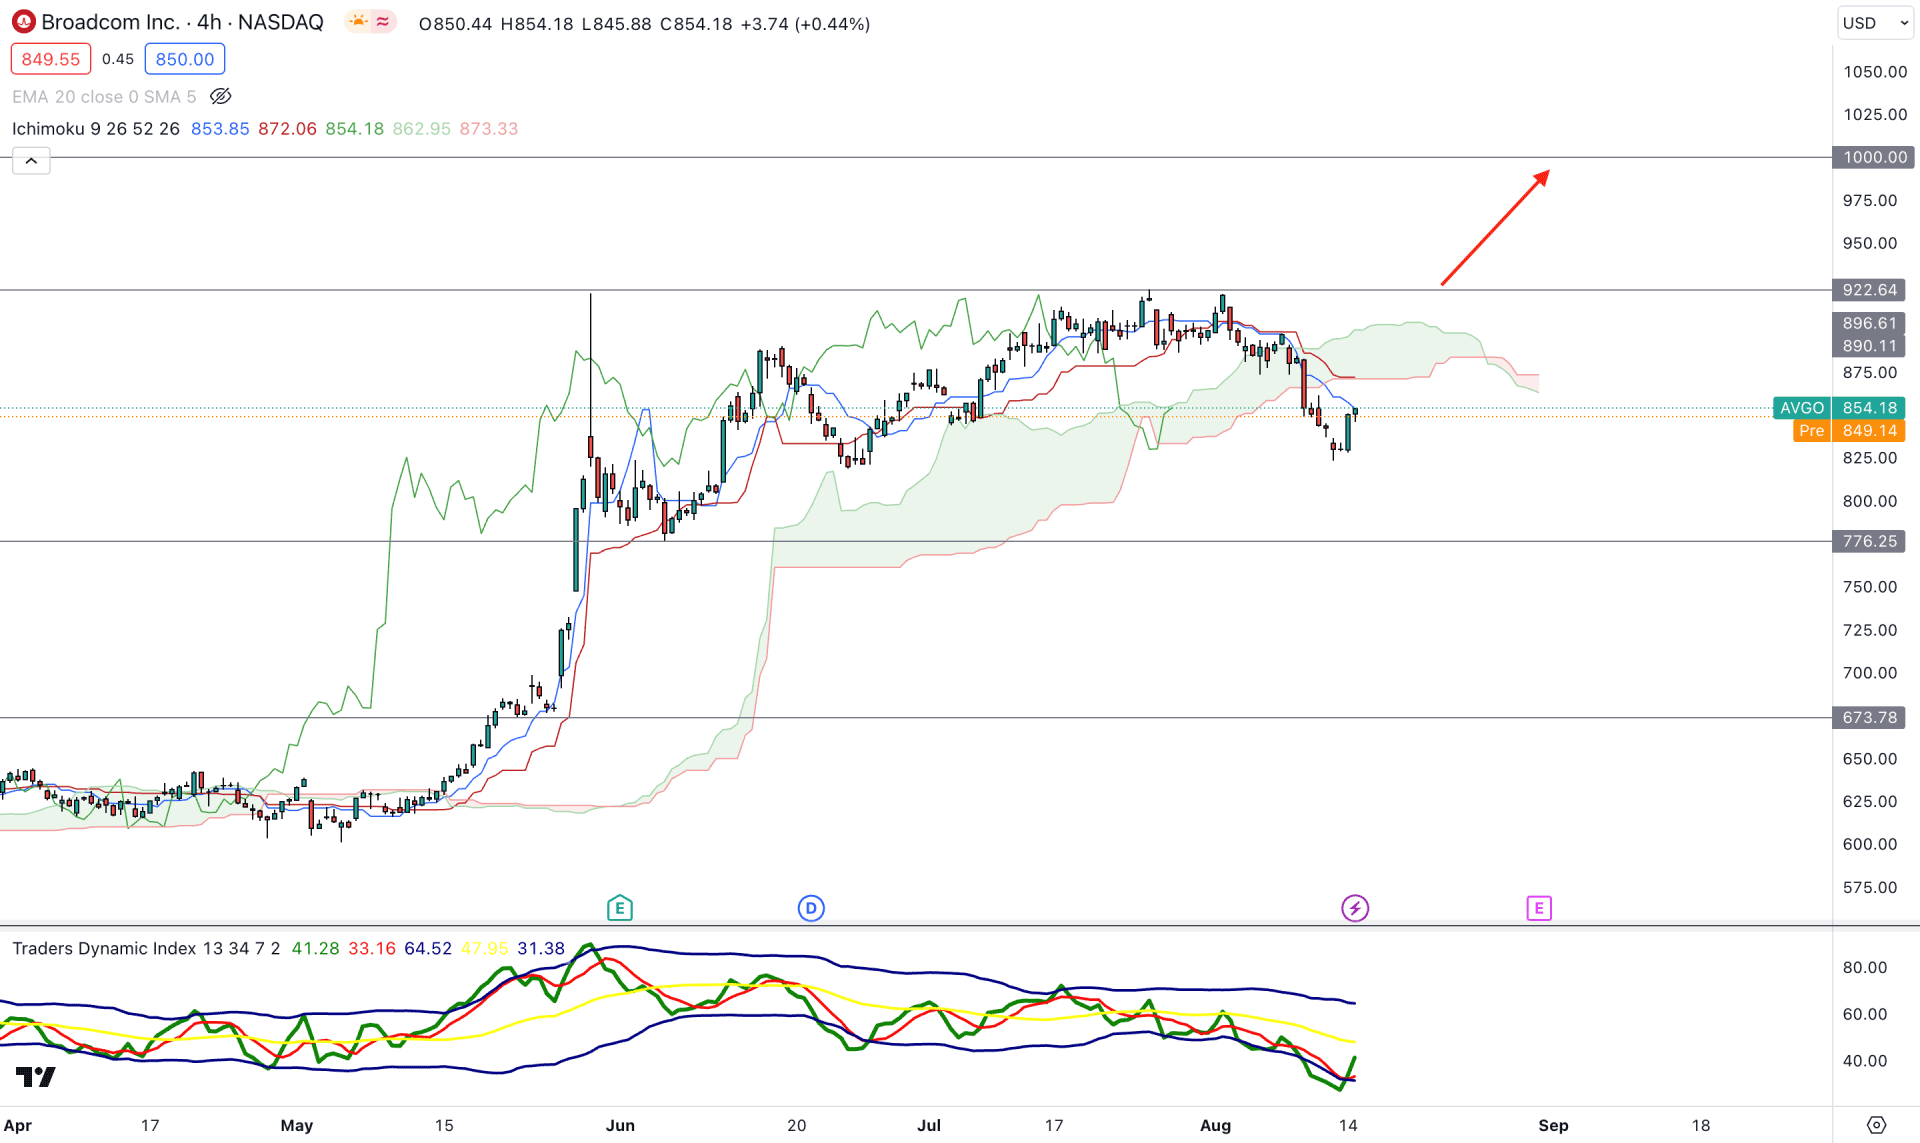
In the H4 timeframe, the broader outlook in the AVGO stock is corrective as the current price is trading below the Kumo Cloud with corrective price action.
In the future cloud, the Senkou Span A is below B, which is a sign of potential downside pressure in the market. However, there is no significant selling pressure during the bearish Cloud breakout, which signals a less sellers presence in the market. The Traders Dynamic Index shows an oversold market behavior as the current TDI level is at the lower band area.
Based on the H4 structure, the current market momentum in the AVGO price is bearish but an immediate rebound with a bullish H4 candle above the 922.64 level could resume the existing buying trend any time.
On the other hand, an additional bearish rejection from the dynamic Kijun Sen could lower the price in the coming days.
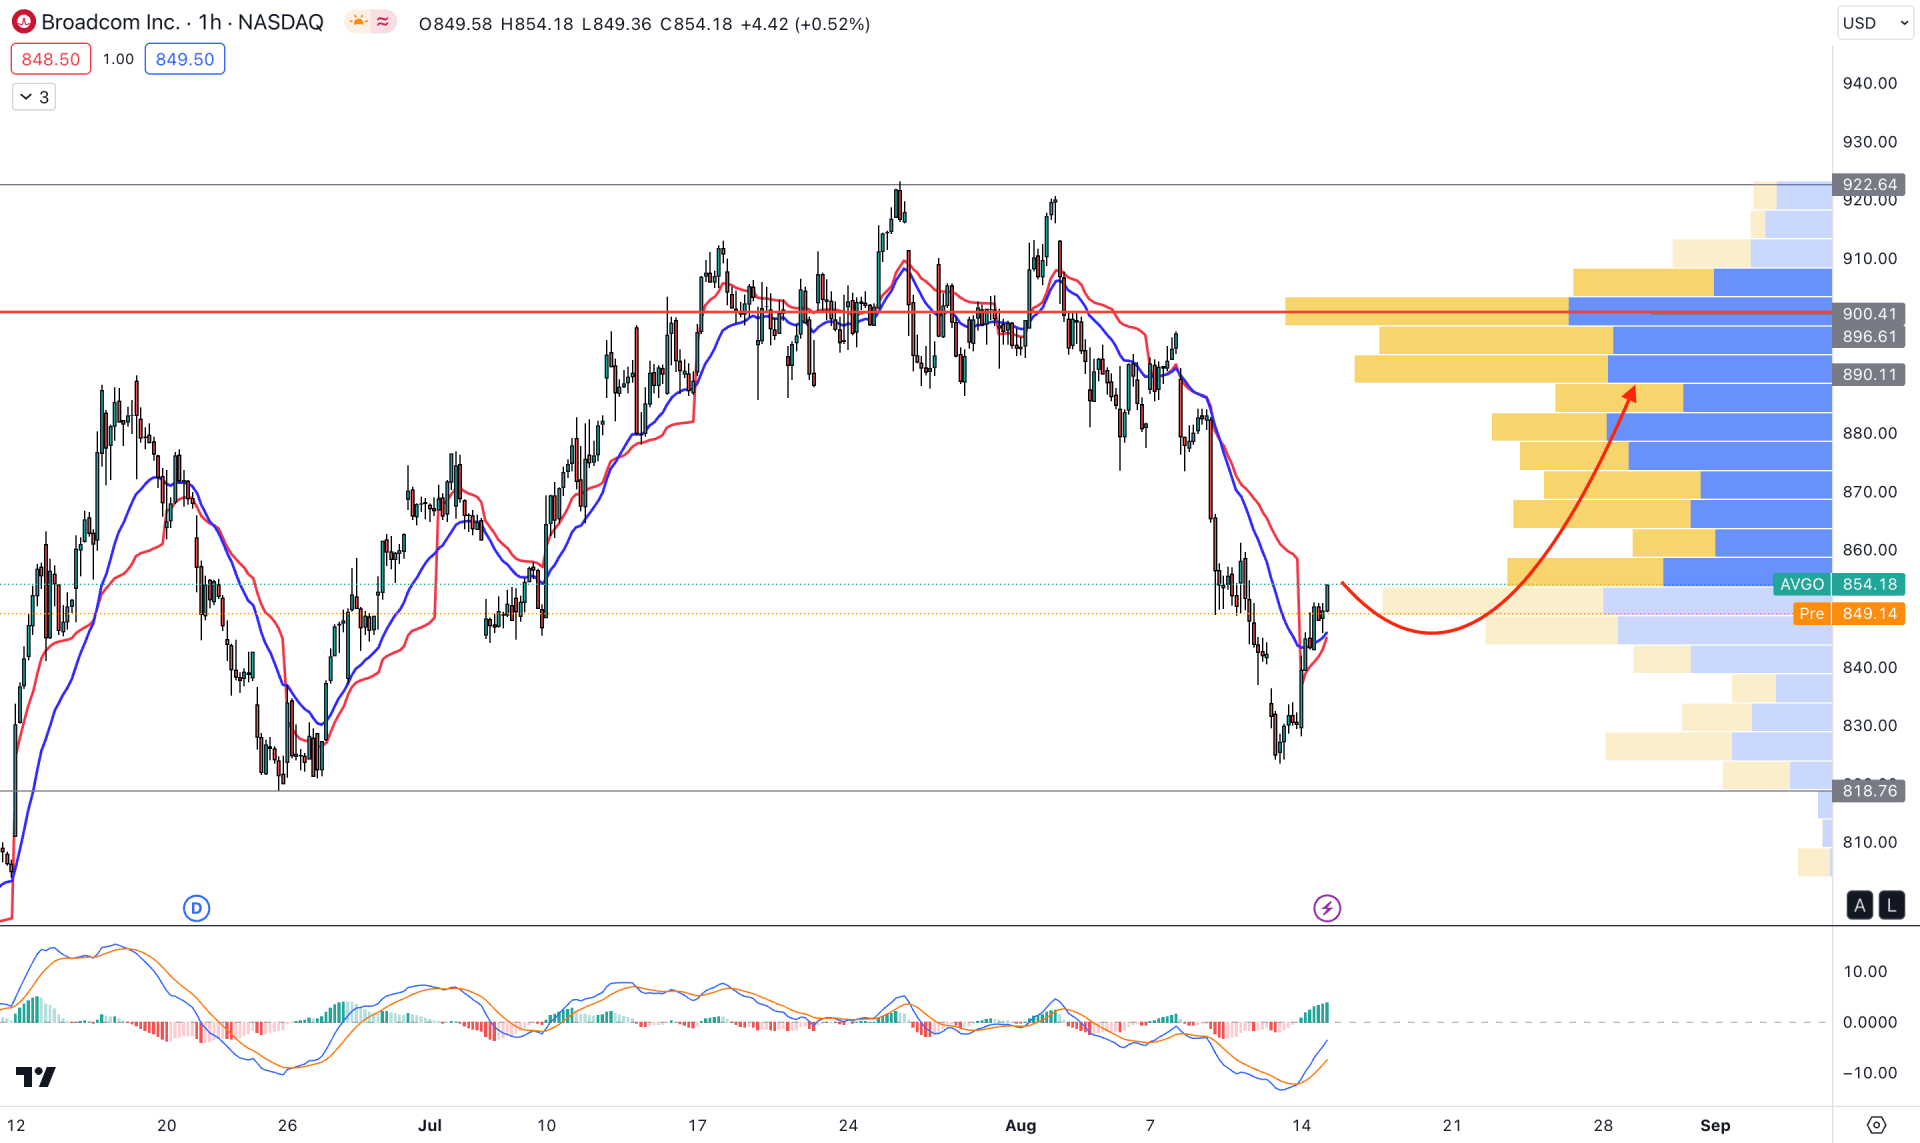
In the hourly chart, the current price is trading below the visible range high volume level, which signals a strong bearish momentum. However, the gap between the prince and the high volume level has widened, which may result in a bullish correction.
In the indicator window, the current MACDHistogram is bullish, while the MACD EMA’s are offering a bullish possibility from the crossover formation.
Based on the H1 structure, a minor upside correction is pending, but a bearish rejection from the 860.00 to 890.00 zone could be a bearish possibility. However, a bullish H1 candle above the 900.00 level could eliminate the downside possibility and increase the price toward the 950.00 area.
Based on the current market outlook, Broadcom stock needs a solid buyer presence before offering the trend continuation opportunity. As of now, the bearish pressure is potent, where any intraday bearish rejection could be a short opportunity.


