Published: September 3rd, 2024
Several analysts recommend purchasing Broadcom Inc., but it might not be a good idea to jump into this without having a clear outlook. Numerous studies have demonstrated that brokerage suggestions have little to no success in helping investors choose equities with the highest potential for price growth.
This indicates that these institutions' goals do not necessarily coincide with regular investors' goals, making it difficult to predict how a stock's price will move. Therefore, the best action would be to use this data to support your evaluation or a stock price prediction tool with a strong track record of accuracy.
Regarding adjustments to Broadcom Inc.'s earnings projection, the Wall Street Consensus projection for the current quarter is $1.21 with $4.72 for a full year. After consecutive 6 quarters of showing upbeat earnings, the current projection would be significant as it remains above the average.
An unchanging consensus projection suggests that analysts' stable opinions about the company's profit outlook may be a valid explanation for the stock's immediate market-beating performance. Moreover, the P/E ratio of 24.22 and P/S ratio of 9.90 might signal a stable momentum against its peers.
Let's see the upcoming price projection from the AVGO technical analysis:

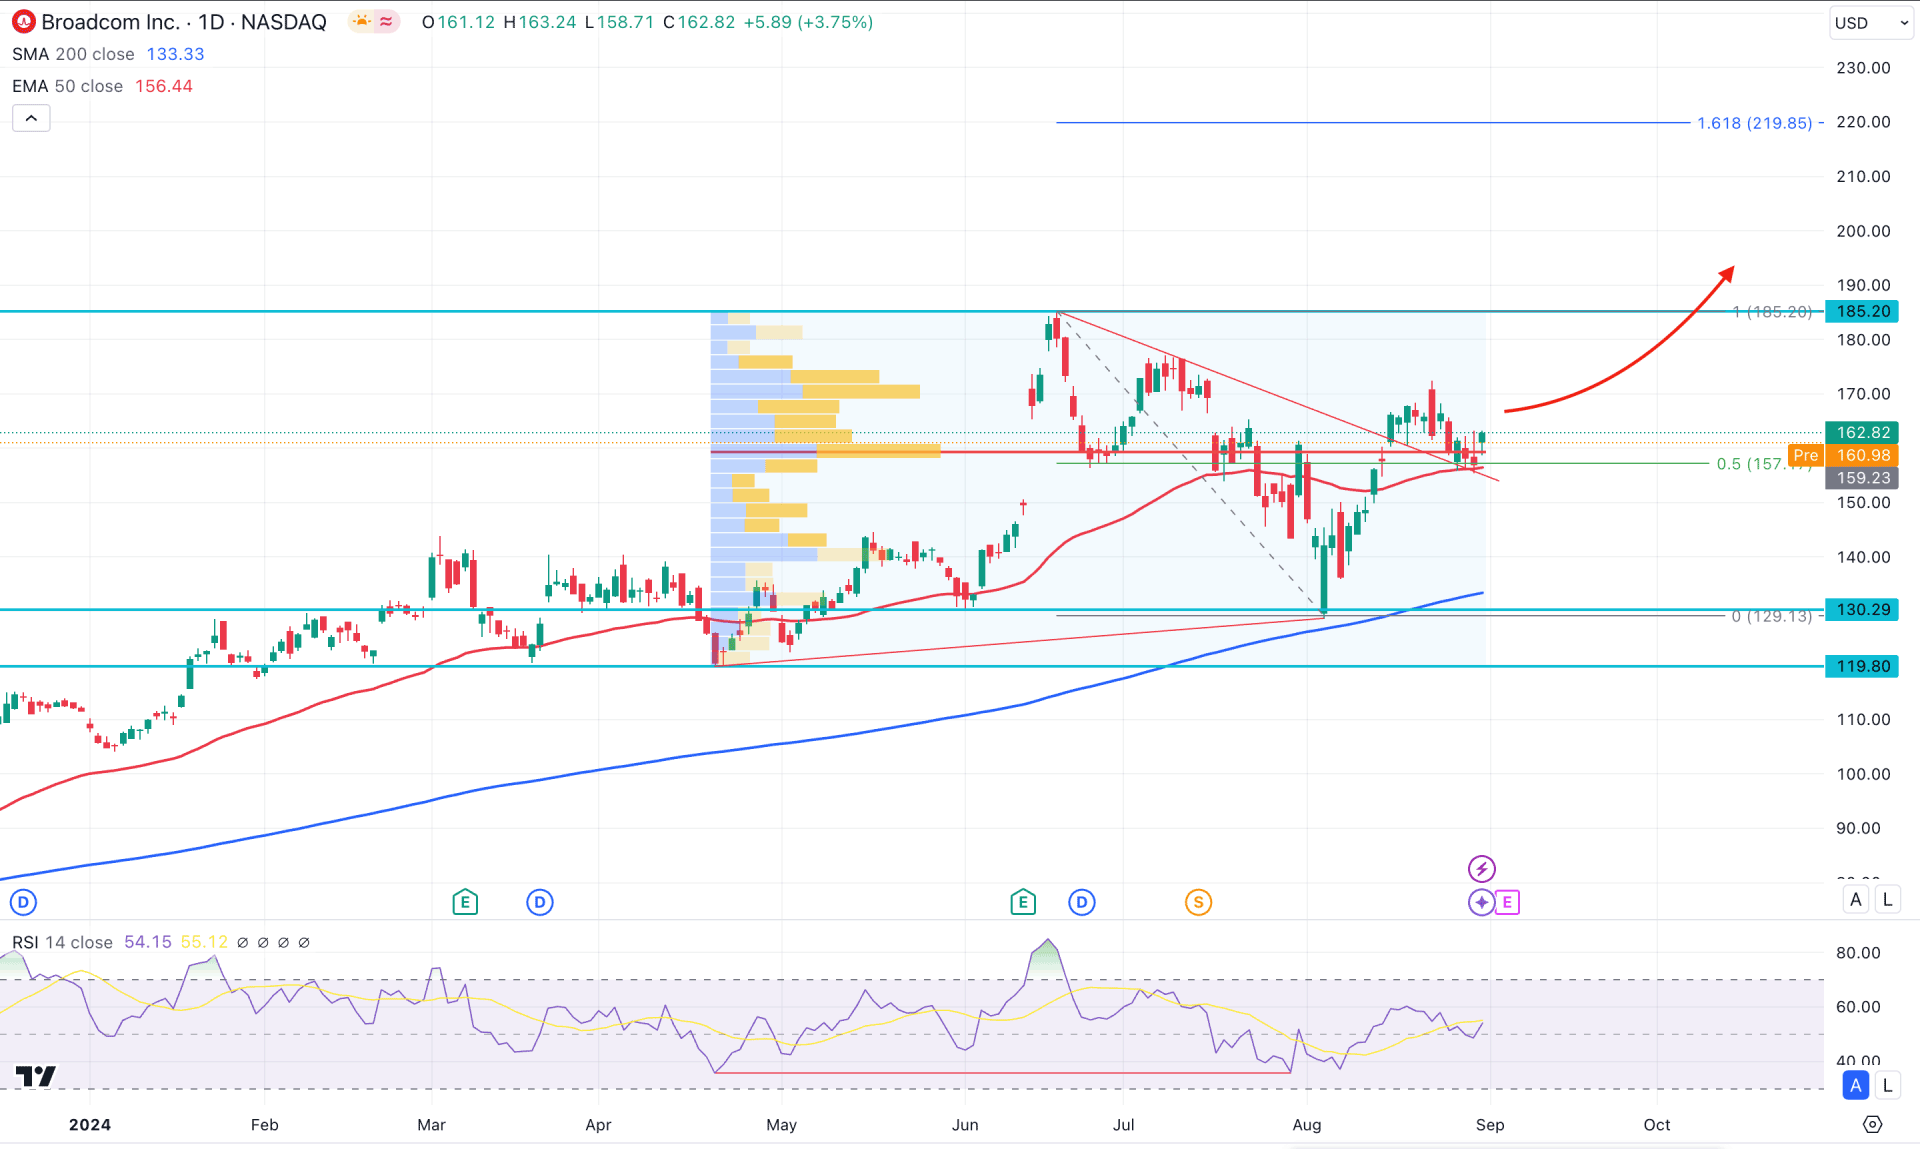
In the daily chart of AVGO, the long-term market direction is bullish, where the latest price is trading as a bullish continuation signal.
In the long-term outlook, the monthly candle is trading as a strong bullish continuation opportunity from the Fakey formation. Also, the latest weekly candle is trading higher after a valid bullish reversal candlestick, which might work as a continuation signal.
The upward signal in the daily price action is clear as the ongoing sideways market is present above the trendline resistance. The dynamic 200 day Simple Moving Average is working as a major support, creating a bullish cross at the 130.29 static level. Moreover, the 50 day Exponential Moving Average is closer to the current price, working as an immediate support. As the price keeps moving higher for a prolonged time, an upward signal from the recent time frame might work as a decent trading opportunity in this stock.
Combining the price action with the market volume is crucial to determine a stock's price direction. For AVGO, the volume structure shows the same way as the dynamic line. The most significant level since April 2024 is just below the current price, working as a strong support. Also, the ongoing sideways market above the high volume line suggests an active buyers presence in the market.
Based on the daily price action of AVGO, a bullish possibility is highly possible. The current price faces trendline support with a Divergence formation at the Relative Strength Index (RSI). In that case, the upward possibility is potent as long as the price hovers above the 150.00 psychological line, which may extend the upward movement towards the 219.85 Fibonacci Extension level.
The alternative approach is to find a discounted price to go long after having a downside pressure at the 200-day SMA area. In that case, an additional bullish signal from the 130.00 to 119.20 area is possible but breaking below the 119.00 line might invalidate the bullish possibility and lower the price towards the 100.00 to 80.00 zone.

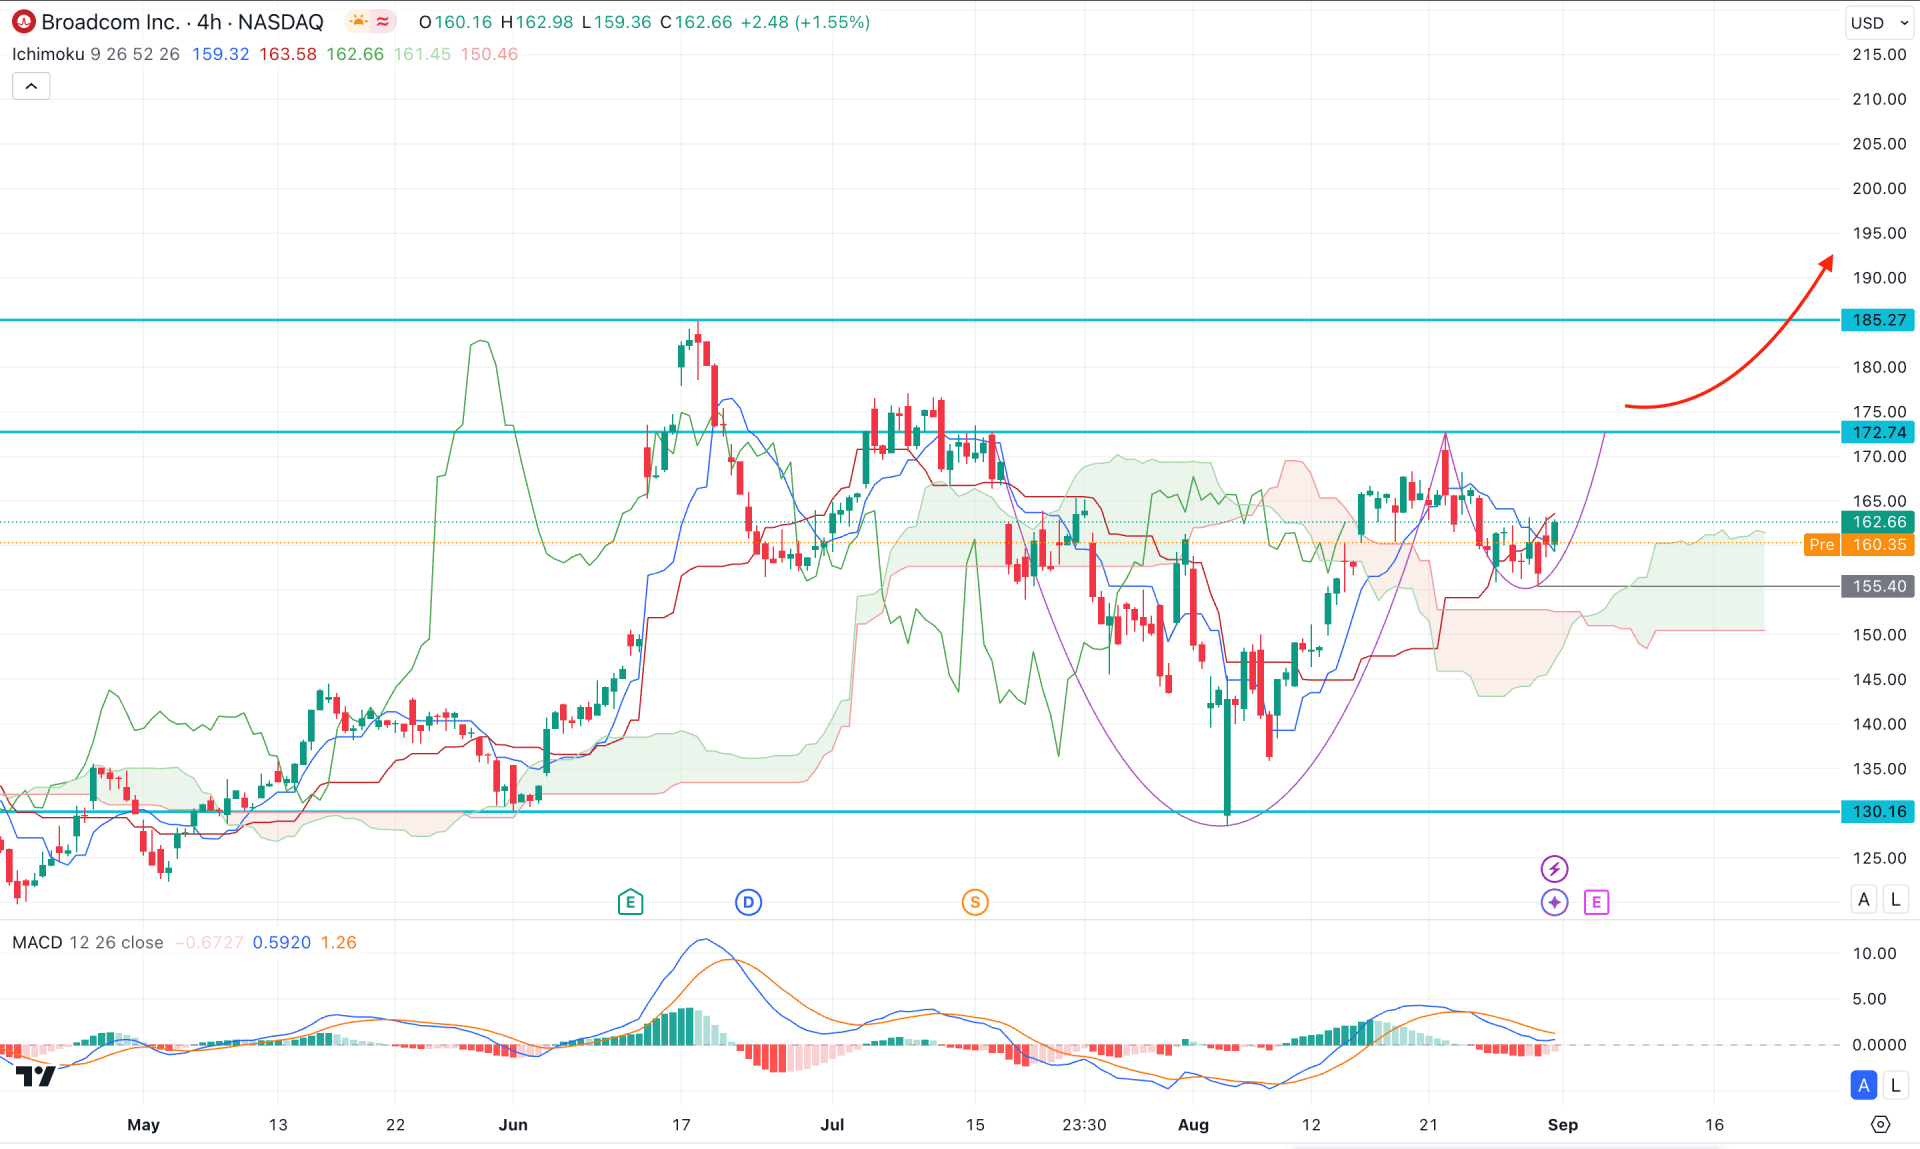
In the H4 timeframe, the most recent price consolidated above the Cloud zone, suggesting ongoing buying pressure. Moreover, the futures cloud is positive, where the Senkou Span A keeps moving higher above the Senkou Span B.
On the other hand, the recent bullish U-shape recovery from the 130.00 bottom indicates a possible Cup and Handle pattern breakout above the cloud zone. A bullish crossover is present in the dynamic line, which might work as a confluence of buying pressure.
Based on the H4 structure, a valid bullish H4 candle above the 172.74 level would signal a potential Cup and Handle breakout, aiming for the 200.00 psychological line.
On the other hand, a bearish shift in the MACD Histogram with an H4 candle below the 155.40 level might lower the price toward the 140.00 area.

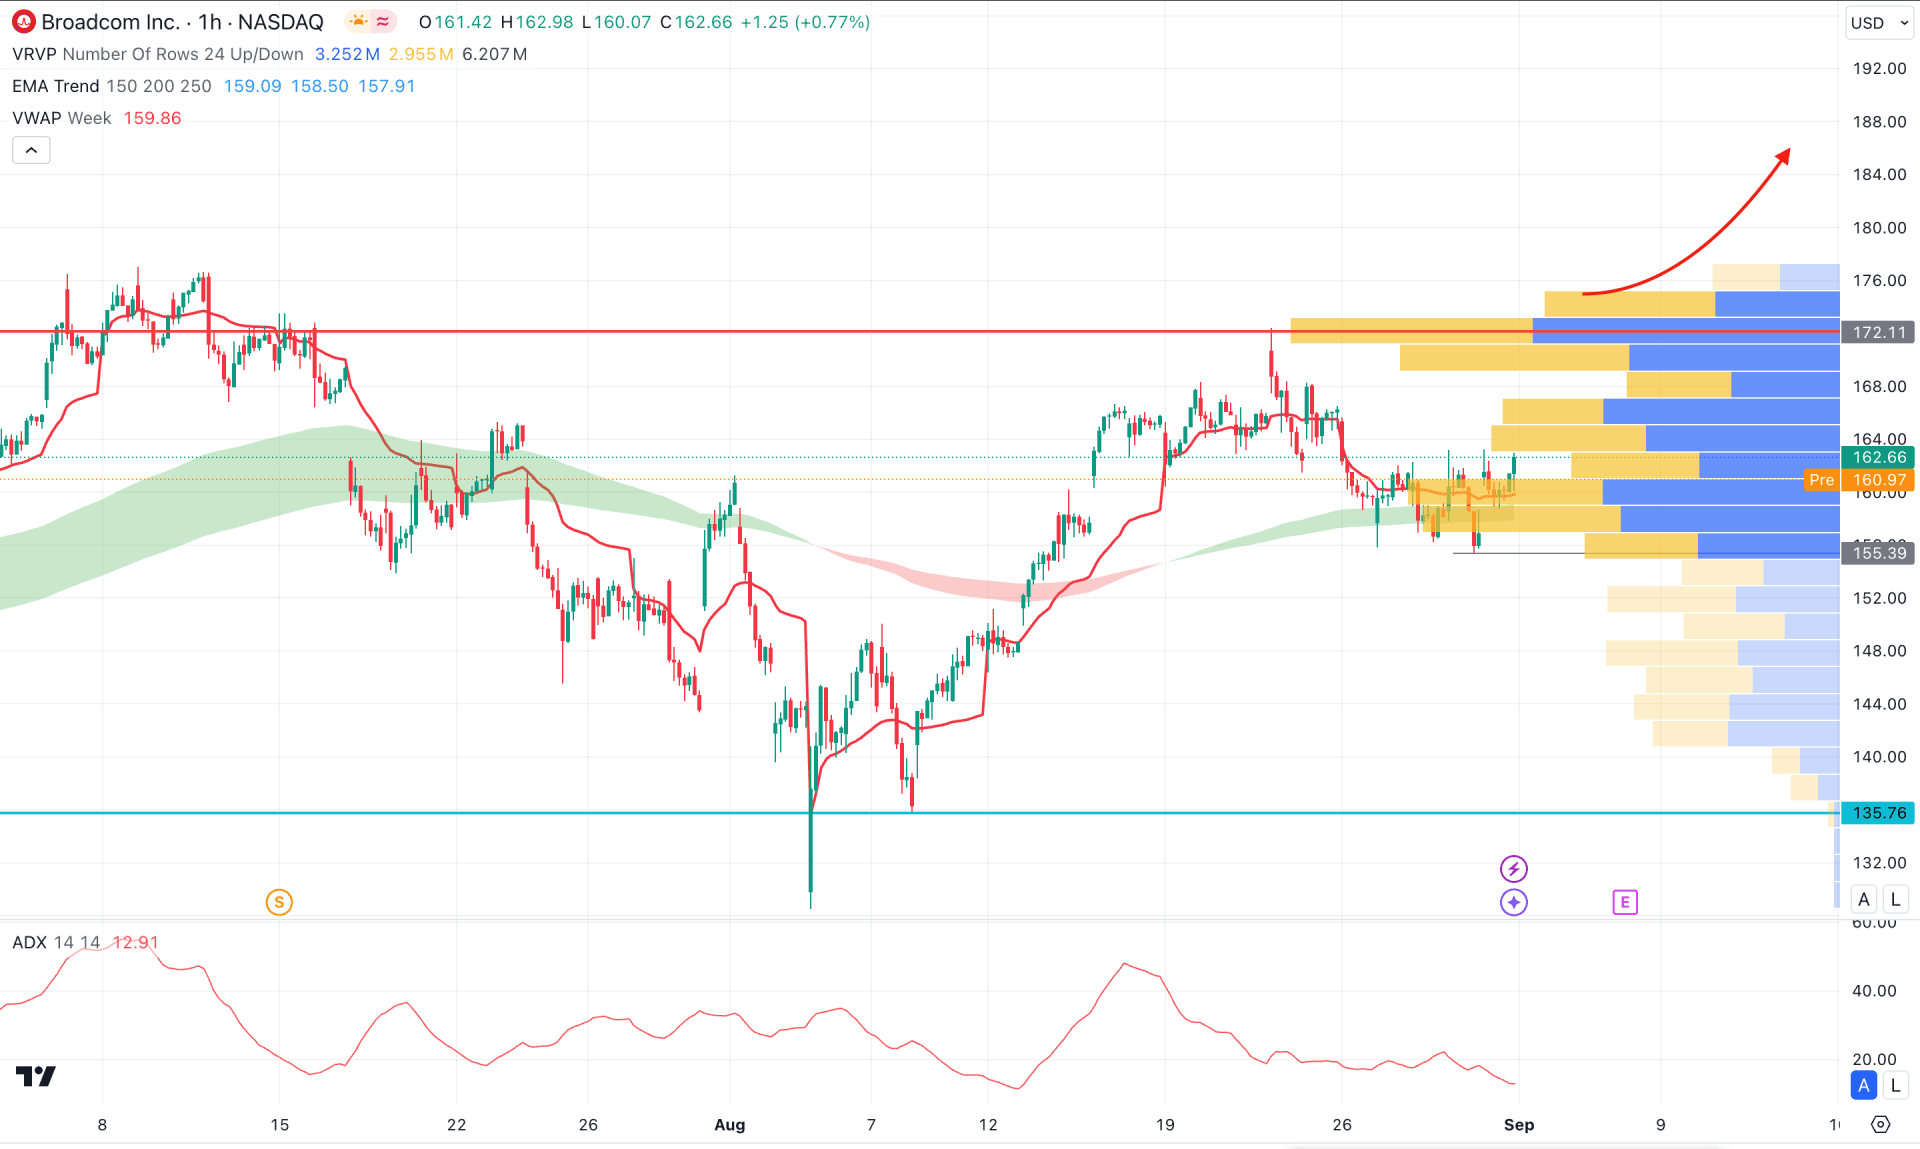
In the hourly time frame, the recent price trades below the visible range high volume line, suggesting a minor selling pressure. However, the dynamic weekly VWAP level is just below the current price, working as an immediate support.
In the secondary indicator window, the Average Directional Index (ADX) remains below the 20.00 line, suggesting a minor downside pressure. In that case, a valid bullish recovery above the 172.11 high volume line could validate the breakout possibility above the 200.00 psychological level.
On the bearish side, investors should closely monitor how the price trades below the 155.39 level, which might lower the price toward the 135.76 area.
Based on the current market outlook, AVGO is more likely to extend the upward pressure as a bullish trend continuation signal. Investors should closely monitor the hourly price action as a valid buy-side break could validate the long-term bullish trend.