
Published: June 19th, 2025
Due to increased geopolitical threats, futures for Brent Crude Oil surged over $77 a barrel, reaching a high of more than four months. Israel reportedly launched an airstrike on Iran's Arak heavy water reactor promptly on Thursday in response to Israeli President Isaac Herzog's declaration that Iran's nuclear program would be dismantled. Tensions are raised by reports that top US officials are getting ready for a potential attack on Iran in the next few days, indicating Washington's willingness to get involved in the war. The White House hasn't made it clear if the US would back strikes on Tehran's nuclear power plants, so there are still conflicting messages.
The Strait of Hormuz, which is a crucial conduit for a fifth of the world's petroleum, continues to be the biggest worry for the oil market. In a different move, the Fed held interest rates unchanged Wednesday but hinted at two probable reductions by year's end, which may encourage economic expansion and increase demand for oil.
The White House did not provide much insight into whether the United States will back strikes on Tehran's nuclear program as President Trump wrapped up a meeting with his most senior advisors on Wednesday.
Direct engagement would put the region's power supply in jeopardy and run the risk of intensifying the conflict.
As the battle entered its seventh day, prices managed to hold close to a five-month peak despite the fall.
The Federal Reserve, on the other hand, indicated two rate reductions by year-end while maintaining interest rates on Wednesday, which may promote growth and increase demand for oil.
Let's see the complete price outlook from the Brent Crude Oil multi-timeframe analysis:
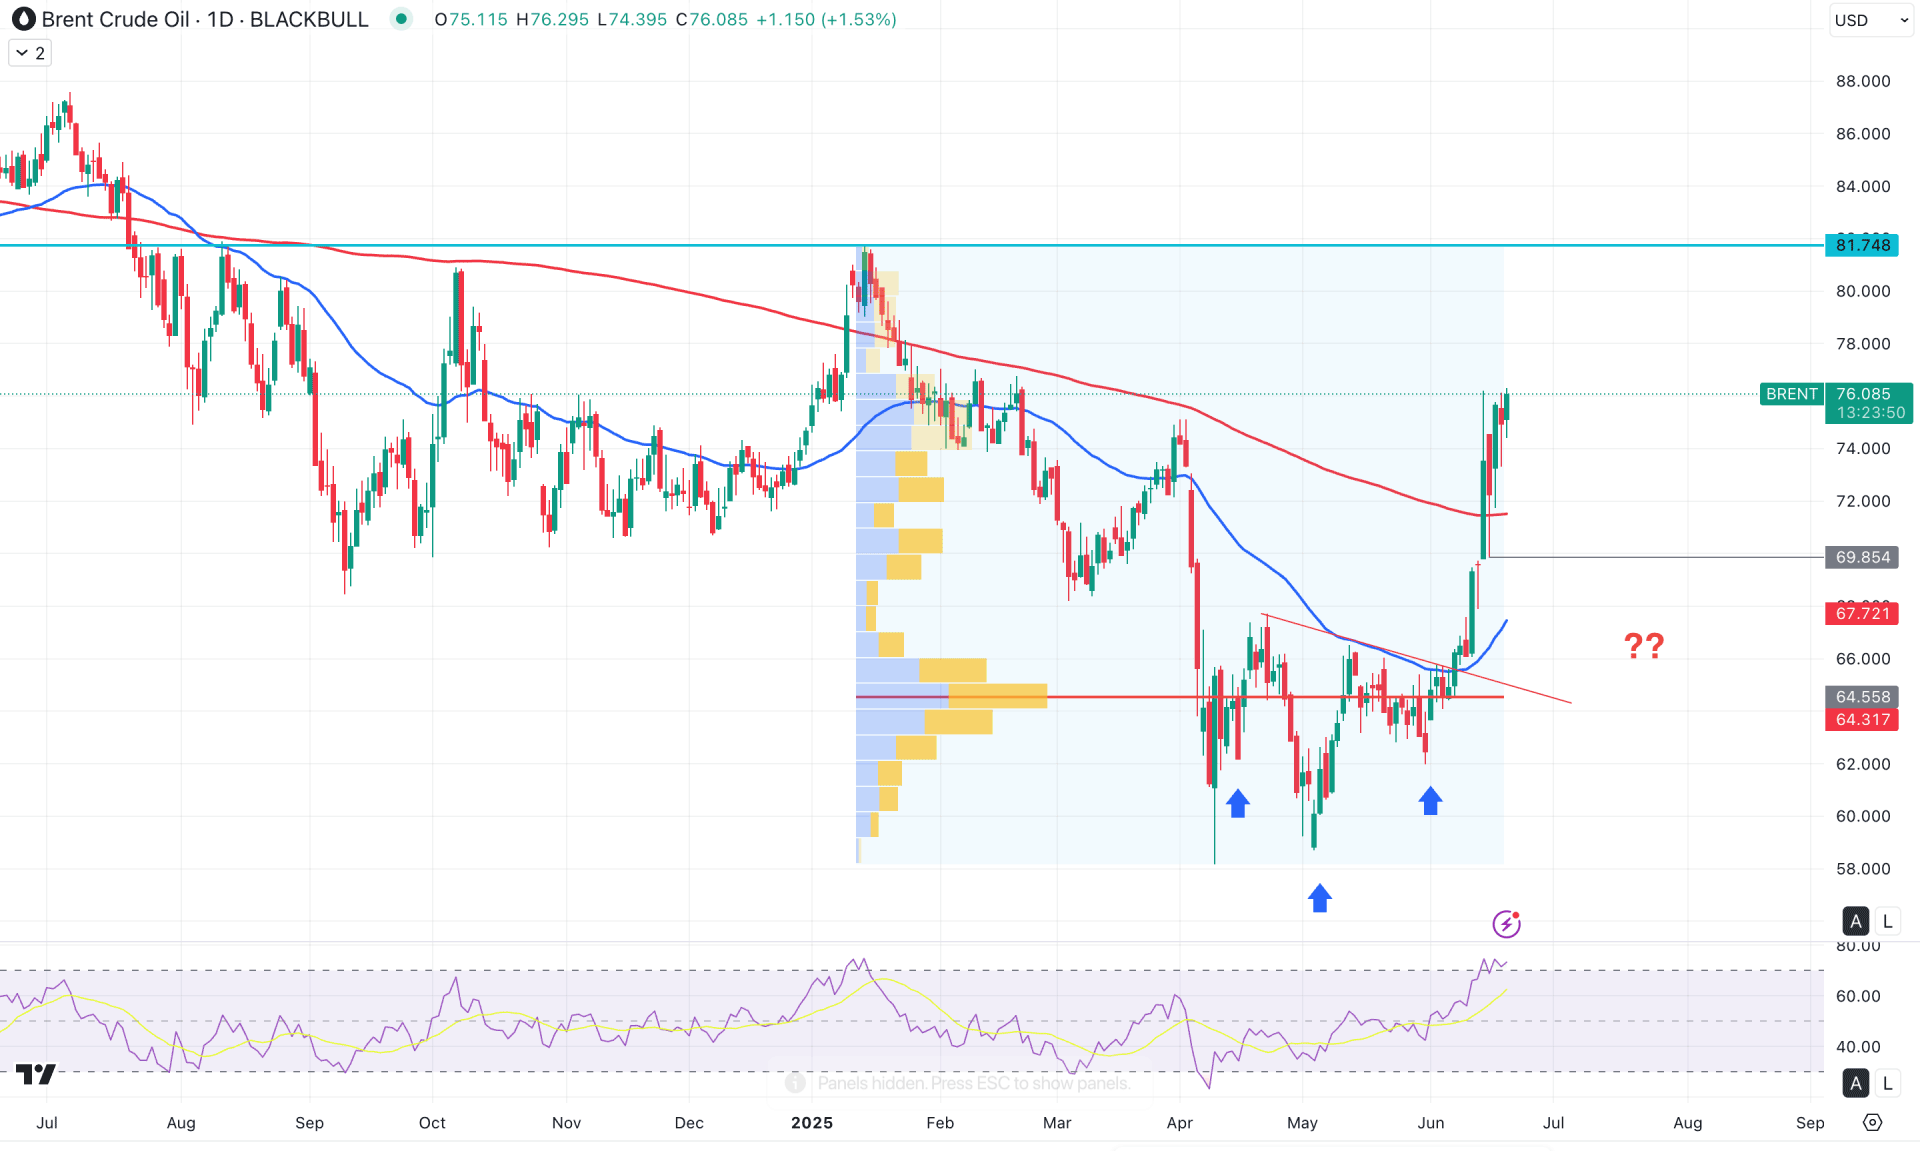
In the daily chart of Brent Crude Oil, the recent price showed a solid bullish recovery above the April 2024 high. In that case, investors should closely monitor how the price holds the buying pressure above the current monthly high. The uncertainty from the Middle East tension could be a crucial factor in forming further upward pressure in BRT.
In the higher timeframe, the current monthly candle is trading higher after having an indecision at the bottom. As the current price is hovering above the multi-month high, investors should monitor how the price reacts at the premium zone. On the other hand, the weekly price shows the same story as three consecutive bullish candles have formed. Although the price is trading at a crucial high, no significant selling pressure is visible at the top.
On the other hand, the most recent bullish breakout is supported by a valid range breakout, from which a bullish reversal is clear with a high-volume breakout. As long as the price hovers above the high-volume line, we may expect the buying pressure to extend in the coming days.
In the main price chart, a bullish breakout is visible above the 200 day Simple Moving Average, supported by the 50 day EMA. As a result, the Relative Strength Index (RSI) has reached the overbought area, signalling a possible top formation.
In other technical indicators, the Stochastic (77.43) and Williams %R (-15.38) represent an overbought condition. However, the ADX (36.63) and the ROC (2.331) represent a bullish condition.
Based on the current market outlook, the price is still trading in a bullish condition, where further upward pressure is possible. Primarily, further expansion of the Iran- Israel war could fuel the bullish momentum above the yearly high. The immediate resistance is at the 81.74 level, which could be the primary target of the bull run before anticipating the price above the 90.00 area.
On the other hand, a considerable downside correction is pending as the price has expanded the upside pressure from the 50-day EMA. In that case, an intraday downside pressure might appear towards the 720. To the 69.85 zone before expanding higher.
However, an extended selling pressure with a stable price below the 68.00 level might lower the price towards the 64.55 high-volume line.
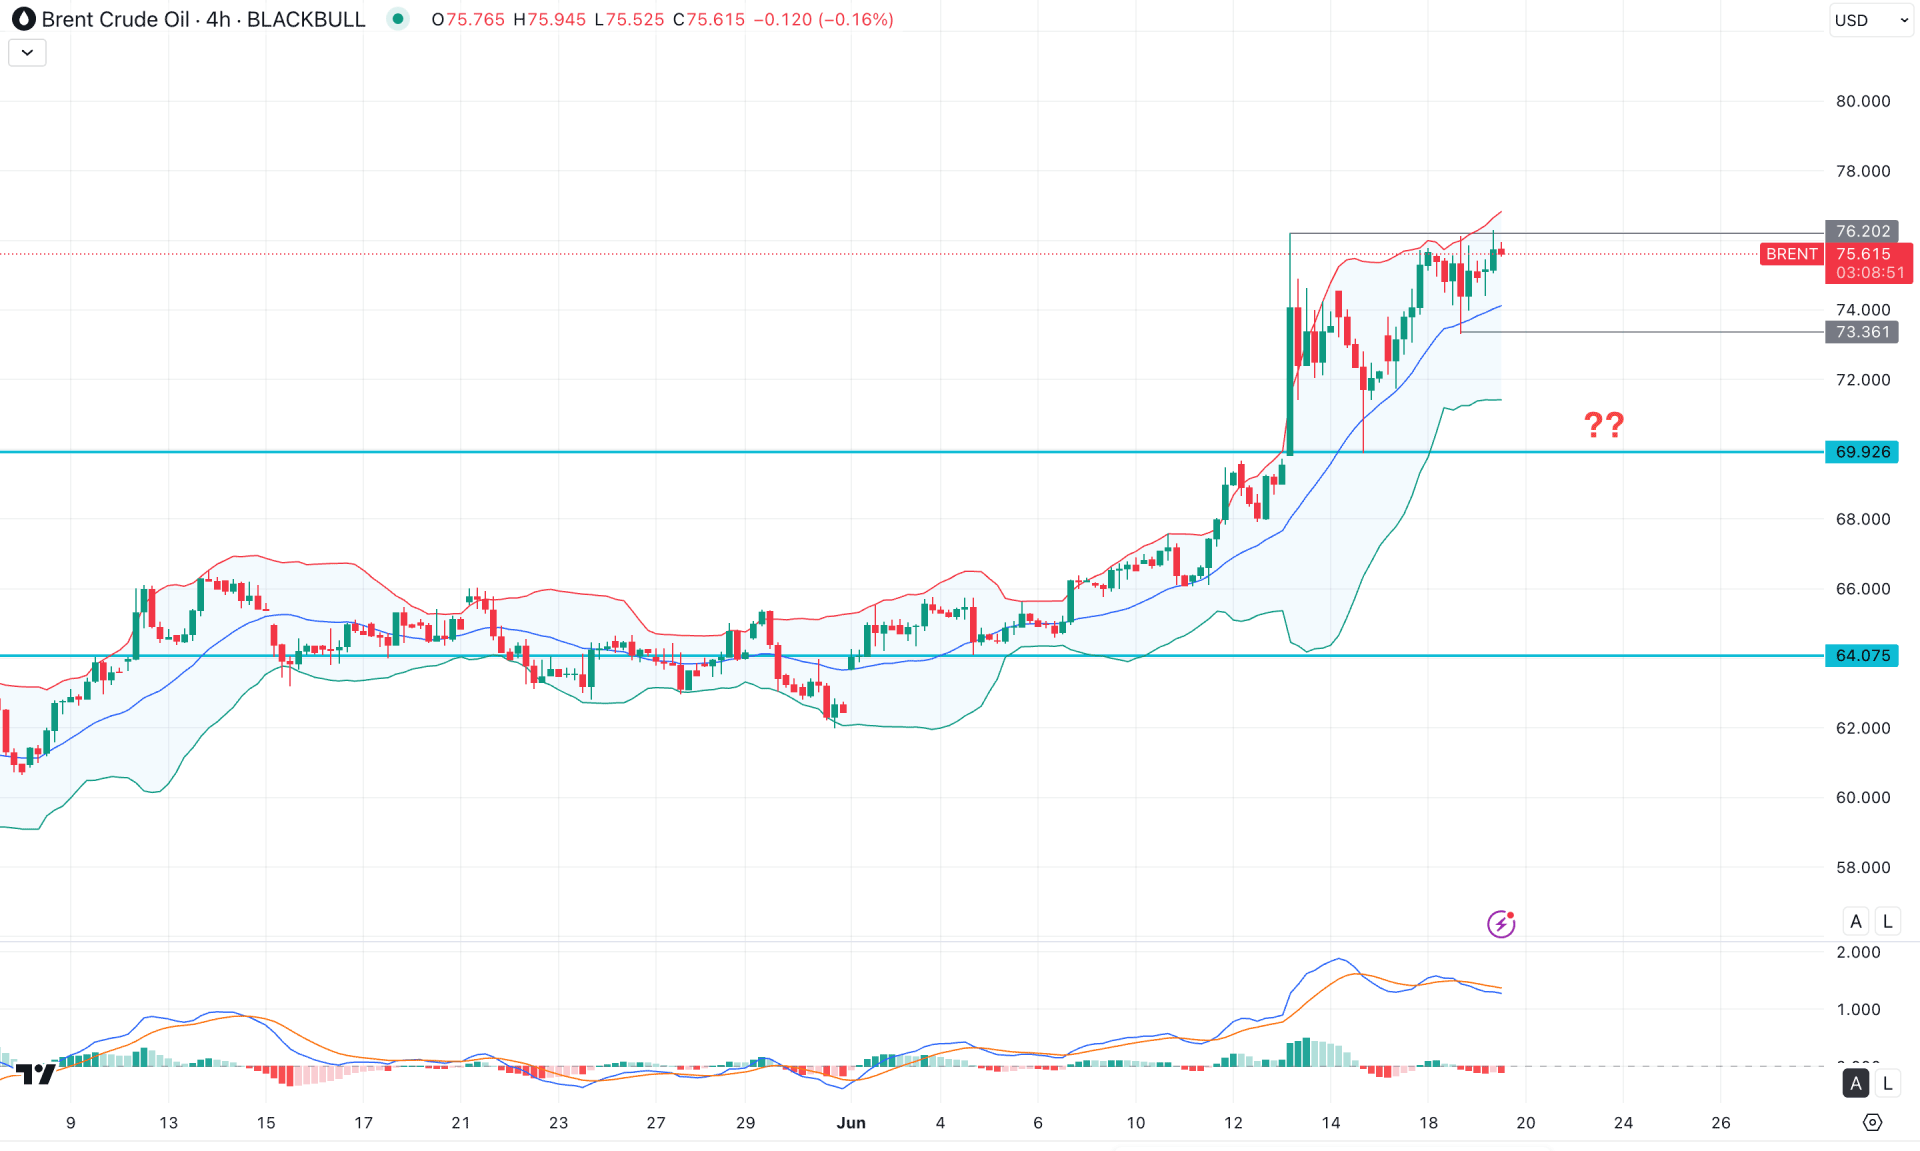
In the H4 timeframe, the ongoing market pressure is bullish, supported by the rising Bollinger Band. As a result, the most recent price has peaked at the Upper Bollinger Band. Signalling pressure to bulls.
In the secondary indicator window, the MACD Signal line has reached the peak as the most recent line has formed a bearish crossover at the top. Meanwhile, the Histogram has reached the negative zone, signalling an early short opportunity.
Based on the current H4 outlook, the recent price has peaked at the Upper Bollinger Band area, from where a considerable downside correction is pending. However, the major market trend remains bullish, and any H4 bullish reversal from the 73.00 to 69.20 zone could resume the existing trend.
On the other hand, an extended selling pressure below the mid Bollinger Band level with a consolidation could be an alarming sign to bulls. In that case, the downside pressure might extend towards the 68.00 level.
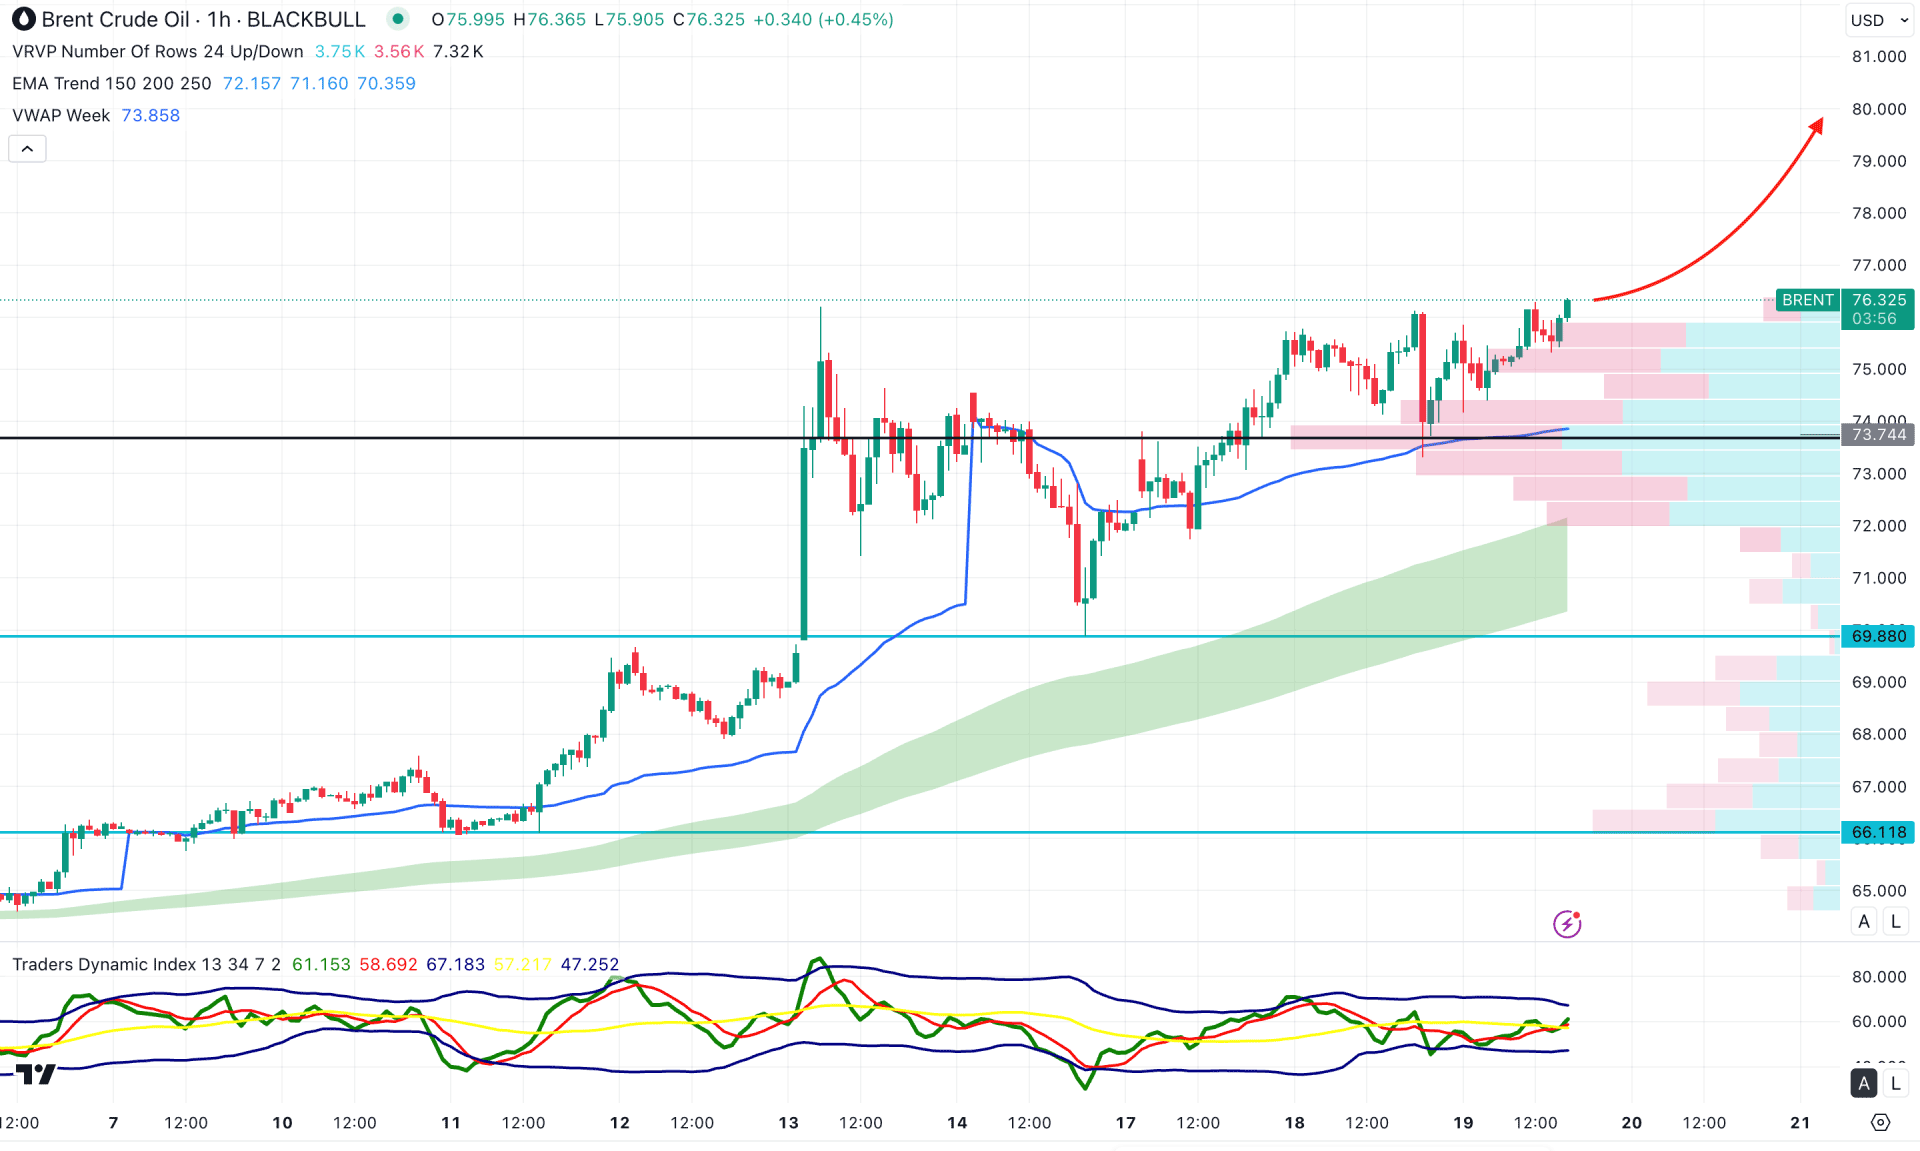
In the hourly timeframe, Brent Crude Oil is facing an intraday buying pressure as the price keeps moving higher with no sign of recovery. Primarily, the ongoing volatility from the war-driven sentiment could create more upward pressure as the intraday high volume level remains below the current price.
In the secondary indicator window, the Traders Dynamic Index (TDI) remains bullish as the most recent line shows a stable upward traction above the 50.00 neutral line.
In this context, the primary aim of this instrument would be to look for long trades as long as the price hovers above the 73.74 high volume line. However, an extended downside pressure with a consolidation below the weekly VWAP level might open a bearish opportunity, aiming for the 71.00 psychological level.
Based on the current market outlook, the ongoing buying pressure is supported by the long-term market trend, which might offer a decent bullish opportunity. However, the intraday price is already at the peak, from where any minor downside correction could signal a long opportunity from a more discounted price.


