
Published: May 27th, 2021
Boeing stock started delivering 737 Max jets as soon as the wiring issues are solved with plans to boost the output of the narrow-body in next year’s production.
Currently, the company plans to increase the production of 737 Max as many as 42 jets within fall 2022. Moreover, the company plans to increase the production rate as high as 31 jets per month in March 2022. The increase in travel demand in the US with an expansion of domestic and international routes.
Based on the last two years’ performance, Boeing incurred a significant loss in the previous six quarters. In the Q1 of 2021, earnings per share came at $1.53 from $1.70 a year ago, missing the estimation of $1.17 a share. Moreover, the revenue is down by 10% to $15.22 billion against the estimate of $14.4 billion.
Besides, the cash flow was increased to $4.7 billion from $3.7 billion with 76 net commercial orders in Q4 of 2020. The increase in order number’s with satisfactory revenue is a sign of an upcoming bullish pressure on Boeing Stock. Let’s see the forthcoming price direction from the Boeing Stock technical analysis:
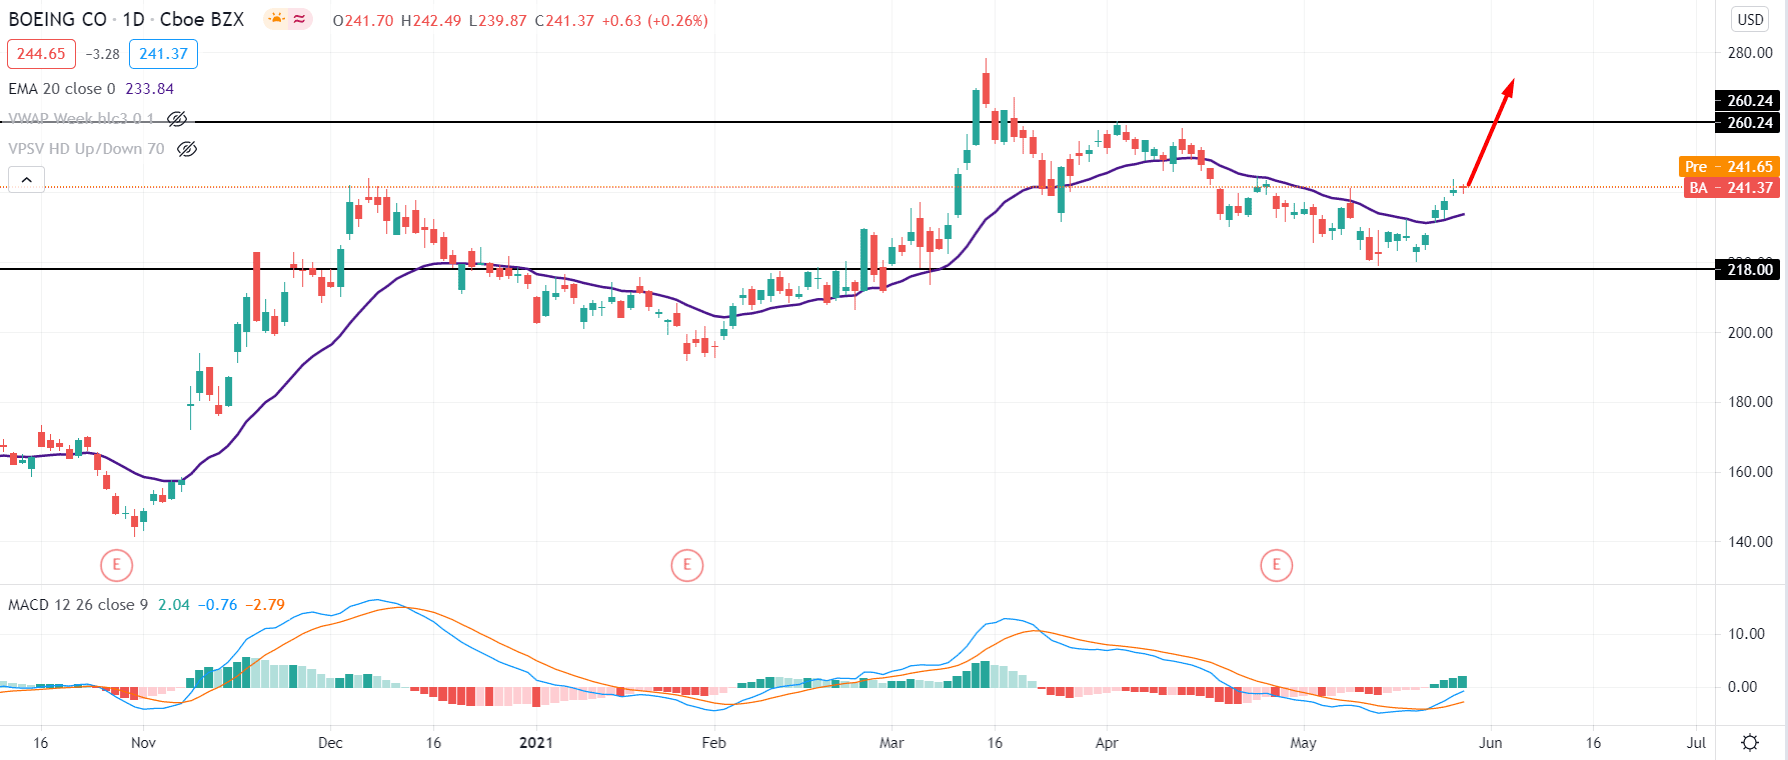
Boeing stock moves up within a bullish channel by creating higher highs from the 30 October 2020 low of 141.20. Later on, the price moved above the 218.00 event level with an impulsive bullish pressure that increased further bullish possibility.
The price made a new high above the 260.00 resistance level and corrected lower towards the 218.00 level as per the daily chart. During the correction, the price showed a corrective momentum after the impulsive solid bullish leg.
Later on, the price moved above the dynamic 20 EMA with a daily close, indicating short-term buyers’ strength in the price. Moreover, the MACD is bullish, and Histograms are showing new highs.
Therefore, as long as the price is trading above the dynamic 20 EMA on the daily chart, it has a higher possibility to take the price above the 260.00 resistance level.
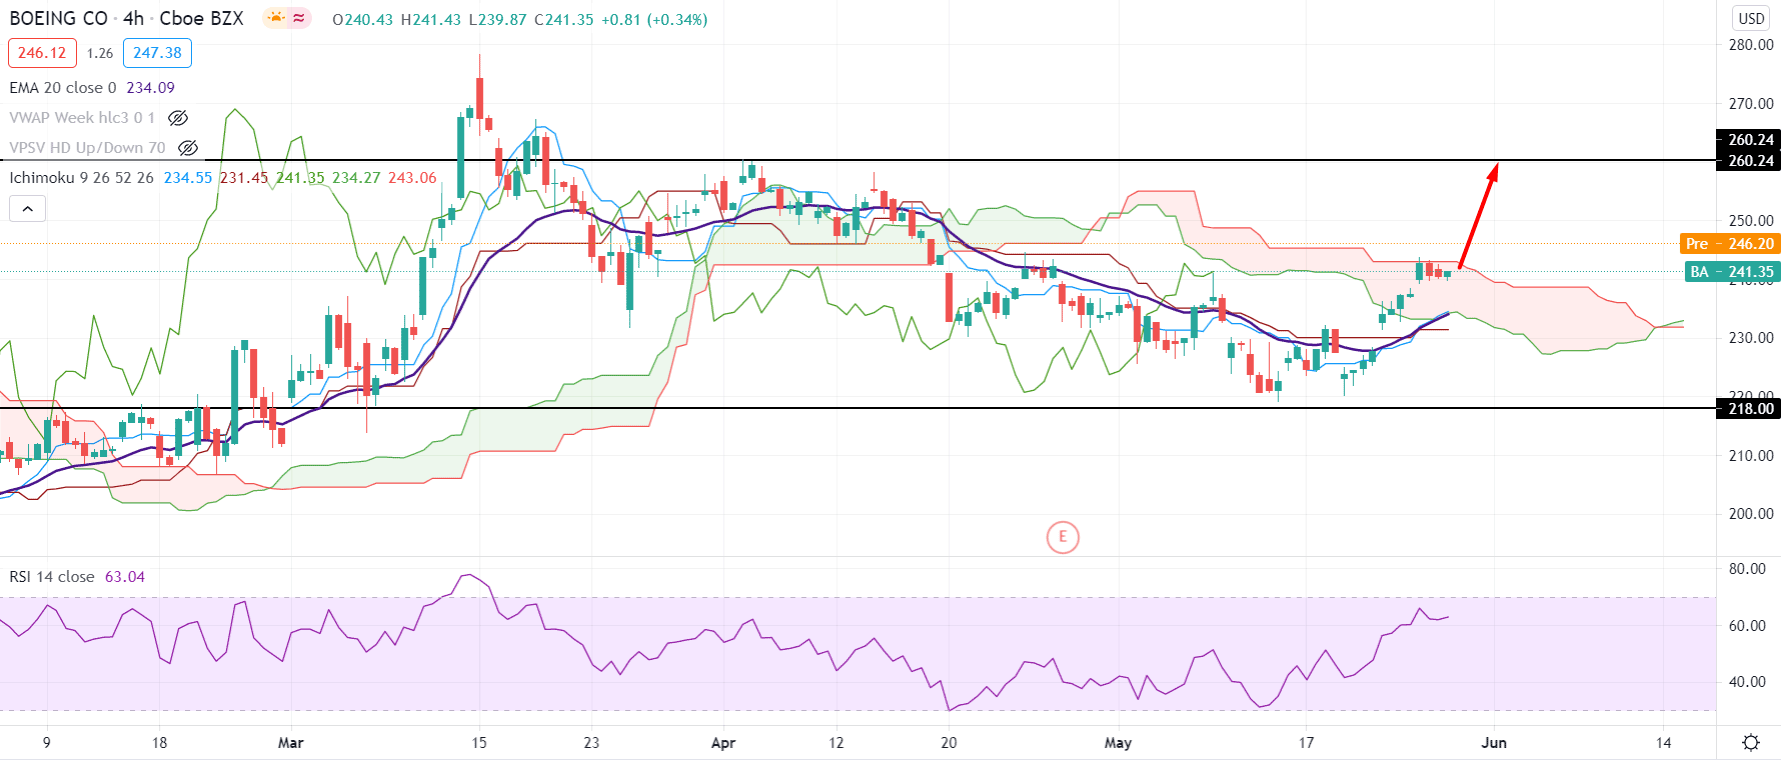
In the H4 timeframe, the price moved above dynamic Tenkan Sen and Kijun Sen and tested the cloud resistance level. Moreover, the Senkou Span A crossed over the Senkou Span B in the future cloud, indicating a shift in trend from bearish to bullish.
In the above image, we can see that the price crossed over the dynamic 20 EMA with a bullish pressure while Chikou Span moved above the price. However, the price is currently facing cloud resistance where any strong bullish breakout above the 243.15 resistance with an H4 close may initiate a bullish rally with the target of 260.00 level.
Conversely, extreme volatility at the cloud resistance and a bearish H4 close below the dynamic Tenkan Sen may alter the current market structure that may take the price lower towards the 218.00 level.
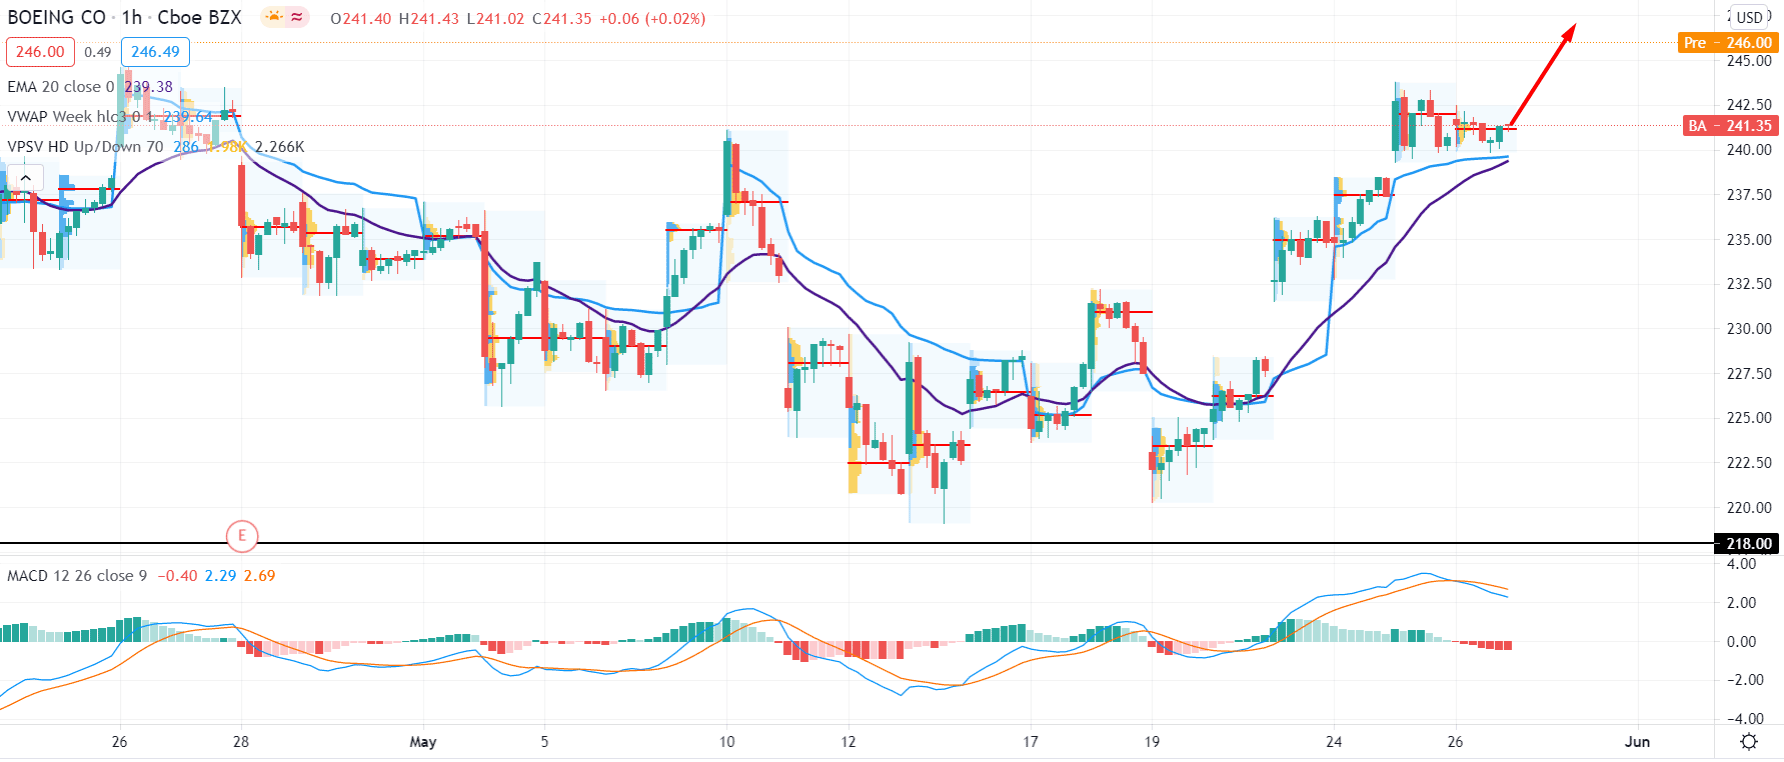
Boeing stock moved above the dynamic 20 EMA and weekly vwap level with an impulsive pressure in the intraday chart. Moreover, the dynamic vwap level is currently providing support to the price, indicating an upcoming bullish possibility.
In the above image, we can see the H1 chart of the Boeing Stock where the price is trading at the intraday high volume level at 241.12. The MACD Histogram is still bearish but moving higher to zero levels with no sign of divergence.
Therefore, as long as the price supported by dynamic vwap level and strong bullish H1 close above the most recent swing high of 243.78 may initiate a strong bullish leg upside.
Conversely, any strong H1 close below the dynamic 20 EMA may make the price volatile. In that case, traders should for bearish confirmation from H4.
As of the above discussion, we can say that Boeing stock has a higher possibility to continue the bullish pressure as long as the price is trading above the dynamic 20 EMA on the daily chart. The primary target of the bullish is above 260.00 level and a bullish daily close above 260.00 level may take the price higher above 300.00 level.
On the other hand, traders should closely monitor the H4 chart where any strong bearish H4 close below the dynamic Kijun Sen may increase the voaltility to the price.


