
Published: July 8th, 2021
Boeing released negative earnings reports in the last six quarters where the pre-share loss has come at $1.53, down from $1.7 a year ago.
Besides the weaker earnings releases, the cash flow was up by $3.7 billion from $4.7 billion in the latest quarter. However, the earnings per share have grown by 0% in the last three years with a revenue contraction of 19%.
Due to the COVID-19 pandemic, Boeing faced a travel ban that affected the company by suspending dividends in March 2020 to extend the share repurchase program. According to Boeing’s CEO, the company’s current plan is to bring the dividend-paying back to add a positive cash flow. Moreover, the company is struggling with high gearing and focusing on reducing loans by considering share sales.
Investors should find a positive business activity and revenue growth in this market context to consider this stock as a buy.
Let’s see the future price direction from the Boeing Stock [BA] technical analysis:
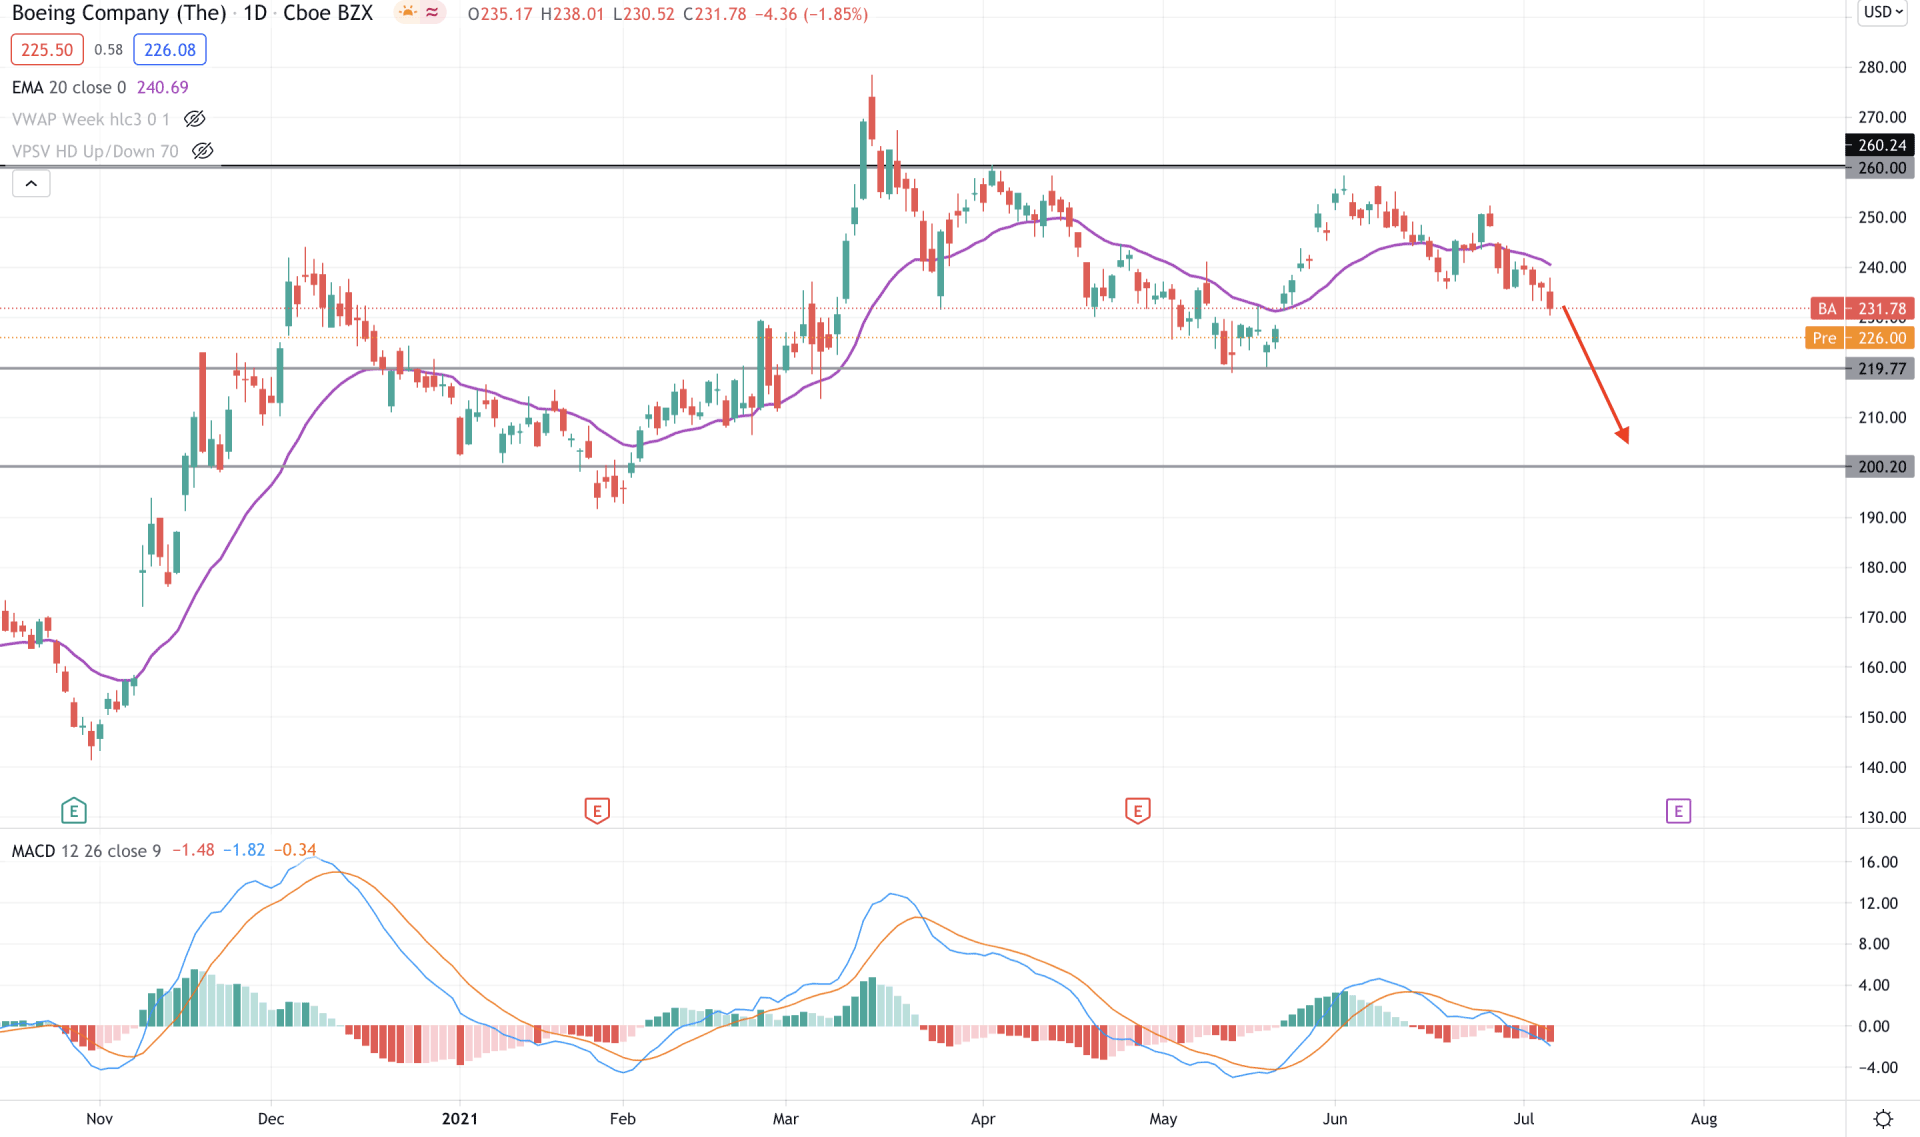
Boeing Stock hit the multi-year high at 278.55 on 15 may 2021 but failed to hold the momentum. As a result, the price moved down with a corrective speed by creating a potential double top pattern at 260.00 area. As the current price is moving down from the 260.00 level, it has a higher possibility of continuing the bearish pressure in the coming days.
In the above image, we can see the daily chart of Boeing Stock, where the most recent price failed to hold the bullish momentum above the 260.00 resistance level. As a result, the price moved down below and currently trading below the dynamic 20 EMA.
In the indicator window, MACD Histogram shows an NPN (negative-positive-negative) formation, which is a sign that buyers tried to take the price higher but failed to hold the momentum. Moreover, MACD Signal lines are above the Histogram and moving down, pointing out an upcoming selling pressure in the price.
In this price context, the overall outlook is bearish as long as the price is trading below the dynamic 20 EMA. In that case, the price has a higher possibility of testing the 219.77 support level in the coming days. However, a stable bullish daily close above the dynamic 20 EMA will indicate short-term buyers’ presence in the chart.
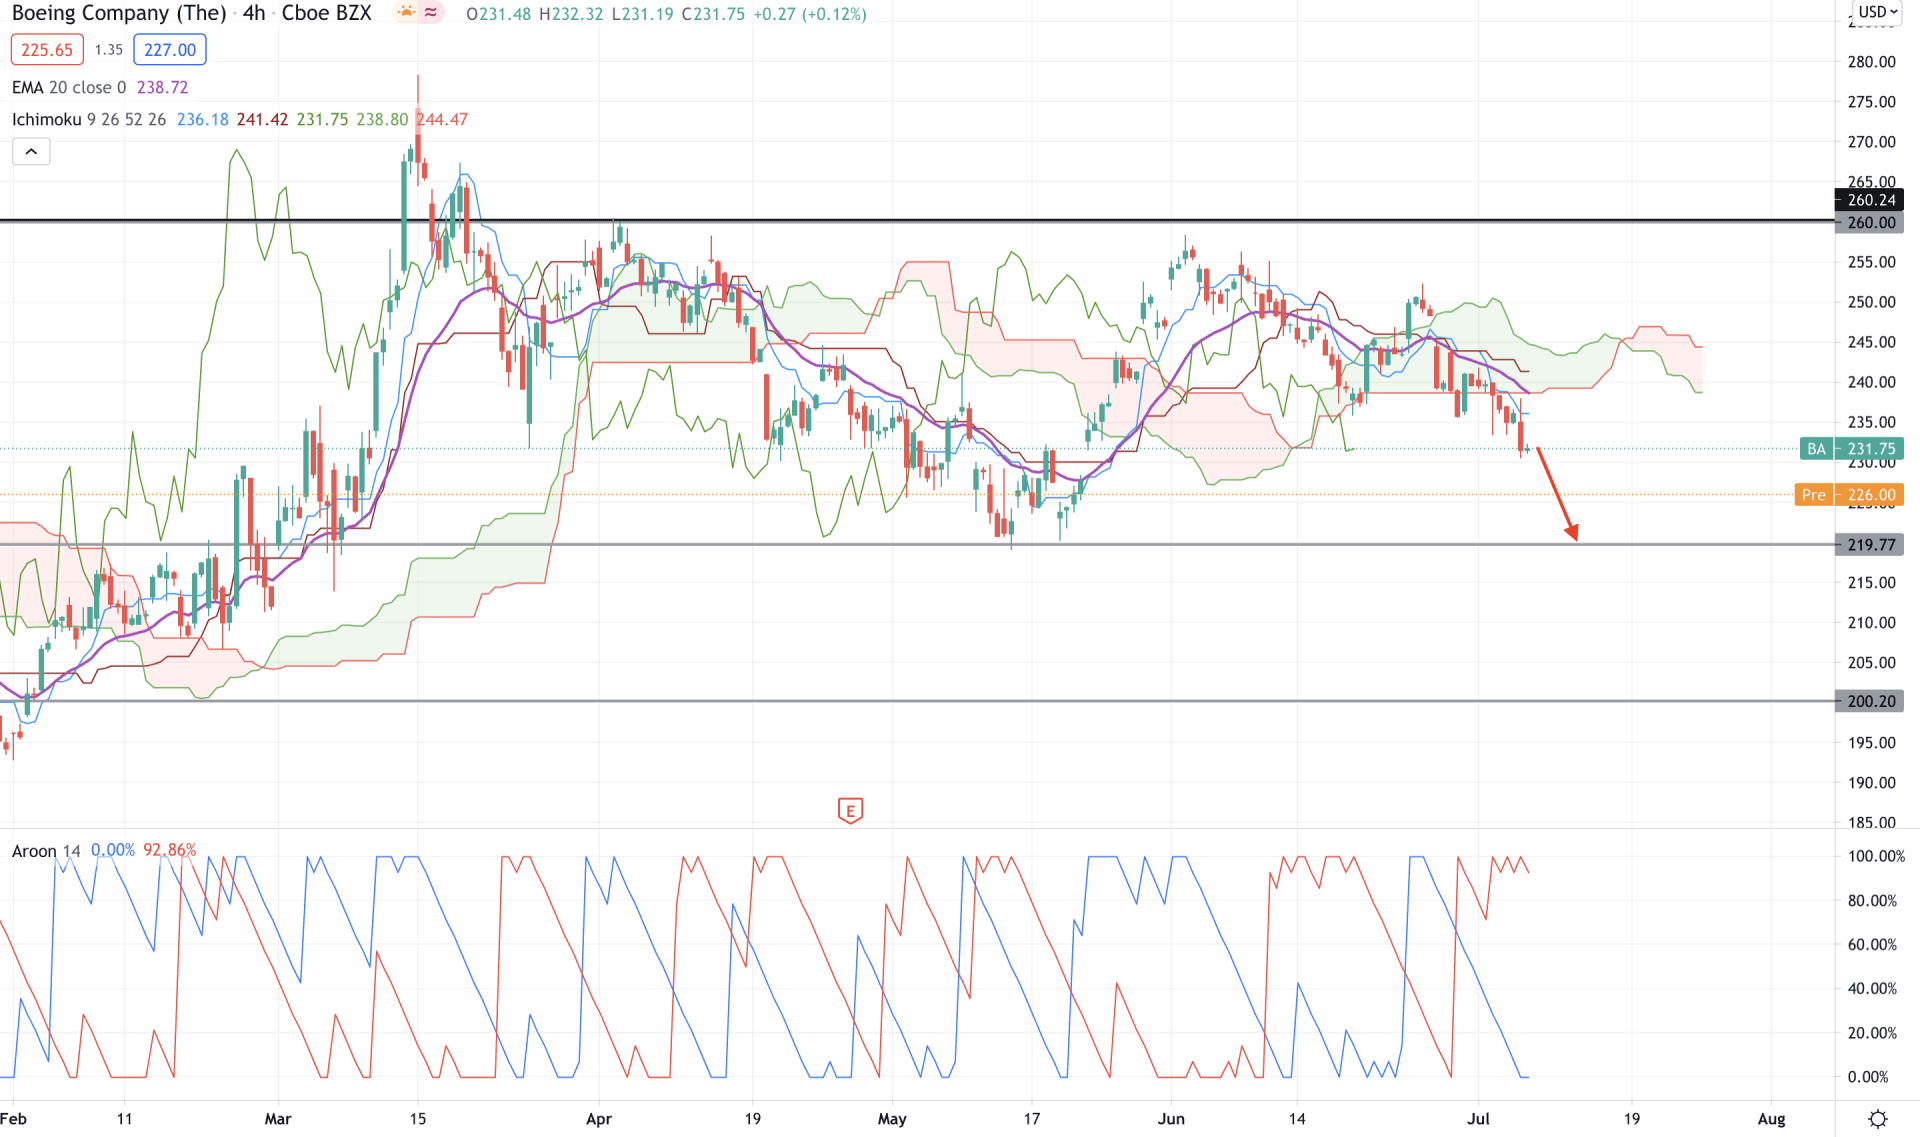
Based on the Ichimoku Kinko Hyo, the price is below the Cloud Support while Senkou Span A is below the Senkou Span B in the future cloud. Moreover, dynamic Tenkan Sen and Kijun Sen are above the price while Chikou Span is below Kumo Cloud. Therefore, according to Ichimoku elements, the price has a higher possibility of moving down below the 219.77 support level.
In the indicator window, we can see the Aroon Down (red line) crossed over the Aroon Up (blue line) and hovering at 100% area, which is a sign of a strong bearish trend. Therefore, as long as the price is trading below the dynamic Kijun Sen, it may come down towards 219.77 and even 200.00 in the coming sessions.
Conversely, a solid H4 close above the Cloud Resistance of 246.78 level may alter the current market structure and take the price higher towards the 280.00 level.
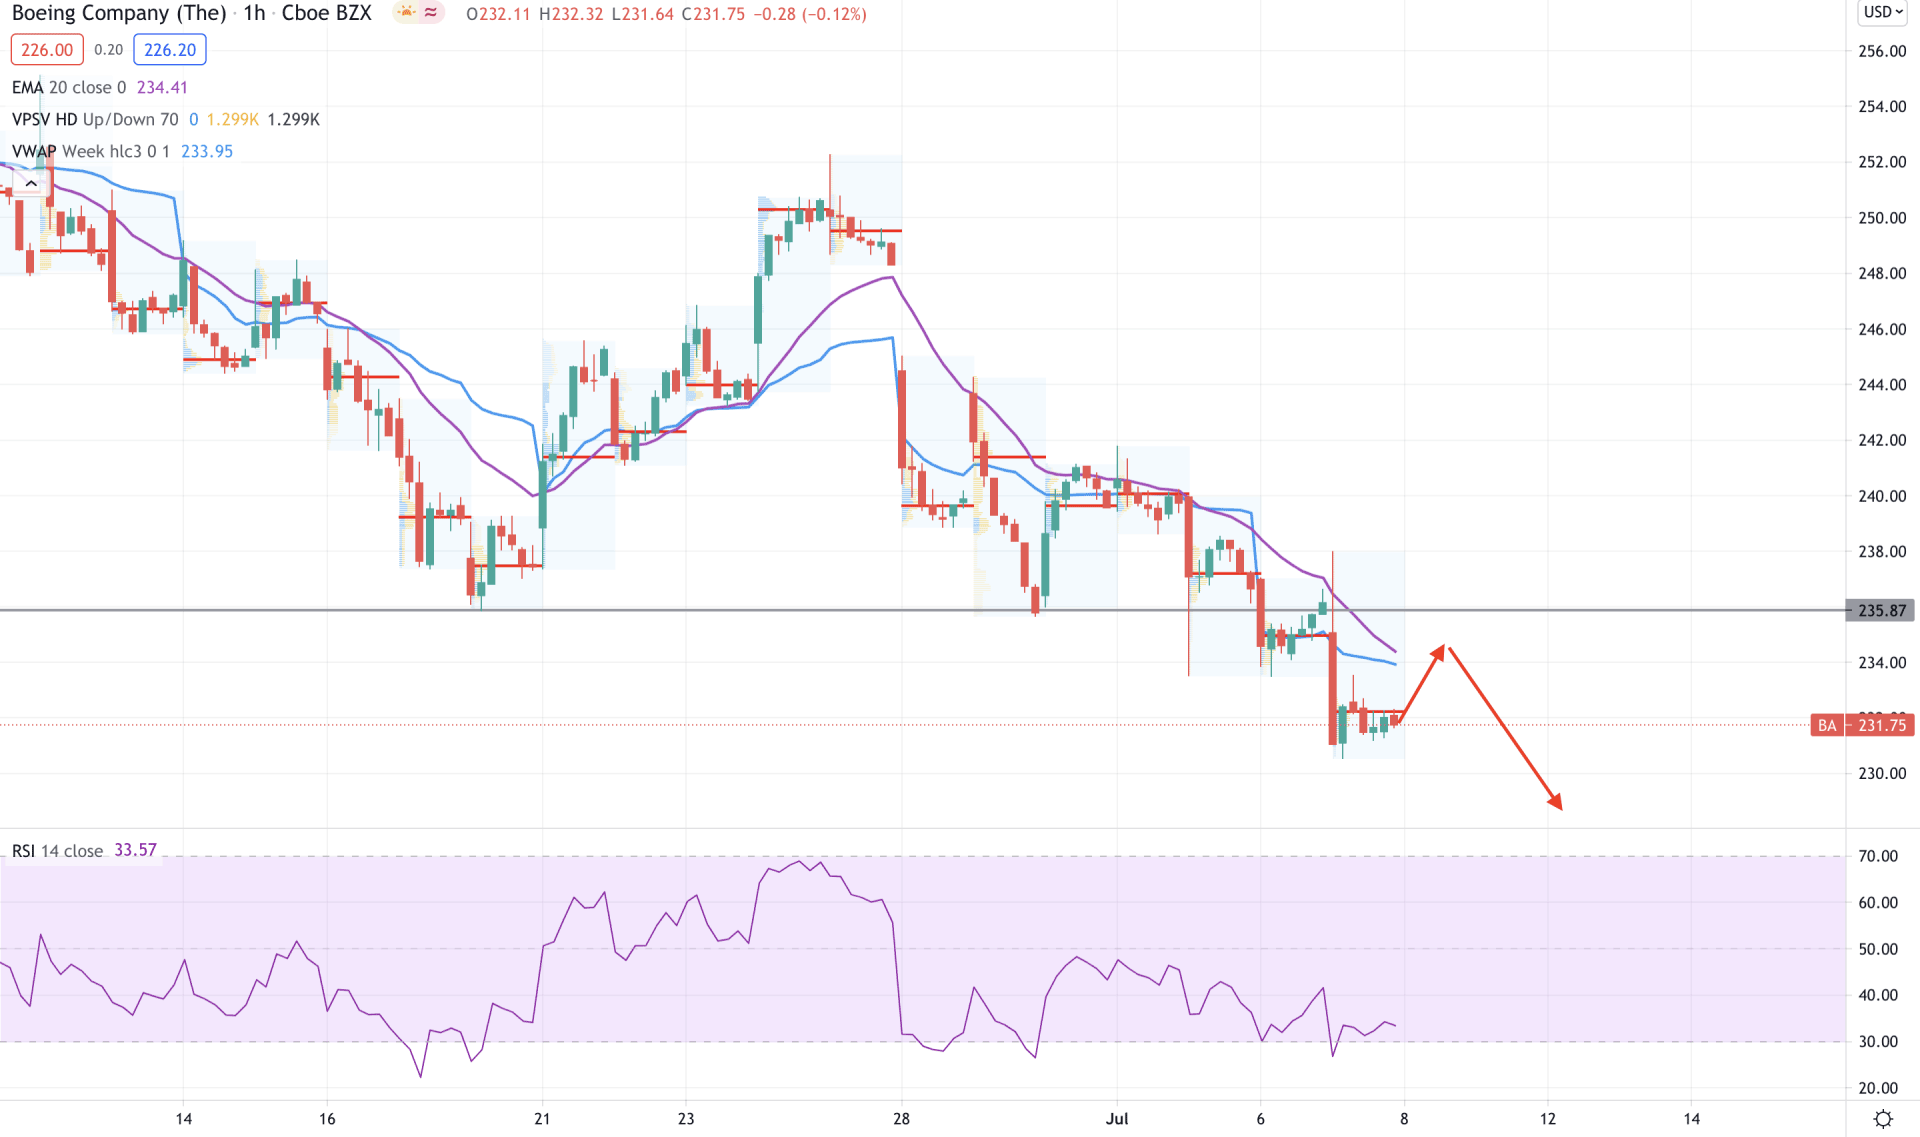
Boeing stock is moving down with an impulsive bearish pressure in the intraday price chart that took the price lower below the 235.87 event level with a bearish H1 close. Moreover, the consecutive low of intraday high volume levels shows that sellers are active in the price and ready to take the price lower.
In the above image, we can see the H1 chart of Boeing Stock where the price rejected the 235.87 level with a bearish H1 close and remaining at the most recent high volume level at 232.26 level. Moreover, RSI is still at the 30 levels, indicating selling pressure in the price.
Based on the intraday price chat, Boeing stock has a higher possibility of breaking below the near-term low of 230.55 level as long as the price is below the 235.87 level.
As of the above discussion, Boeing Stock may move lower towards 219.77 and even 200.00 level as long as the price is trading below the Kumo Cloud level at 240.00.
However, any strong bullish H4 close above the Cloud Resistance of 246.78 level may alter the current market structure and take the price higher towards the 280.00 level.


