
Published: September 6th, 2023
Boeing (NYSE: BA) and Aviation Capital Group LLC (ACG) have announced the completion of an order for 13 737 MAX aircraft by the aircraft lessor. This order increases the total number of 737 MAX aircraft for ACG to 47.
The 737 MAX family gives airlines enhanced efficiency and greater route flexibility for short- and medium-haul air travel, making it an extremely valuable asset for aircraft lessors like ACG. In fact, more than 1,300 737 MAX aircraft have already been ordered by lessors.
Depending on the configuration, the 737-8 can accommodate up to 210 passengers and has a range of 3,500 nautical miles. The 737-10, the most prominent member of the 737 MAX family, can accommodate up to 230 passengers and has a range of 3,100 nautical miles.
The Boeing stock could react to the news, while the broader market outlook for this instrument is on the buyers’ side. Boeing stock is trading 42% higher during the last 52 weeks, compared to the 12.99% increase in the S&P 500 index.
Boeing stock would be a great option if you are looking for a decent investment opportunity. However, investing in the financial market needs close attention to the price outlook from a technical perspective.
Let’s see the upcoming price direction of this stock from the Boeing Stock (BA) technical analysis:
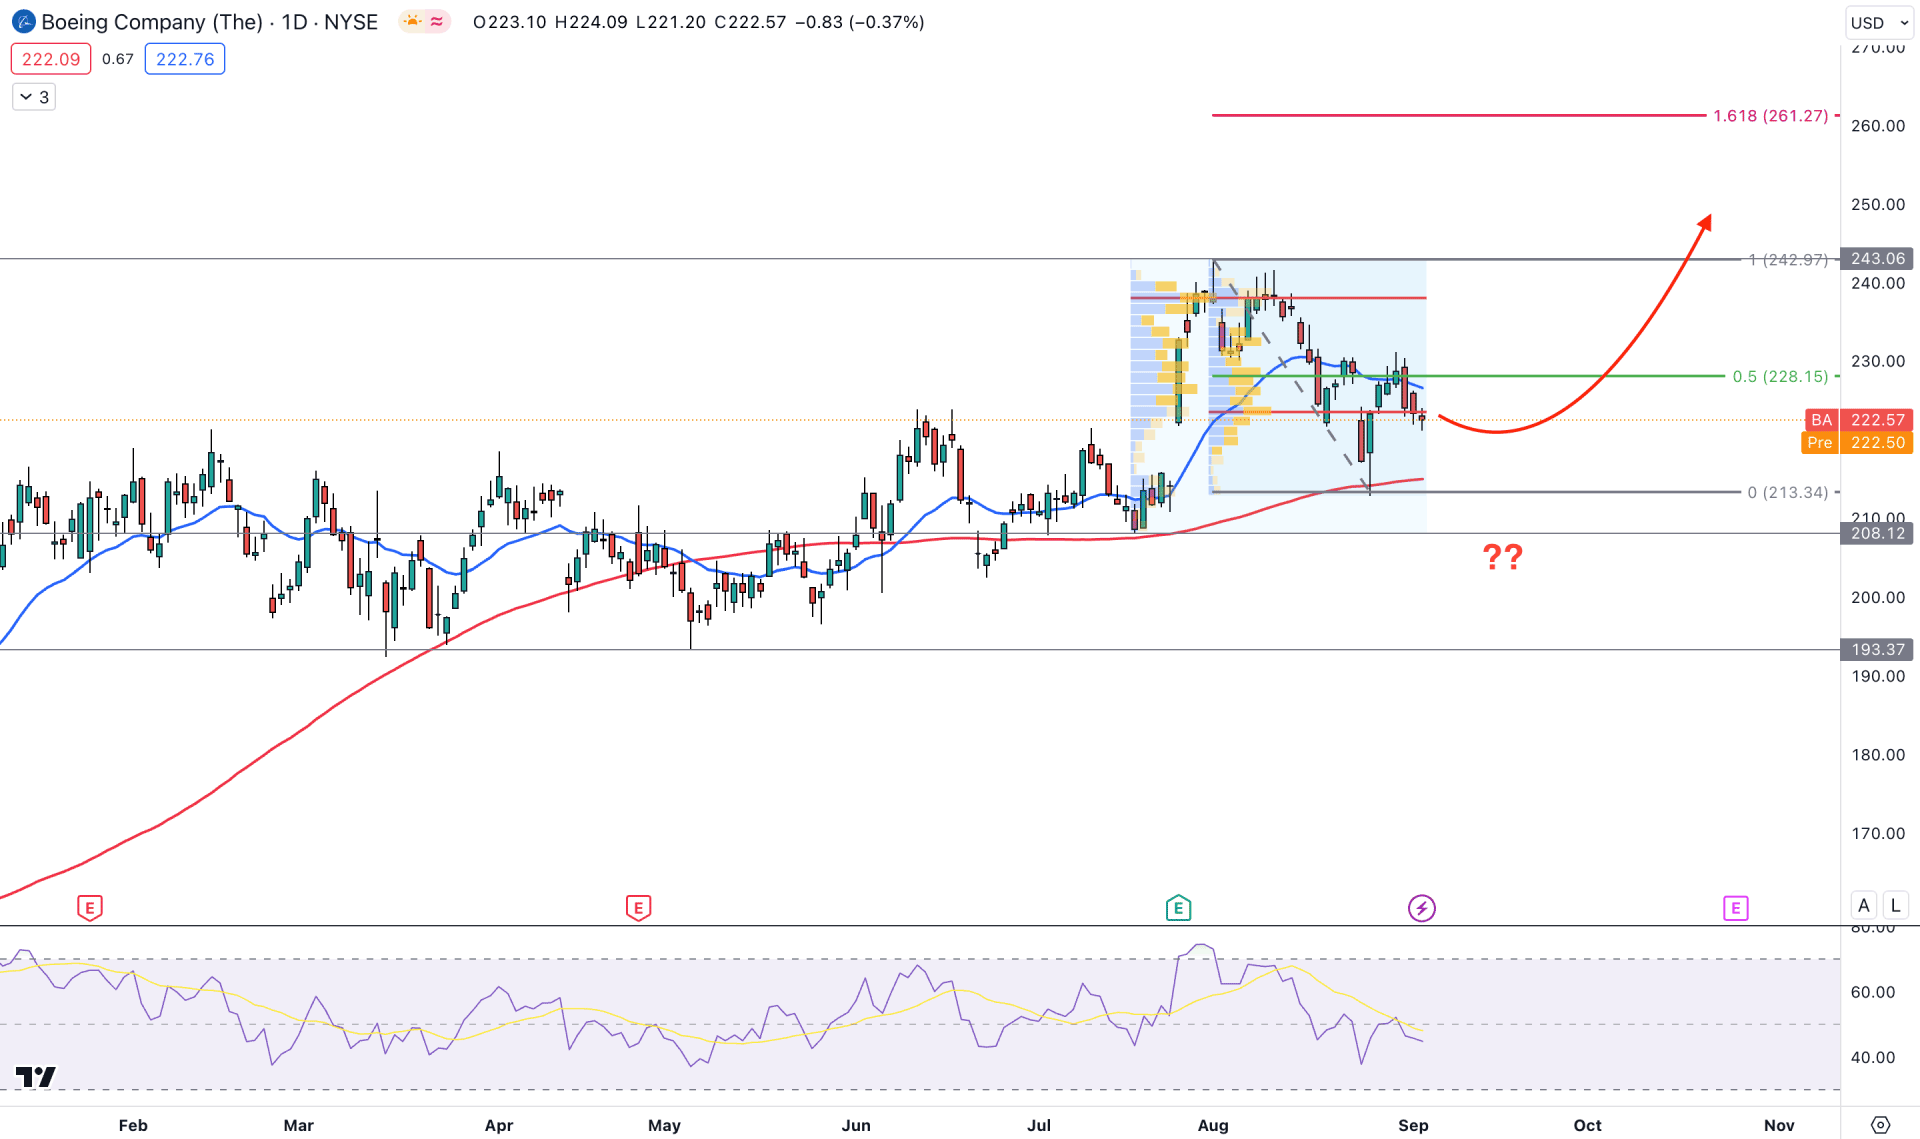
In the daily price of BA, the overall market trend is bullish as the price is trending up by making consecutive higher highs. In this situation, the best trading approach is to look for long trades after completing a reliable downside correction.
In the higher timeframe, the current price is trading sideways after making a new yearly high, while bulls support the current monthly candle by forming an inside bar. Based on the monthly candlestick, the bullish possibility is valid as long as the price trades above the 207.89 swing low. The weekly price also supports bulls, as it is trading sideways, within a strong bullish trend.
A corrective momentum is visible in the volume structure, where the current price is trading below the largest volume level since 17 July 2023. Also, another high volume level from the August high is just above the current price, which needs to be recovered before offering a buying opportunity.
In the near-term price action, the 100-day SMA is working as a major barrier to sellers, as a strong bullish daily candle appeared from this level a week ago. However, the price is trading below the 20-day Exponential Moving Average with a corrective momentum, which needs a bullish recovery before extending the bullish trend.
In the secondary indicator window, the current RSI is below the 50.00 level, which suggests a seller's presence in the market. Meanwhile, the price is trading at the discounted zone from 243.06 high to 232.34 low, from where a new bullish swing could form.
Based on the current market analysis, a bullish daily candle above the 20-day EMA could signal a strong buyer's presence in the market, increasing the price toward the 240.00 level. However, a deeper correction towards the 100-day SMA is possible, but a bearish D1 candle below the 207.00 level could lower the price towards the 140.00 level.
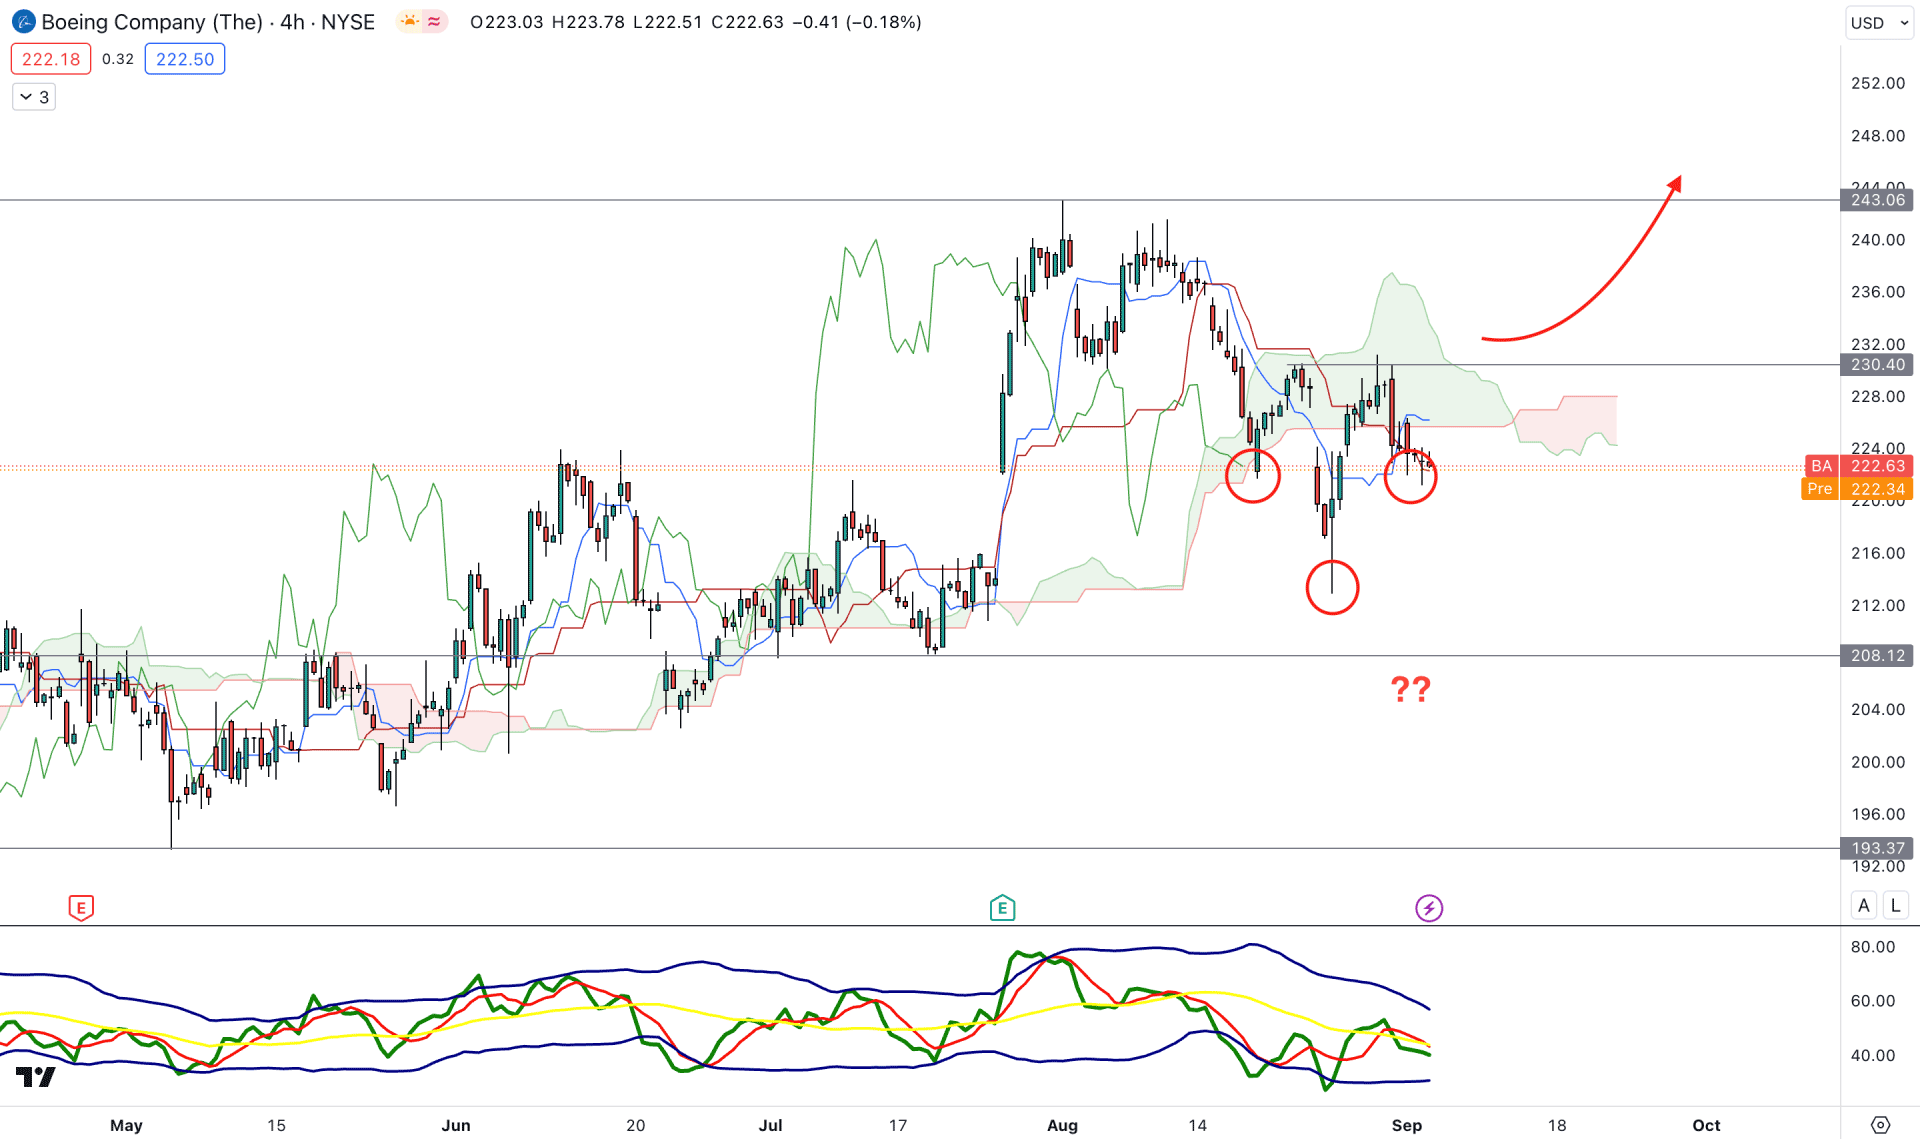
In the H4 chart, the current price is trading below the Ichimoku Kumo Cloud, while a bullish possibility is potent from the Inverse Head and Shoulders formation. However, the neckline breakout is pending, which needs a valid daily candle close above the 231.00 level.
In the future cloud, the current sentiment is bearish as the Senkou Span A is moving down below the Senkou Span B. The indicator window shows the same sentiment as the TDI is below the 50.00 neutral line.
Based on the h4 structure, we may consider the buying possibility valid after having a solid break above the 231.00 level. In that case, the upside possibility might extend toward the 252.00 key resistance level.
On the other hand, the downside possibility is valid in the current context, and a bearish H4 candle from the dynamic Kijun Sen level could lower the price in the coming days.
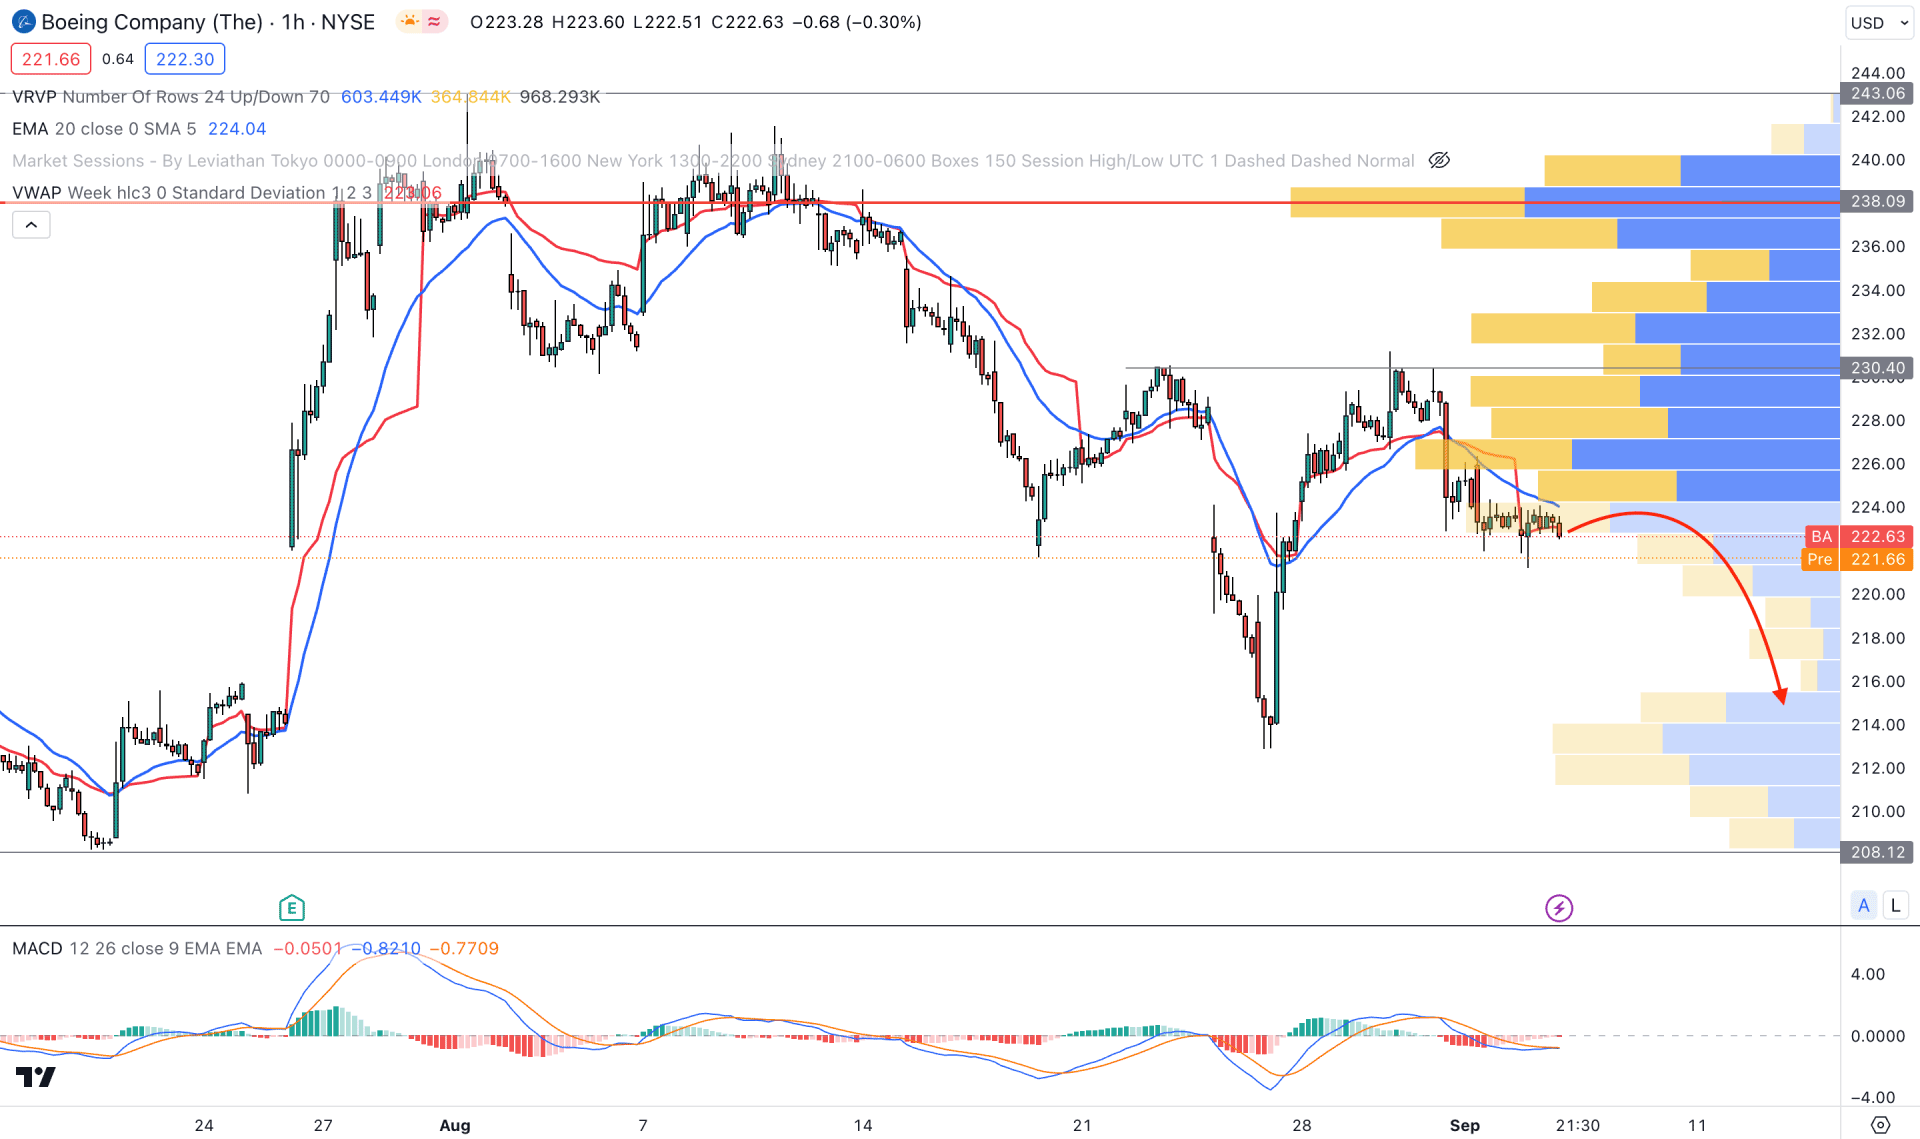
In the hourly time frame, the overall market trend is bearish as the visible range high volume level remains above the price at the 238.00 level. Moreover, the price made several lower lows, and the most recent price is facing strong resistance from the dynamic weekly VWAP level.
In the indicator window, the current MACD Histogram is at a neutral level, while MACD lines are sideways at the bearish zone. Based on this structure, an additional bearish rejection from the dynamic 20 EMA level could lower the price in the coming days.
On the bullish side, a strong recovery is needed, and an H1 close above the 230.00 level could work as a confluence support to the H4 breakout.
Based on the current multi-timeframe analysis, Boeing stock has a higher possibility of a bullish trend continuation. However, the early sign of the buying pressure might come from the intraday price action, which is still bearish. The ideal bullish approach is to find a strong upside reversal in the h4 chart before opening any position.


