
Published: June 14th, 2023
Boeing, the world's largest aerospace company, faces several operational headwinds and lawsuits. These challenges hurt the company's financial performance and could hurt its stock price.
One of Boeing's biggest challenges is the ongoing production delays of its 787 Dreamliner aircraft. The company has had to suspend deliveries of the Dreamliner several times due to manufacturing defects. The latest delay, announced this week, is due to a problem with a fitting on the horizontal stabilizer.
Since June 2020, British Airways (BA) has witnessed a decline in its net income. Initially standing at a negative $2.85 billion, the net income experienced various fluctuations. However, for the quarter ending in March 2023, BA incurred a net loss of $425 million.
The BA's revenue shows a mixed trend over the given period. From its initial reported value of $66.6 billion in June 2020, the revenue experienced a growth rate of 4.8% and reached a final reported value of $70.5 billion in March 2023. The revenue peaked in March 2023, while its lowest point was recorded in December 2020.
Investors considering buying Boeing stock should carefully weigh the risks and rewards. The company has a long history of innovation and success. However, it is facing some serious challenges that could hurt its financial performance in the near term.
Technically Boeing Stock (BA) is on a strong bullish trend, but the recent price failed to form a significant long signal.
Let’s see the upcoming price direction from the Boeing Stock (BA) technical analysis:
Although the fundamental outlook is not solid for BA, the recent quarterly report showed some relief to bulls by improving earnings and revenue. The technical chart supports the bullish factor, where the latest monthly candle starts to create a trend, breaking 4-month’ long consolidation.
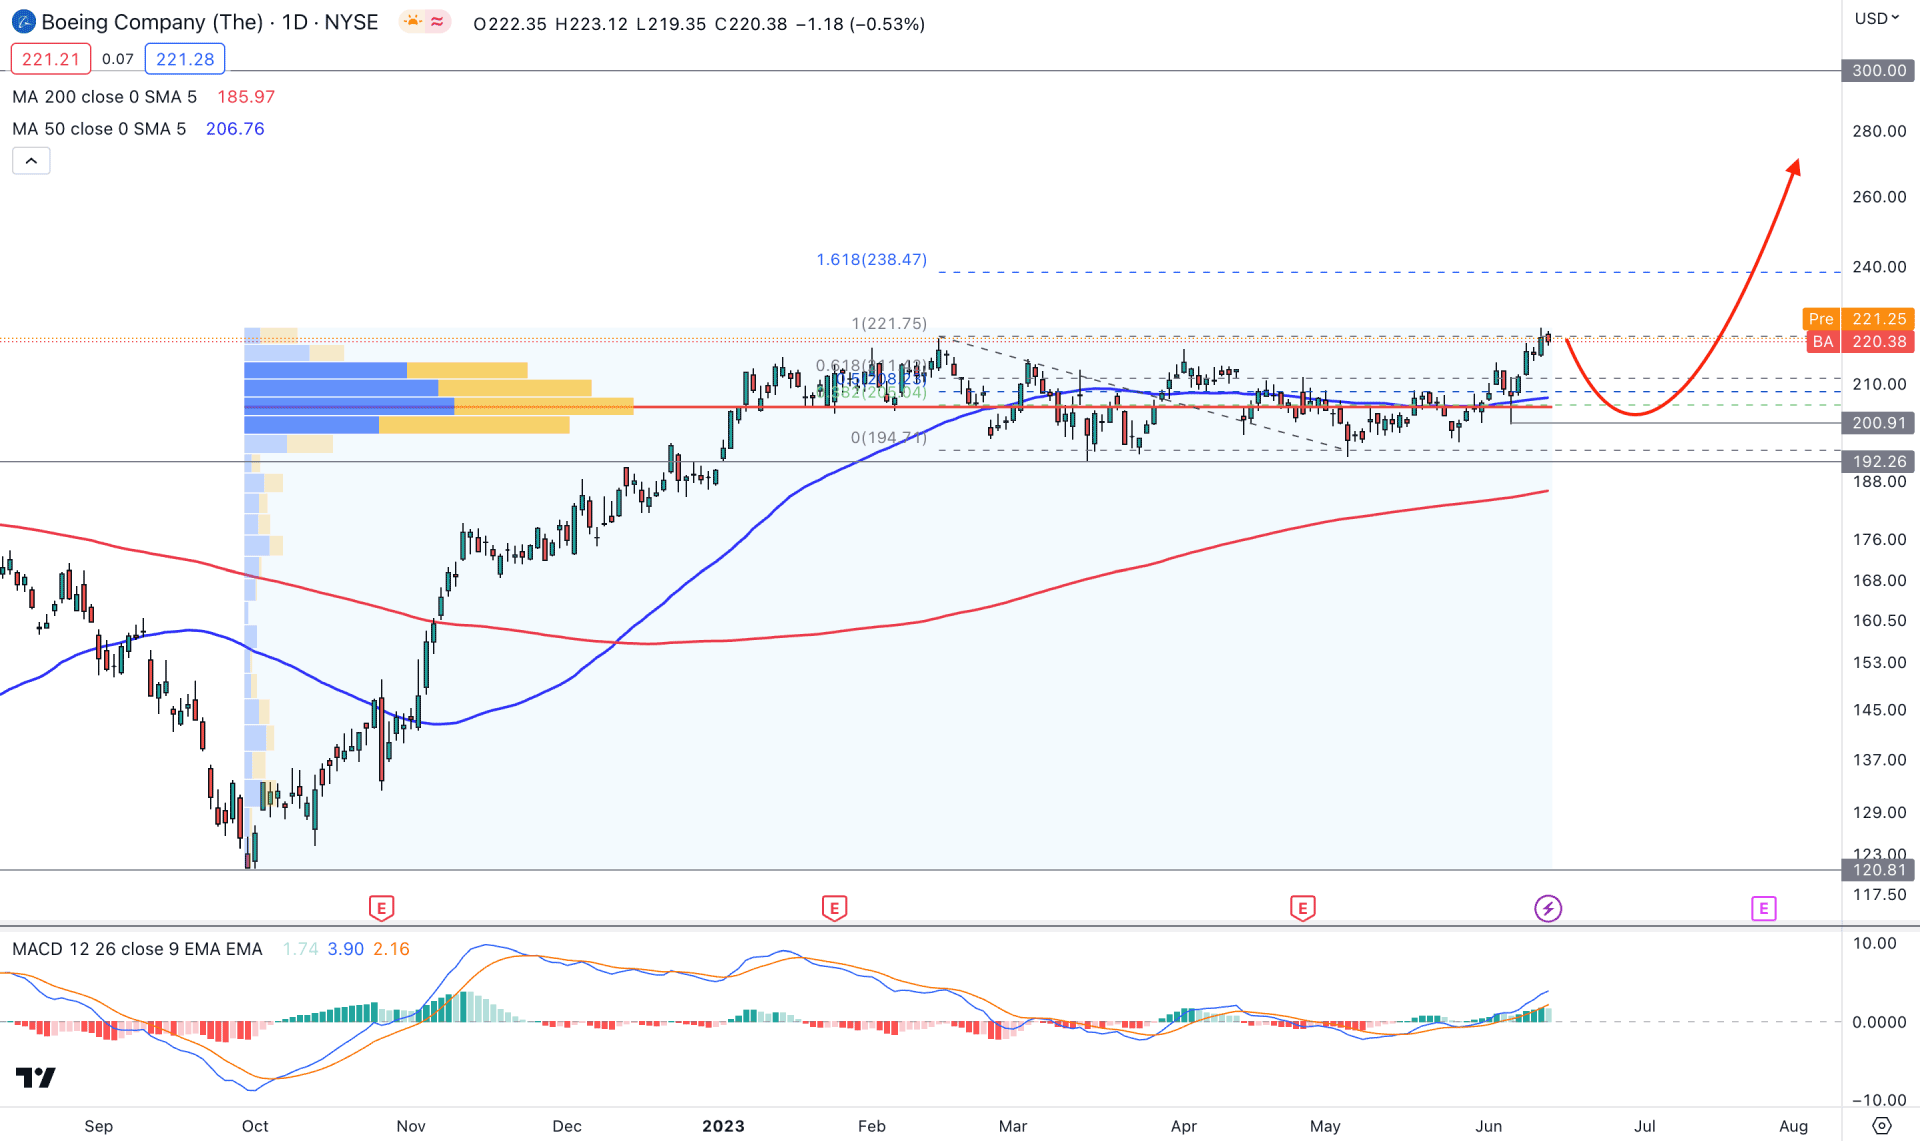
The picture is clearer on the daily chart, where the current price trades within a strong consolidation. Moreover, the upward pressure is supported by the Golden Cross, where the current price is above 50 and 200 days Simple Moving Average levels.
The ideal trading strategy from the Golden Cross continuation is to look for long trades as long as the price trades above the 200 SMA level. Bulls control the wheel for BA, supported by a larger trading volume.
As shown in the image, the highest trading volume level since the October 2022 low is at 204.54 level, which is below the current price. It is a sign that institutional orders are on the buyers' side and the price may respect the 204.54 level as critical support.
The indicator window shows the same story. As per the current reading, the MACD Histogram is above the neutral line, while MACD EMA’s are yet to reach the overbought area.
Based on the current price outlook, this stock's buying pressure is potent, and the current bullish swing could extend toward the 238.47 level. Moreover, a stable price above this zone could increase the momentum towards the 300.00 psychological area.
However, the macro outlook may change if bears join the market and form a bullish liquidity sweep from the 223.00 level. A bearish daily close below the 50-day SMA would be the first of the selling pressure, which can lower the price toward the 150.00 level.
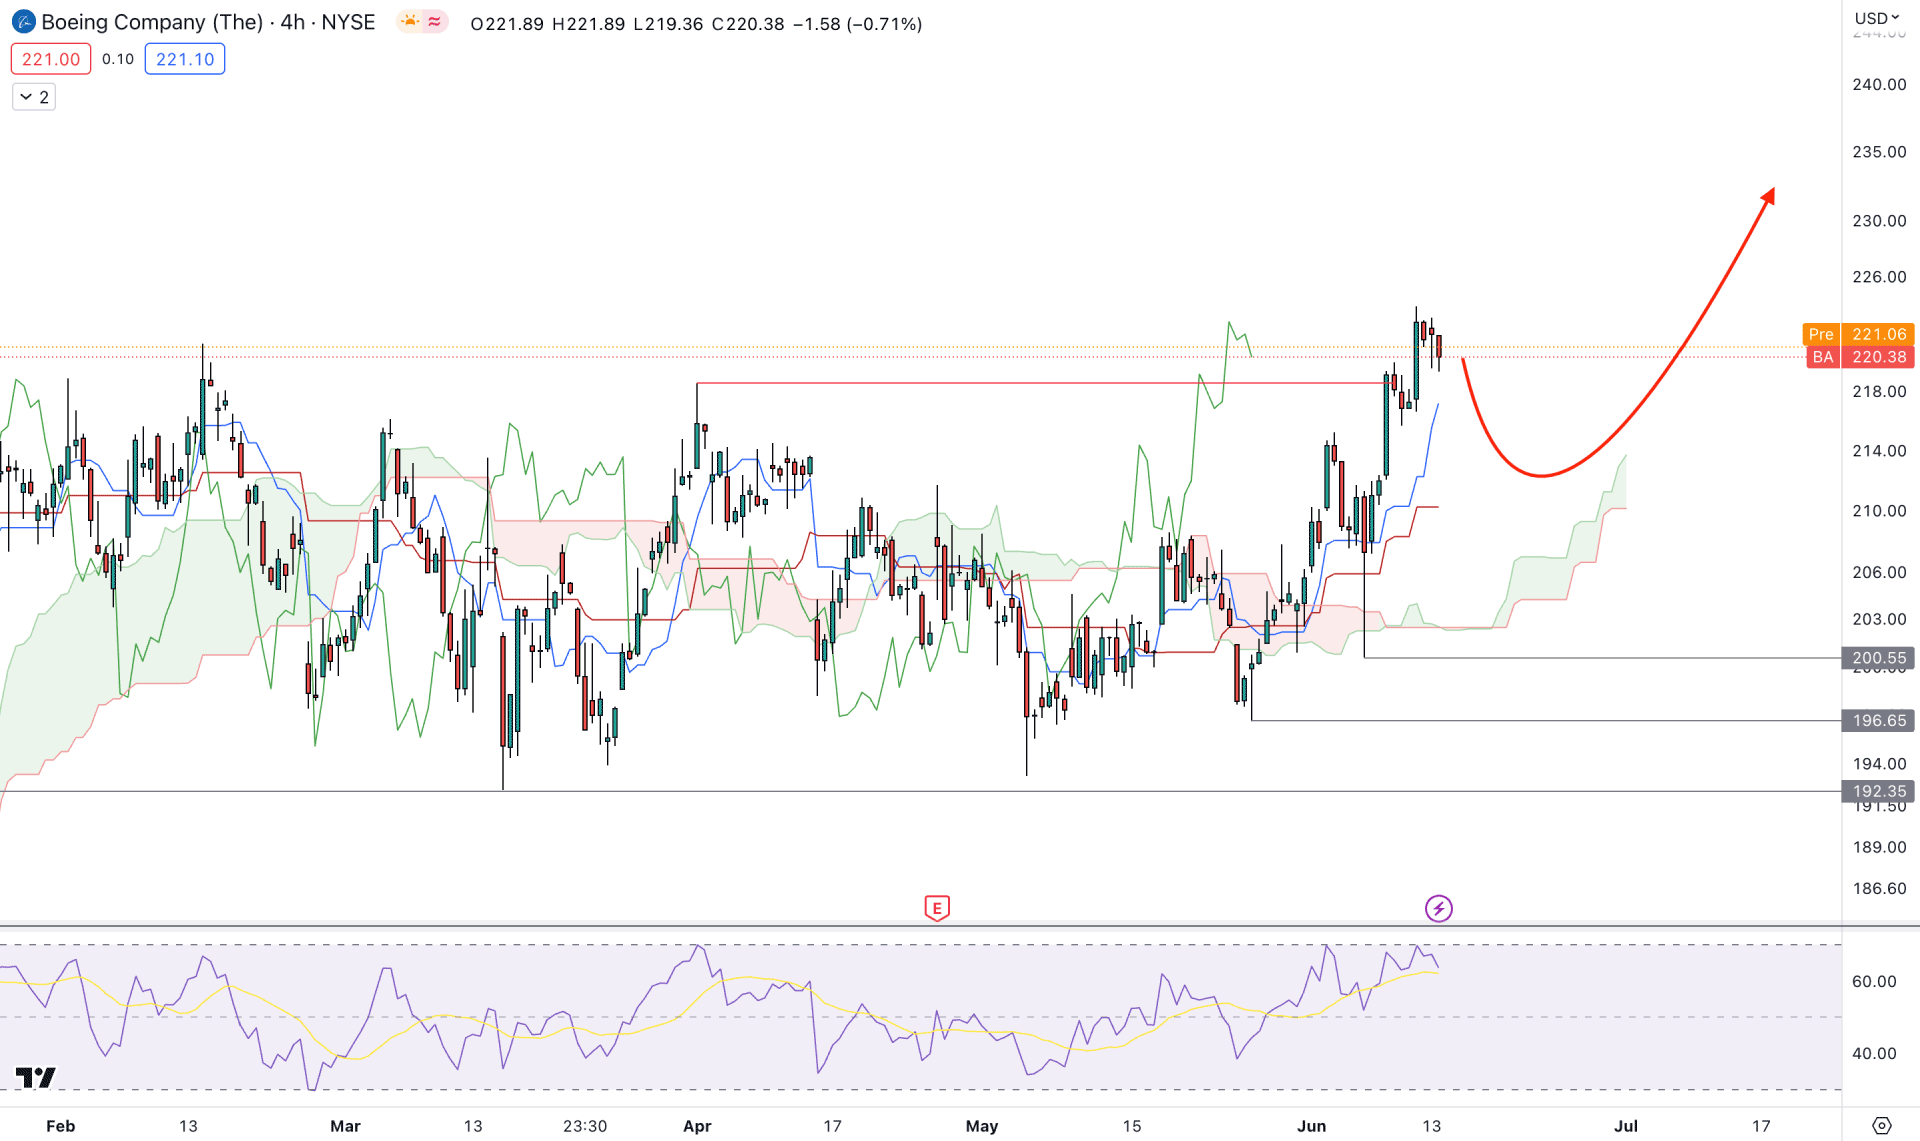
In the H4 timeframe, the current market trend is bullish, initiated from the break-of-structure at the 218.58 swing high. Moreover, the most recent bullish swing came with multiple demand zone formations at 196.65 and 200.55 levels. The Ichimoku Cloud breakout worked as a confluence support to the buying pressure, where the current future cloud shows a strong buy signal.
A different story is presented at the indicator window, where the current RSI level is at an overbought area.
Based on the outlook, the overbought RSI might create some selling pressure in the market, but the broader direction is bullish until the price comes below the 192.35 level.
On the buy side, any minor rebound from the 210.00 to 200.55 level could resume the trend toward the 250.00 area.
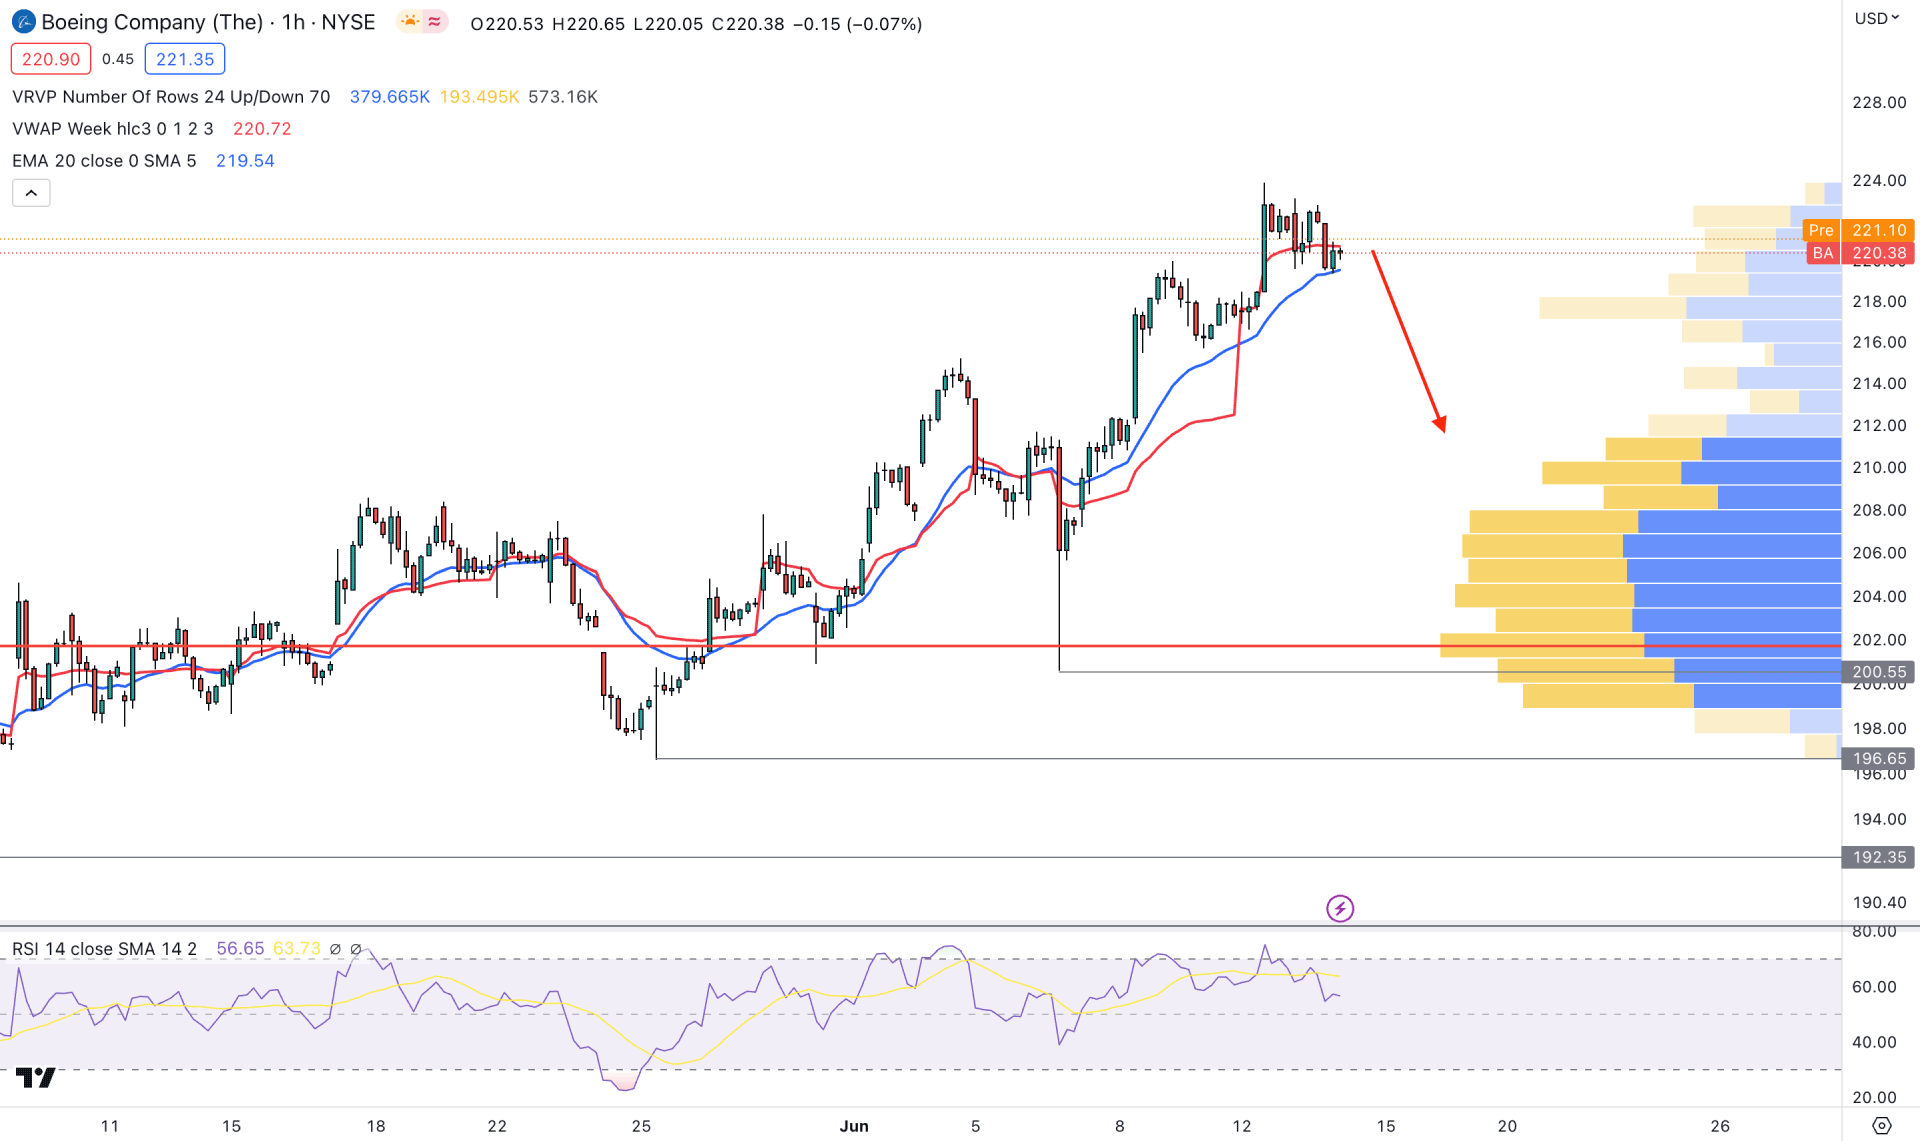
In the H1 timeframe, the existing market trend is bullish, supported by the high volume level at 201.71. Moreover, the dynamic VWAP level is closer to the price, working as a support level.
The current RSI shows a rebound from the 70.00 line and holds momentum above the 50.00 neutral area.
Based on this outlook, we may expect the bullish trend to continue, but a minor downside correction may happen. However, breaking below the 192.35 level would invalidate the long position but a rebound from the 210.00 to the 200.00 area could be a decent bullish signal.
Based on the BA multi-timeframe analysis, we may conclude by saying that Boeing stock is more likely to increase the price in the coming days. As the current price is at a critical resistance level, a prover bullish break is needed before anticipating any long position.


