
Published: April 16th, 2025
As of Q4, Blackstone's dry powder value was $168.6 billion, which is almost 14.9% of the $1.127 trillion in total assets under control. As asset levels have significantly declined, Blackstone can use the opportunity to deploy investment at more enticing values.
With a compound annual growth rate (CAGR) of 12.1% over the past four years, Blackstone has nearly doubled its fee-earning AUM. In the most recent fiscal year, the company recorded record sales of $11.6 billion and FRE of $5.3 billion.
Even though 2024's $171.6 billion in inflows were significantly less than 2021's due to outstanding fund results, particularly in real estate and private equity, they were nevertheless $22.9 billion greater than the year before and expanded at a 12.5% CAGR over 2020.
Last but not least, the company's net accrued earnings of $6.281 billion are impressive and might be converted into future income provided expenditures are realized and values stay the same.
Blackstone's stock was formerly valued highly, but following a 36% decline in value, the shares are now a good time to acquire.
Future fund achievements will be improved by using the $170 billion in dry powder assets as a deployment opportunity to locate businesses at more appealing prices.
Despite possible risks from market volatility and performance fee issues, Blackstone's stock is attractive at its present pricing of 27.4x price-to-distributable profits. A cheerful, laid-back businesswoman meets with her manager.
Moreover, Blackstone is collaborating with Wellington Management and Vanguard to create vehicles enabling individuals to participate in public and private assets currently only available to accredited and institutional investors.
The partners announced on Tuesday that the new partnership, the initial of this sort between the organizations, will increase the availability of multi-asset holdings and use each firm's unique strengths.
Let's see the further aspect of this stock from the BX technical analysis:
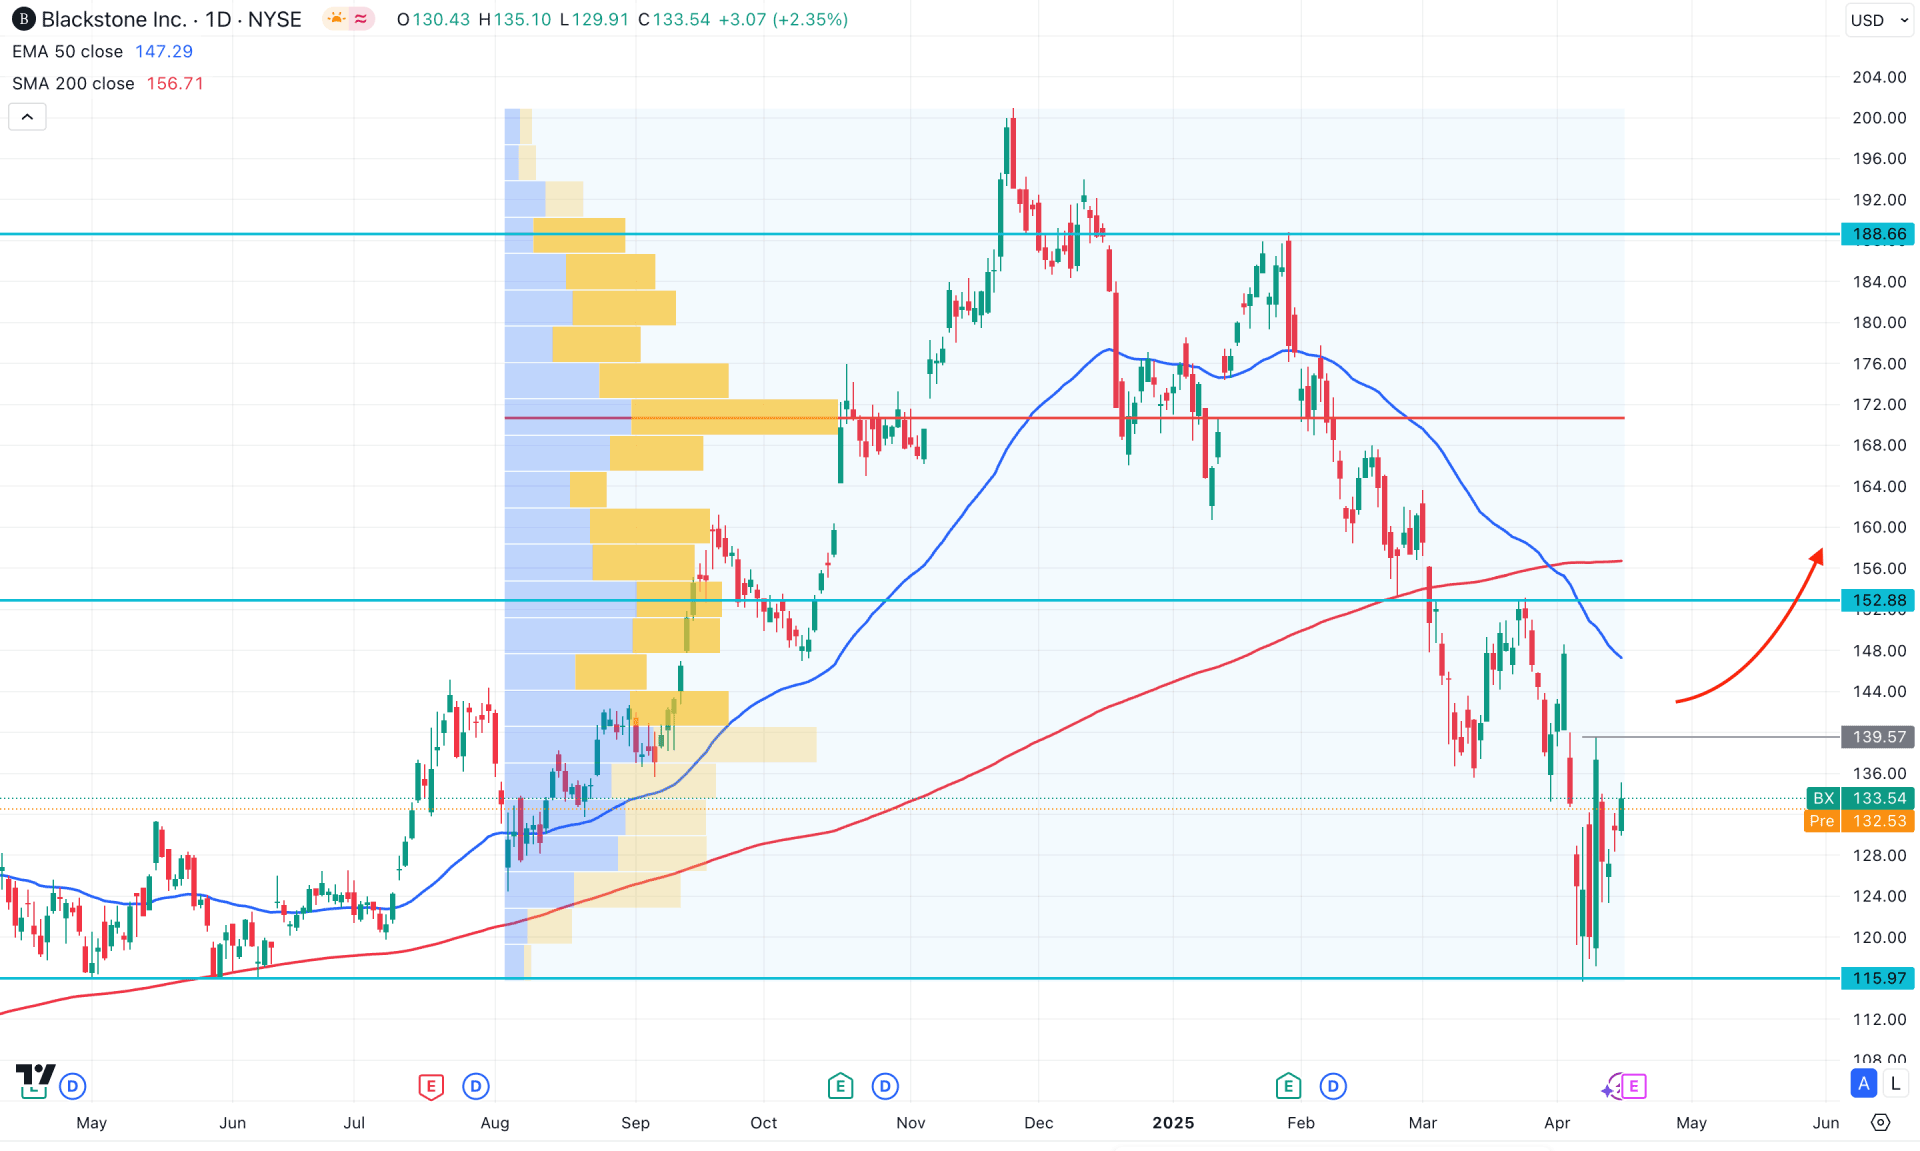
In the daily chart of Blackstone Stock (BX), the recent price action indicates extended selling pressure, finding support at a crucial bottom. Investors should monitor how the price reacts at this discounted area before anticipating future movements.
Looking at the higher timeframe, the price is still consolidating, while three consecutive monthly candles are showing indecision. However, the most recent month grabbed sell-side liquidity below the March 2025 low and rebounded from the 50-month moving average. In this context, a bullish flip above the April opening price could recover all losses incurred below the March 2025 low.
On the other hand, the weekly price is still trading sideways, with the near-term resistance level at 152.88 intact. After overcoming this weekly resistance, a primary bullish move may begin, opening the door for a potential bullish trend continuation.
The volume structure, the highest activity level since August 2025, is 170.66. Although the current price is trading below this high-volume node, the 41% gap indicates enough room for a significant bullish correction.
On the main price chart, both dynamic levels (50-day EMA and 200-day SMA) are trading above the current price, with a potential bearish crossover. A continuation from this potential death cross setup could present a bearish trend continuation opportunity.
Meanwhile, the Relative Strength Index (RSI) has rebounded from the oversold 30.00 level but is still hovering below the 50.00 mark. In that case, a bullish trend may emerge once the RSI moves above the 50.00 level, confirming strengthening momentum.
Based on the current market structure, a bearish trend continuation is visible, with the 139.57–152.88 area acting as a critical supply zone. A bullish breakout above 139.57 with immediate follow-through could signal a bullish continuation toward the 155.97 level.
Additionally, an emerging trendline resistance is visible from the February 2025 high to the April 2025 high. A strong bullish push above the 150.00 level could validate a trend reversal and a breakout above this trendline. In that case, a shift in the broader market trend may occur, potentially opening the path toward retesting the 188.66 level.
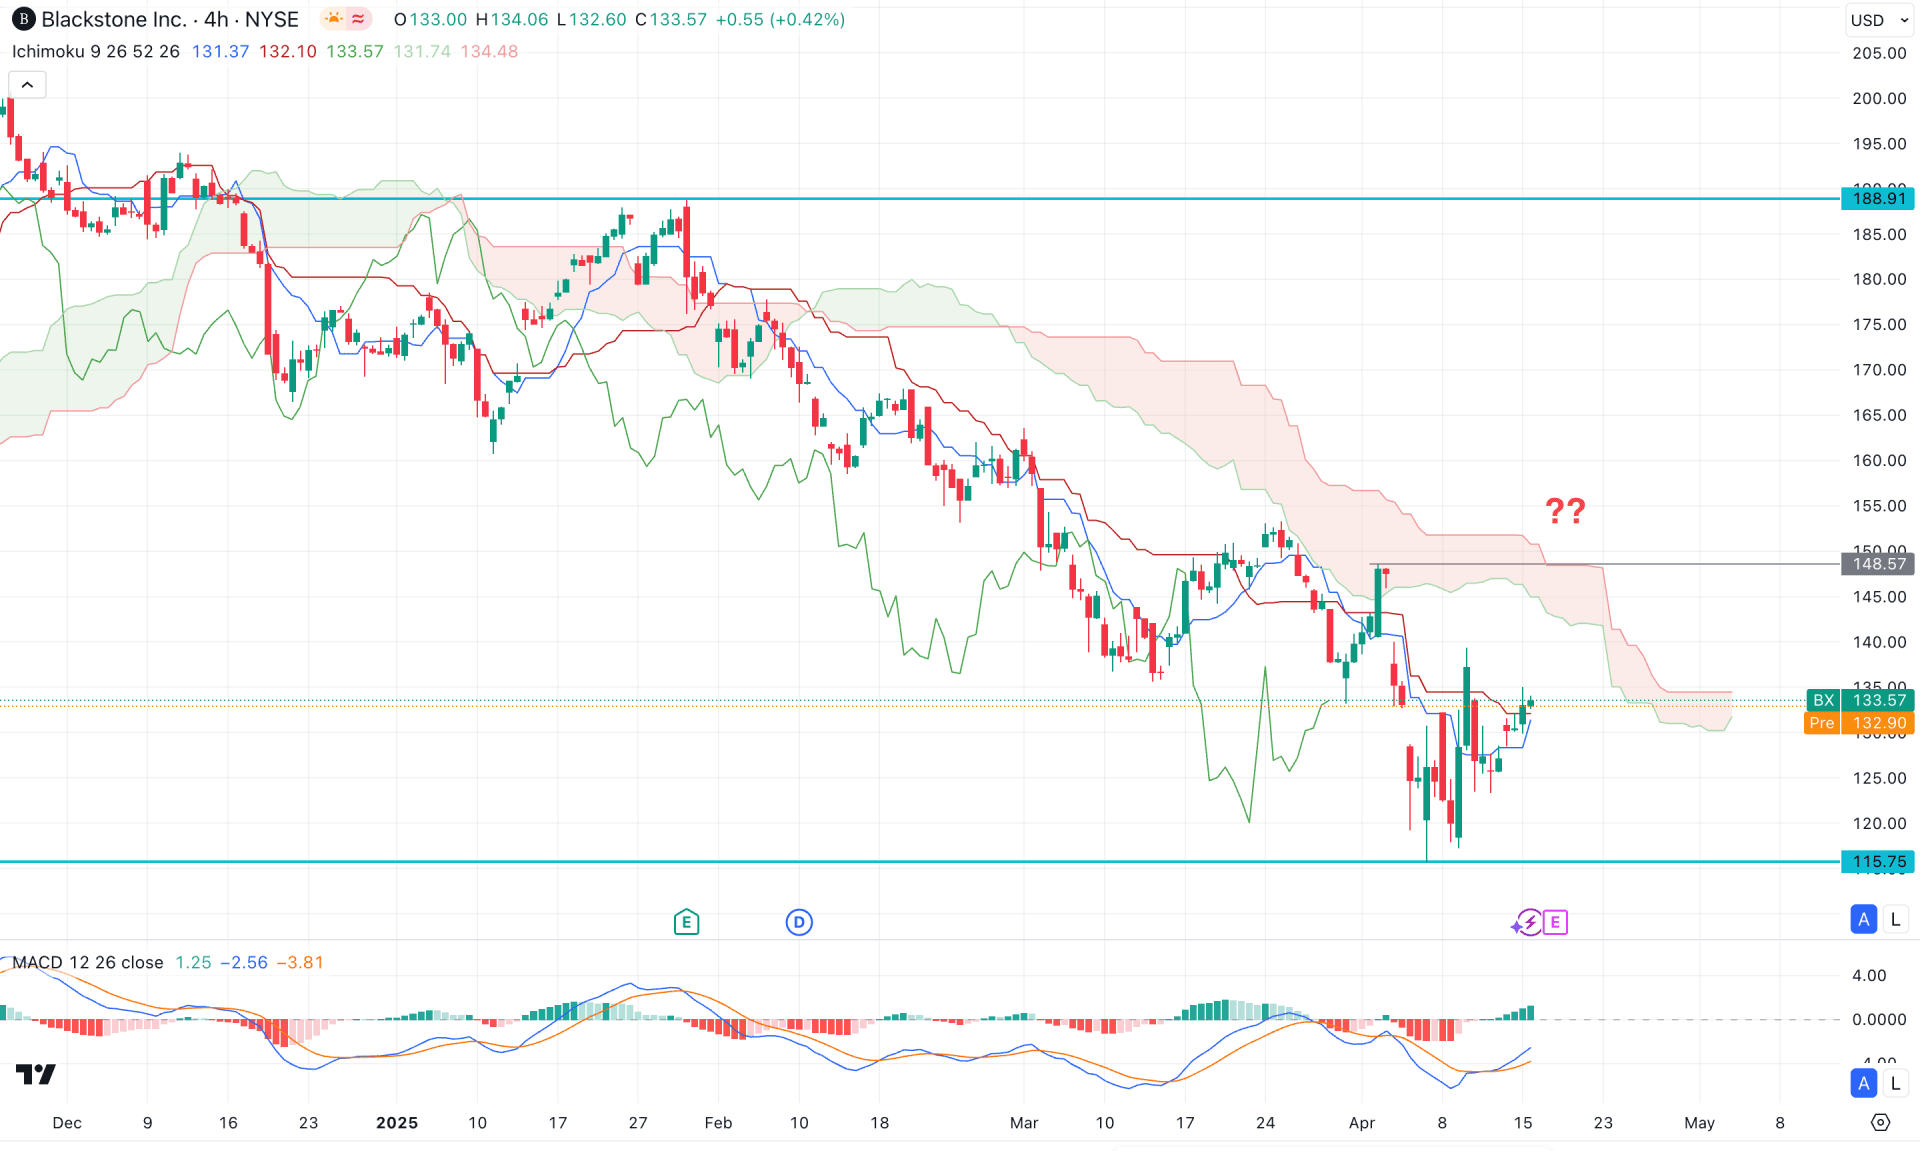
On the four-hour timeframe, Blackstone stock is trading within a bearish trend as the current price hovers below the cloud resistance. However, the future cloud has flattened, signalling a potential limit to the ongoing selling pressure.
Moreover, the most recent price action has rebounded above the dynamic Kijun-sen support, indicating a pause in the prevailing bearish momentum. In this case, investors should monitor how the price holds above the Kijun-sen area, as a bullish rebound is possible from this potential demand zone.
In the indicator window, the signal line has formed a bullish crossover, suggesting a potential bottom formation on the main price chart, supported by five consecutive bullish histogram bars.
Based on this outlook, a bullish trend reversal would require a breakout above the 148.57 resistance level, which could then pave the way toward the 188.91 area. On the other hand, a bullish continuation above the 139.30 swing high with a reversal below the Kijun-sen level could resume the existing uptrend toward the key psychological level at 100.00.
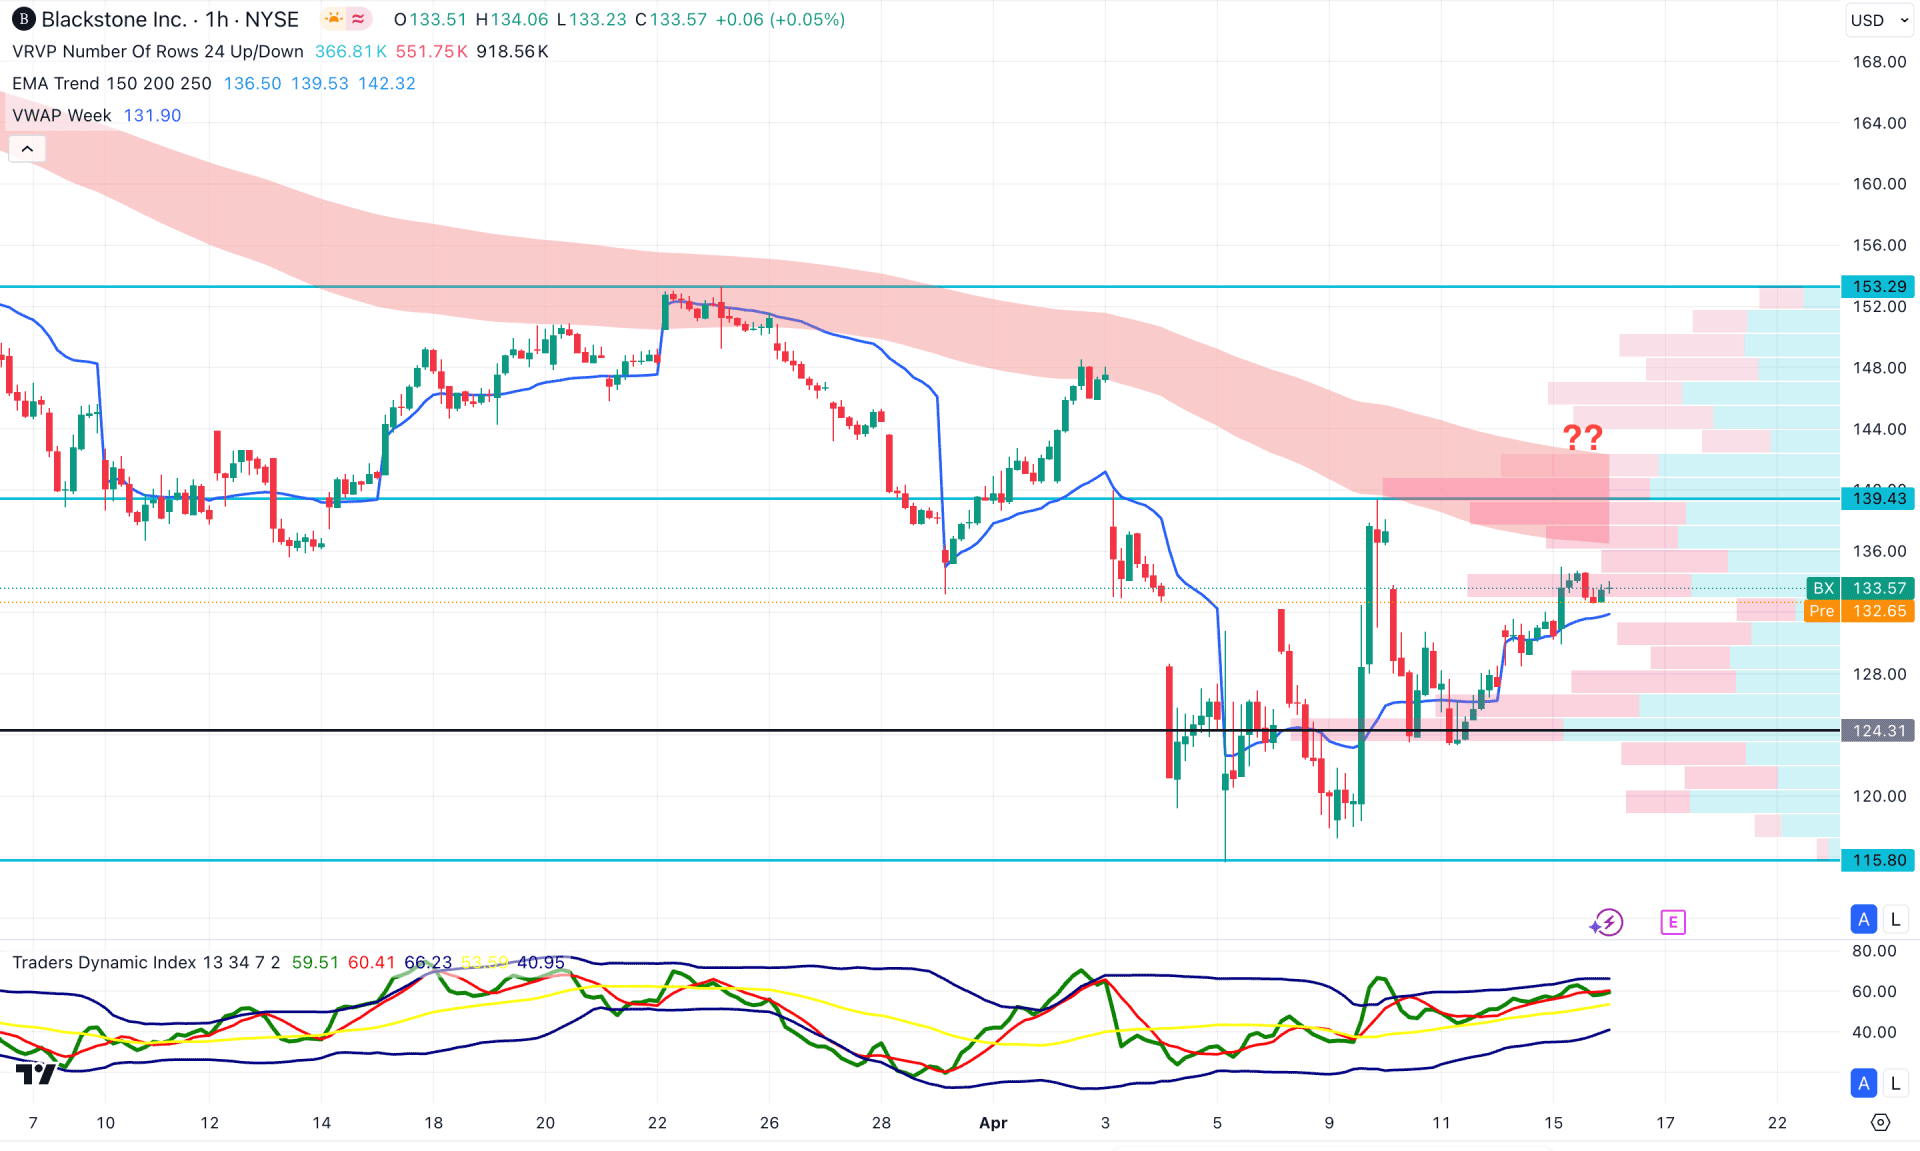
In the hourly timeframe, an extensive intraday volatility is visible for BX, where the intraday high volume are is below the current price. However, the EMA wave is acting as a major resistance by remaining above the 139.43 static level.
In the indicator window, the current Traders Dynamic Index (TDI) is at the upper peak area suggesting an ongoing buying pressure.
Based on the current market outlook, the rising VWAP support needs more pressure before validating the long move above the EMA wave. Meanwhile, a valid bearish reversal from the current price area with an hourly close below the 124.31 level could extend the intraday bearish pressure.
The Blackstone Stock (BX) is facing major support from the multi-year low, which has not yet validated a bullish reversal. As the intraday price is still bearish, investors might expect the price to follow the major trend after having sufficient intraday liquidity.


