
Published: April 3rd, 2025
According to the regulator's website, BlackRock entered the Financial Conduct Authority's strict crypto register on Tuesday.
The largest asset management in the world will be permitted to represent iShares Digital Assets AG as an arranger for the company's Exchange Traded Products (ETPs), which are financial instruments linked to a fundamental asset, in this case, a cryptocurrency asset.
It is difficult to register on the crypto registry in the United Kingdom. In 2020, the FCA established its crypto register to make sure that cryptocurrency companies that wanted to work with clients in the United Kingdom could only do so after registering in accordance with the nation's anti-money laundering regulations. Out of 368 applications, only 51 enterprises have been authorized in the United Kingdom.
Moreover, BLK investors should closely monitor the stock in light of recent changes in the options market. The expected volatility of the April 17, 2025, $480.00 Call was among the highest of all options for equity available today.
This significant implied volatility might indicate a trade is brewing, given analysts' current sentiment over BlackRock. Moreover, the upcoming earnings report and the response from the tariff talk could influence the BLK price for the coming days.
Let's see the upcoming price direction from the BLK technical analysis:
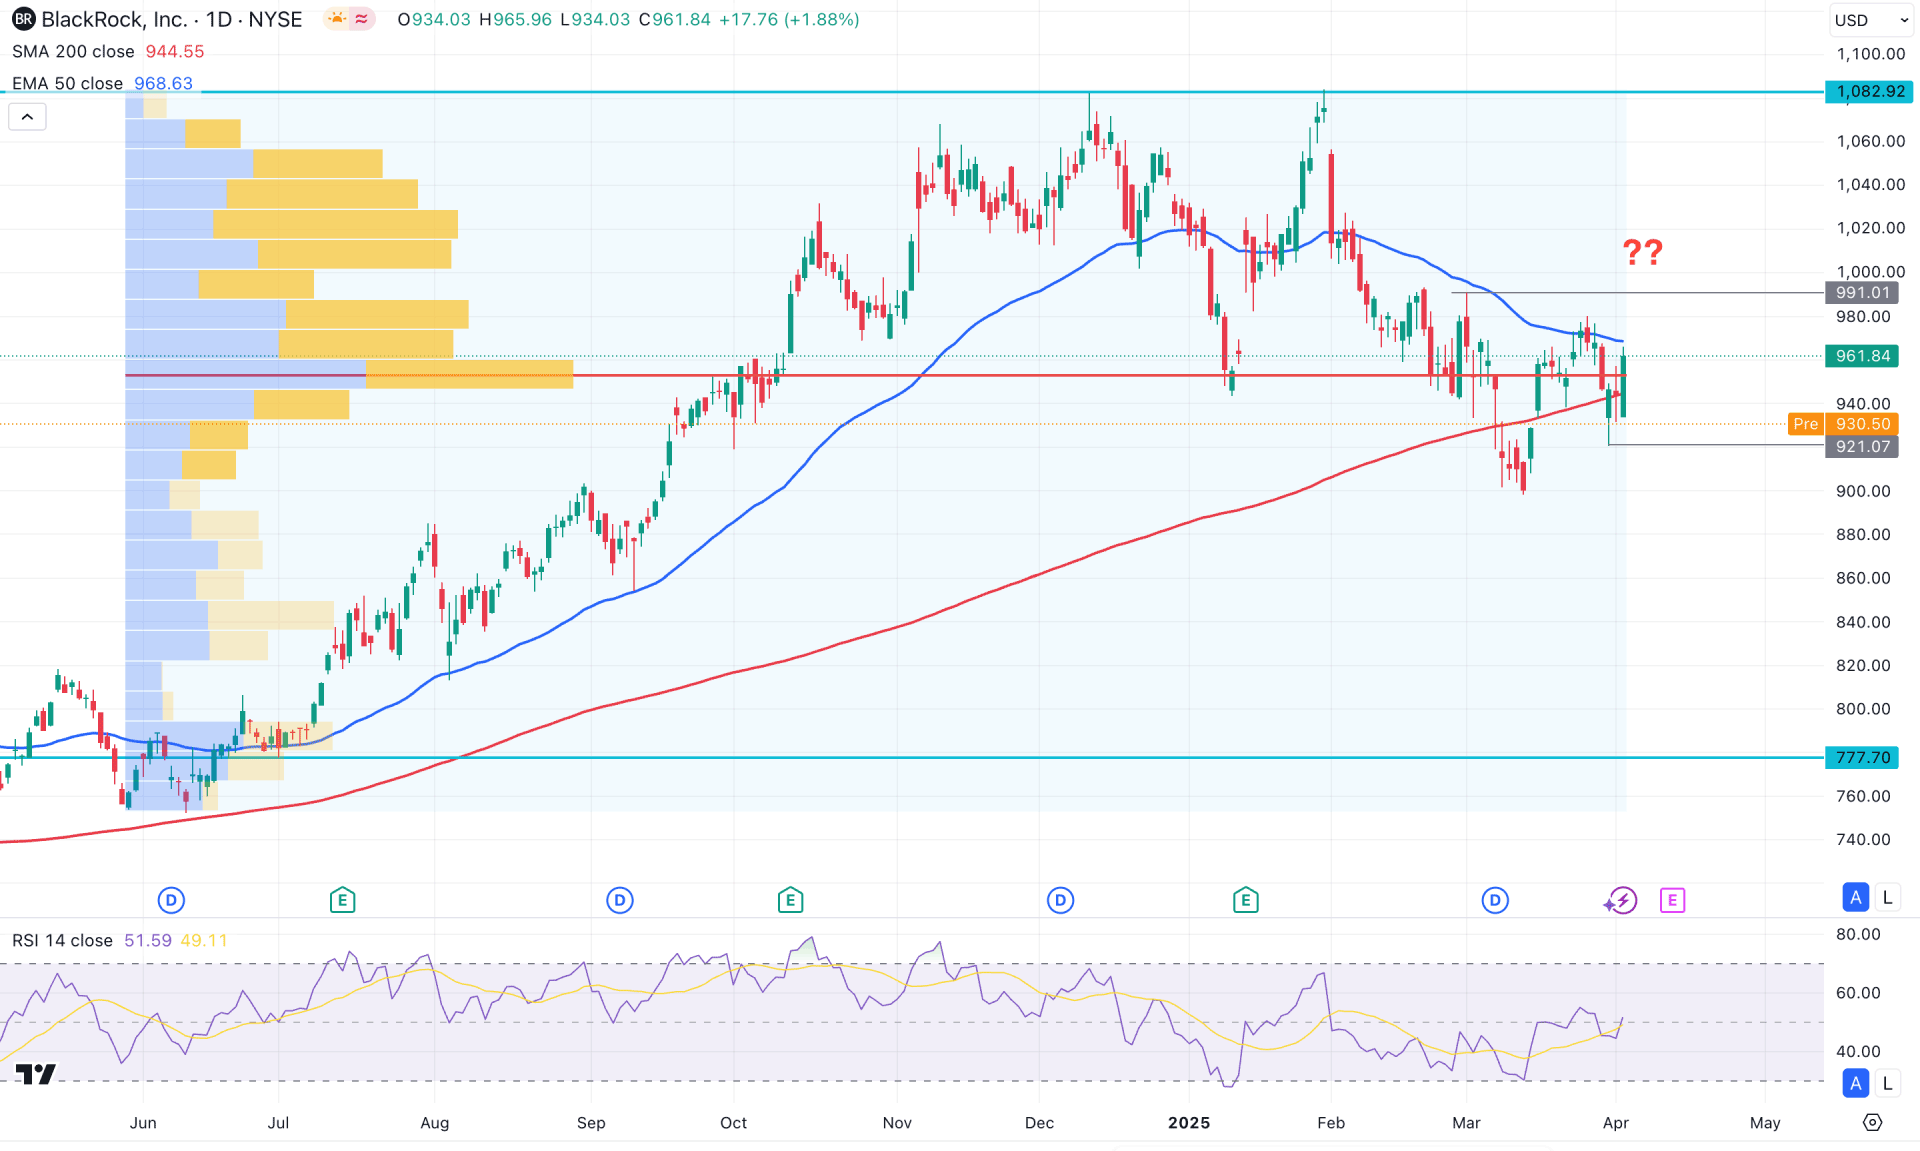
In the daily chart of BlackRock stock (BLK), the price is trading within a consolidation, where a solid top has formed at the 1082.92 level. After making an all-time high, the price rebounded lower and created two consecutive lower lows. In this case, investors should monitor how the price holds its momentum below the near-term resistance level before anticipating a bearish continuation.
In the volume structure, a larger consolidation is visible, with the most active level since June 2024 at the 954.05 level. As the price is trading within a symmetrical triangle at the high volume area, investors might expect a stable trend after liquidity is grabbed.
In the main price action, the 200-day SMA is within the range, signaling immediate support. Moreover, the 50-day EMA is above the current price and acts as a barrier to buyers.
In the indicator window, the Relative Strength Index (RSI) found a bottom at the 30.00 level and rebounded above the 50.00 neutral point. Additionally, a potential divergence has been identified, where the RSI failed to form a new swing low, contrary to the market trend.
In this context, the ideal trading approach is to wait for the price to overcome the 50-day EMAe before anticipating a bullish move. In that case, overcoming the 991.01 resistance level could be a conservative long entry, aiming for the 1082.92 high. Moreover, a stable consolidation above the 1000.00 psychological level could open the room for a move beyond the 1100.00 area.
On the other hand, a deeper correction is possible after overcoming the high-volume line. In that case, the 921.07 level could be a crucial swing point to watch. A break below this line could extend the loss below the 860.00 level, and the price might revisit the 800.00 to 777.77 area before forming a bullish shift.
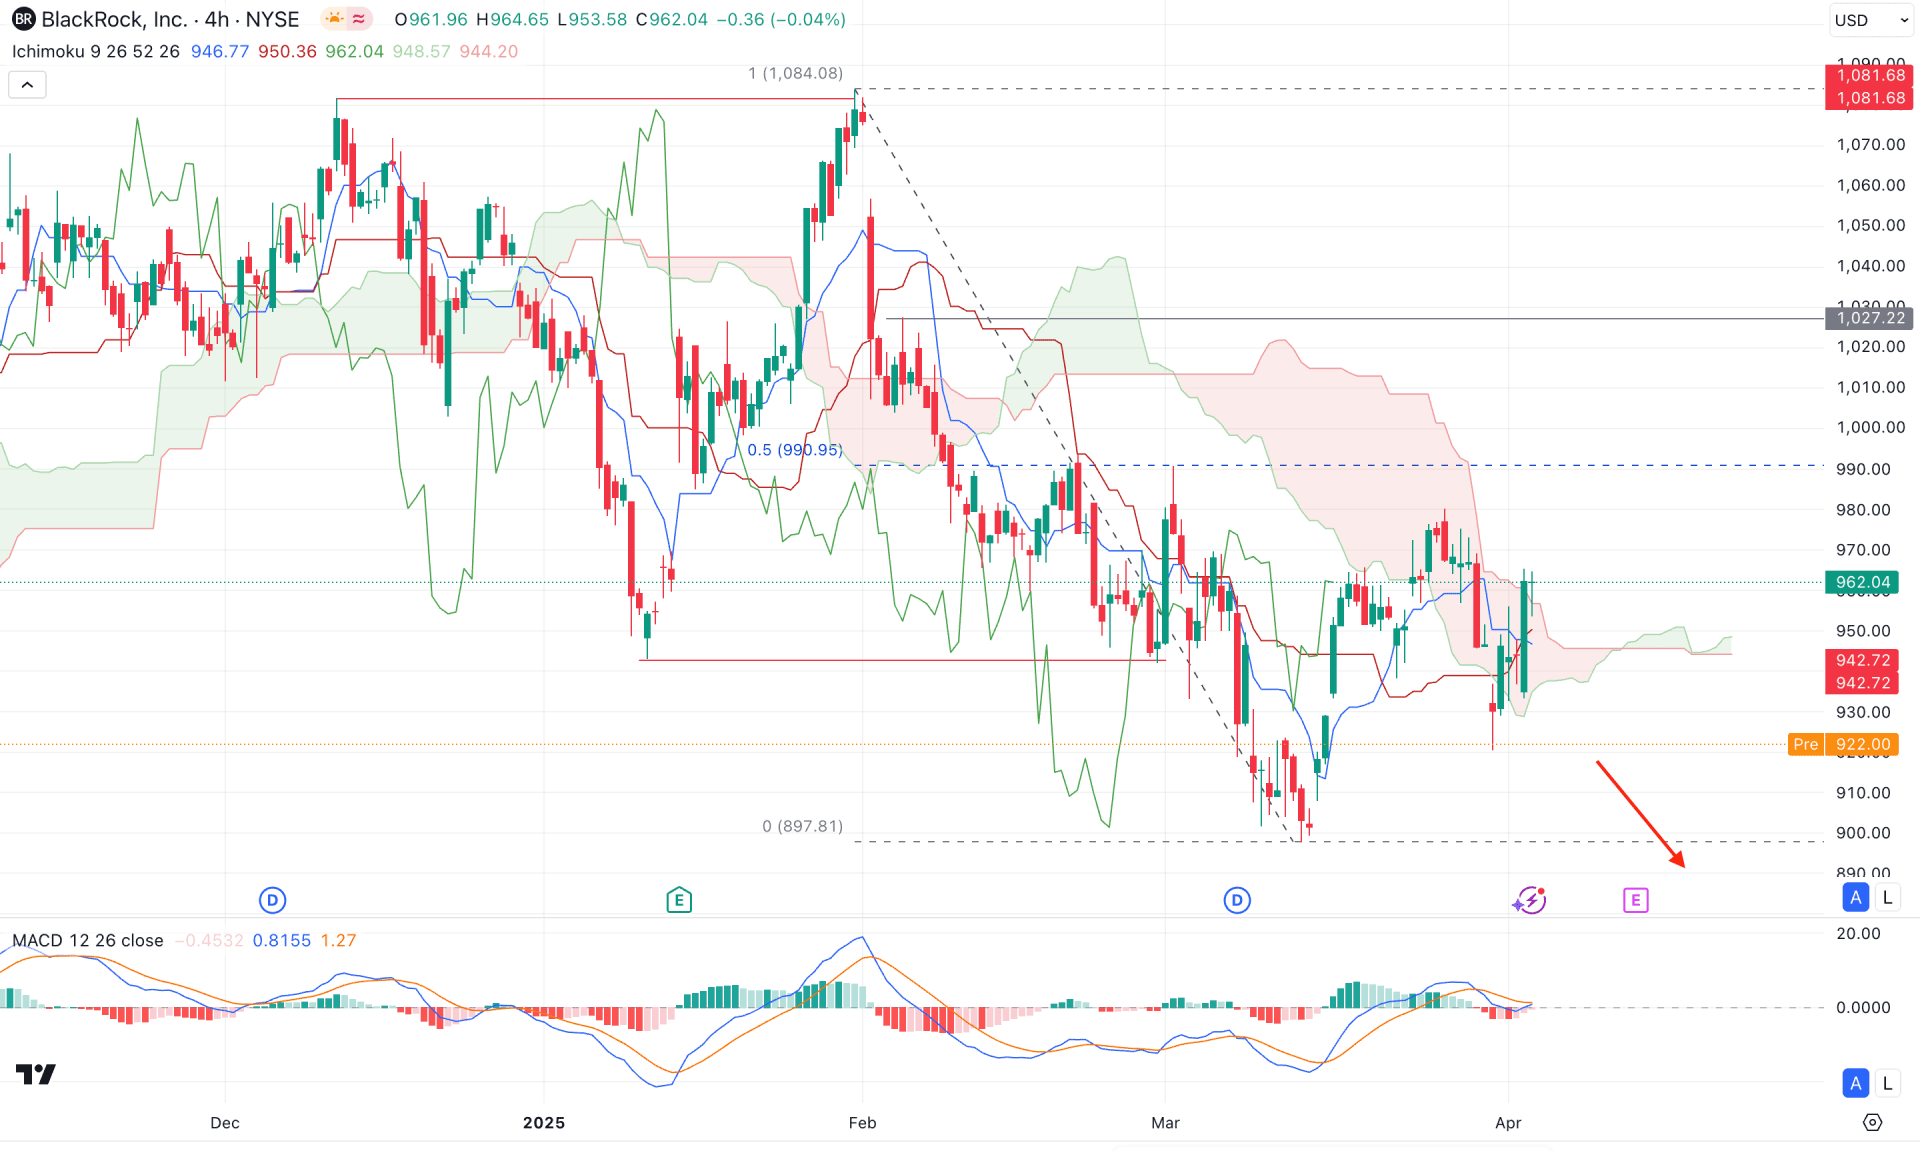
In the four-hour timeframe, a buy-side liquidity sweep from the 1084.08 level, followed by an immediate bearish swing low below the 943.38 level, signals a trend shift with a valid change of character formation. However, the price is likely to form a solid bullish recovery after setting a bottom at the 897.81 level.
Based on the cloud indicator, the current price is trading sideways within the cloud, but the future cloud shows indecisive momentum. As both future cloud lines are close together, investors might expect a stable trend once the range extension is over.
On the bearish side, immediate selling pressure below the 900.00 level could activate a short-term opportunity targeting the 814.02 swing low.
On the other hand, a failure to hold the price below the 897.81 level could encourage bulls to take control, potentially initiating a range extension. However, overcoming the 1000.00 psychological level with a valid cloud breakout is needed before anticipating the continuation of the daily trend.
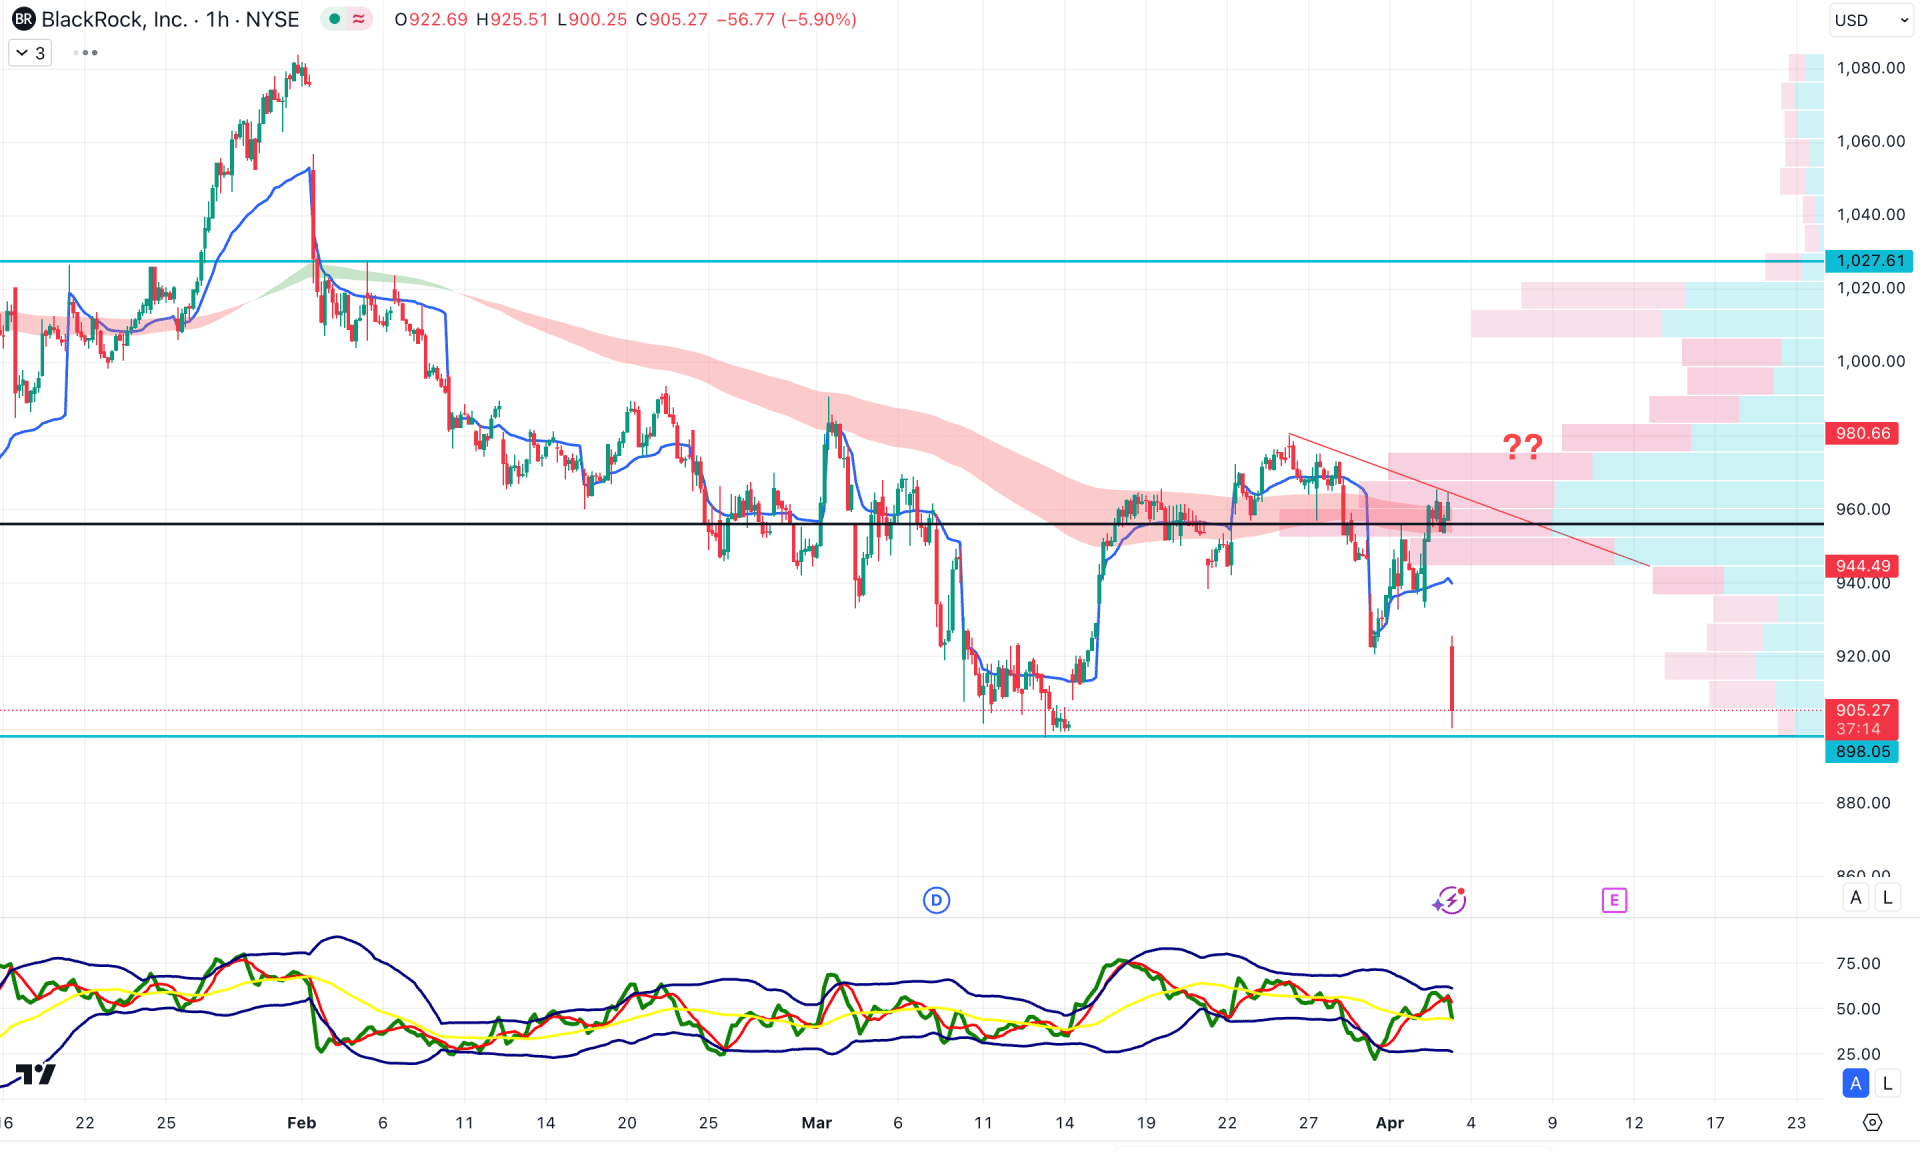
In the hourly time frame, immediate selling pressure follows the volatility from the tariff talks. As a result, the price extended the selling pressure below the exponential moving average wave.
In the indicator window, the Traders Dynamic Index remains near the top, signaling a wider space on the selling side.
Based on this outlook, investors should closely monitor how the price reacts at the 898.05 level. A rebound from this area, followed by a recovery to the 956.41 level, could present a highly probable long opportunity.
On the other hand, corrective bullish pressure toward the weekly BWAP level, with a valid bearish rejection, could extend the selling pressure below the 860.00 level.
Based on the ongoing market structure, BlackRock stock is trading within a valid selling pressure. The price failed to hold momentum after creating an all-time high. Two consecutive lower lows have formed, so the price is likely to experience a "pump and dump" pattern after violating the 897.98 level.


