Published: September 18th, 2024
As per TAO on-chain metrics, the risk-adjusted return indicator, the Sharpe Ratio, has been pointing to a promising purchase possibility for Bittensor. It has stayed positive over the past few days, indicating that owning TAO has more benefits than drawbacks. This is encouraging news for investors hoping to profit from the impending bull market breakout.
The market is still optimistic as long as the Sharpe Ratio indicates favorable circumstances. Traders speculate that TAO will pick up steam in the upcoming days, which might be the spark required for it to ultimately break through the crucial $357 level.
In addition, Bittensor's general momentum is strengthening, especially when looking at the financing rate. According to recent statistics, traders anticipate a price increase as long contracts outnumber shorts. The market is leaning bullish, and hopes for a rally are still building, as evidenced by the rising funding rate.
This is consistent with technical signals suggesting that the price of TAO may rise. Traders believe that significant resistance levels are now within attain and that the preponderance of lengthy positions will spur additional upward movement.
Let's see the further outlook of this cryptocurrency from the TAO/USDT technical analysis:

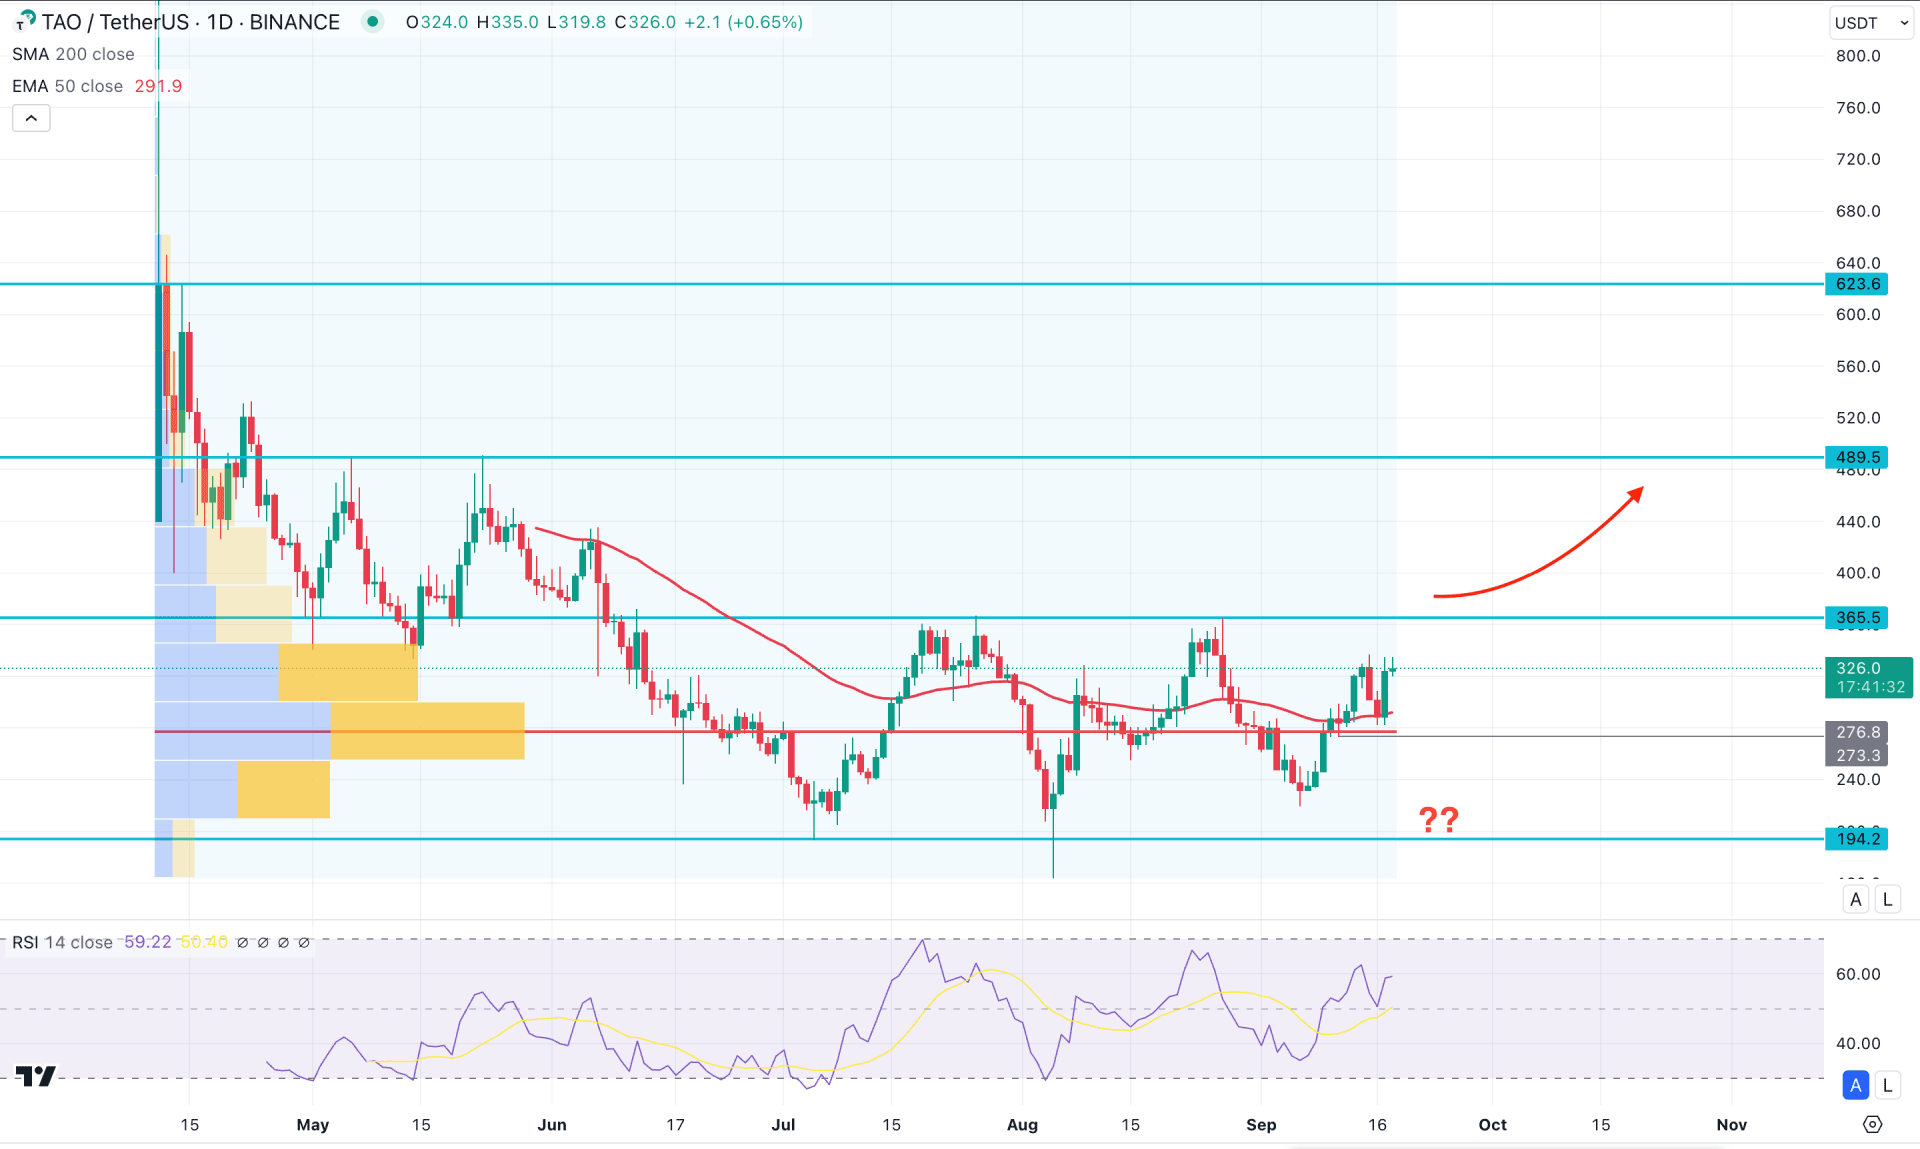
In the daily chart of TAOUSD, the recent price shows extensive corrective pressure, suggesting a bullish pre-breakout momentum.
In the higher timeframe, the latest monthly candle suggests volatility, where a valid bottom is found at the 164.00 level. Moreover, the recent weekly candle closed as a bullish engulfing candle. It is a sign that the price is trading at the discounted zone; any bullish opportunity in the lower timeframe could provide a high probability of a long opportunity.
In the volume structure, the bullish accumulation phase is active, where the current high volume level since the beginning is at the 273.30 level. Primarily, the bullish continuation is potent as long as the current price hovers above the crucial high volume line.
In terms of daily price, the 50-day Simple Moving Average is closer to the current price and works as an immediate support level. Moreover, the 14-day Relative Strength Index (RSI) rebounded from the neutral 50.00 line, suggesting a bullish pressure.
Based on the daily market outlook of TAO/USDT, the current buying pressure is potent, and a HODLing approach could provide a long-term benefit. In the current context, the 365.50 level would be a crucial resistance level to look at. A successful break above this line could initiate a long-term bullish trend, aiming for the 489.50 level.
On the other hand, investors should monitor how the price reacts on the 330.00 to 367.00 zone as a valid bearish recovery with an H4 close below the 50 day EMA might resume the existing trend. In that case, a deeper downside correction might happen aiming for the 194.20 support level.

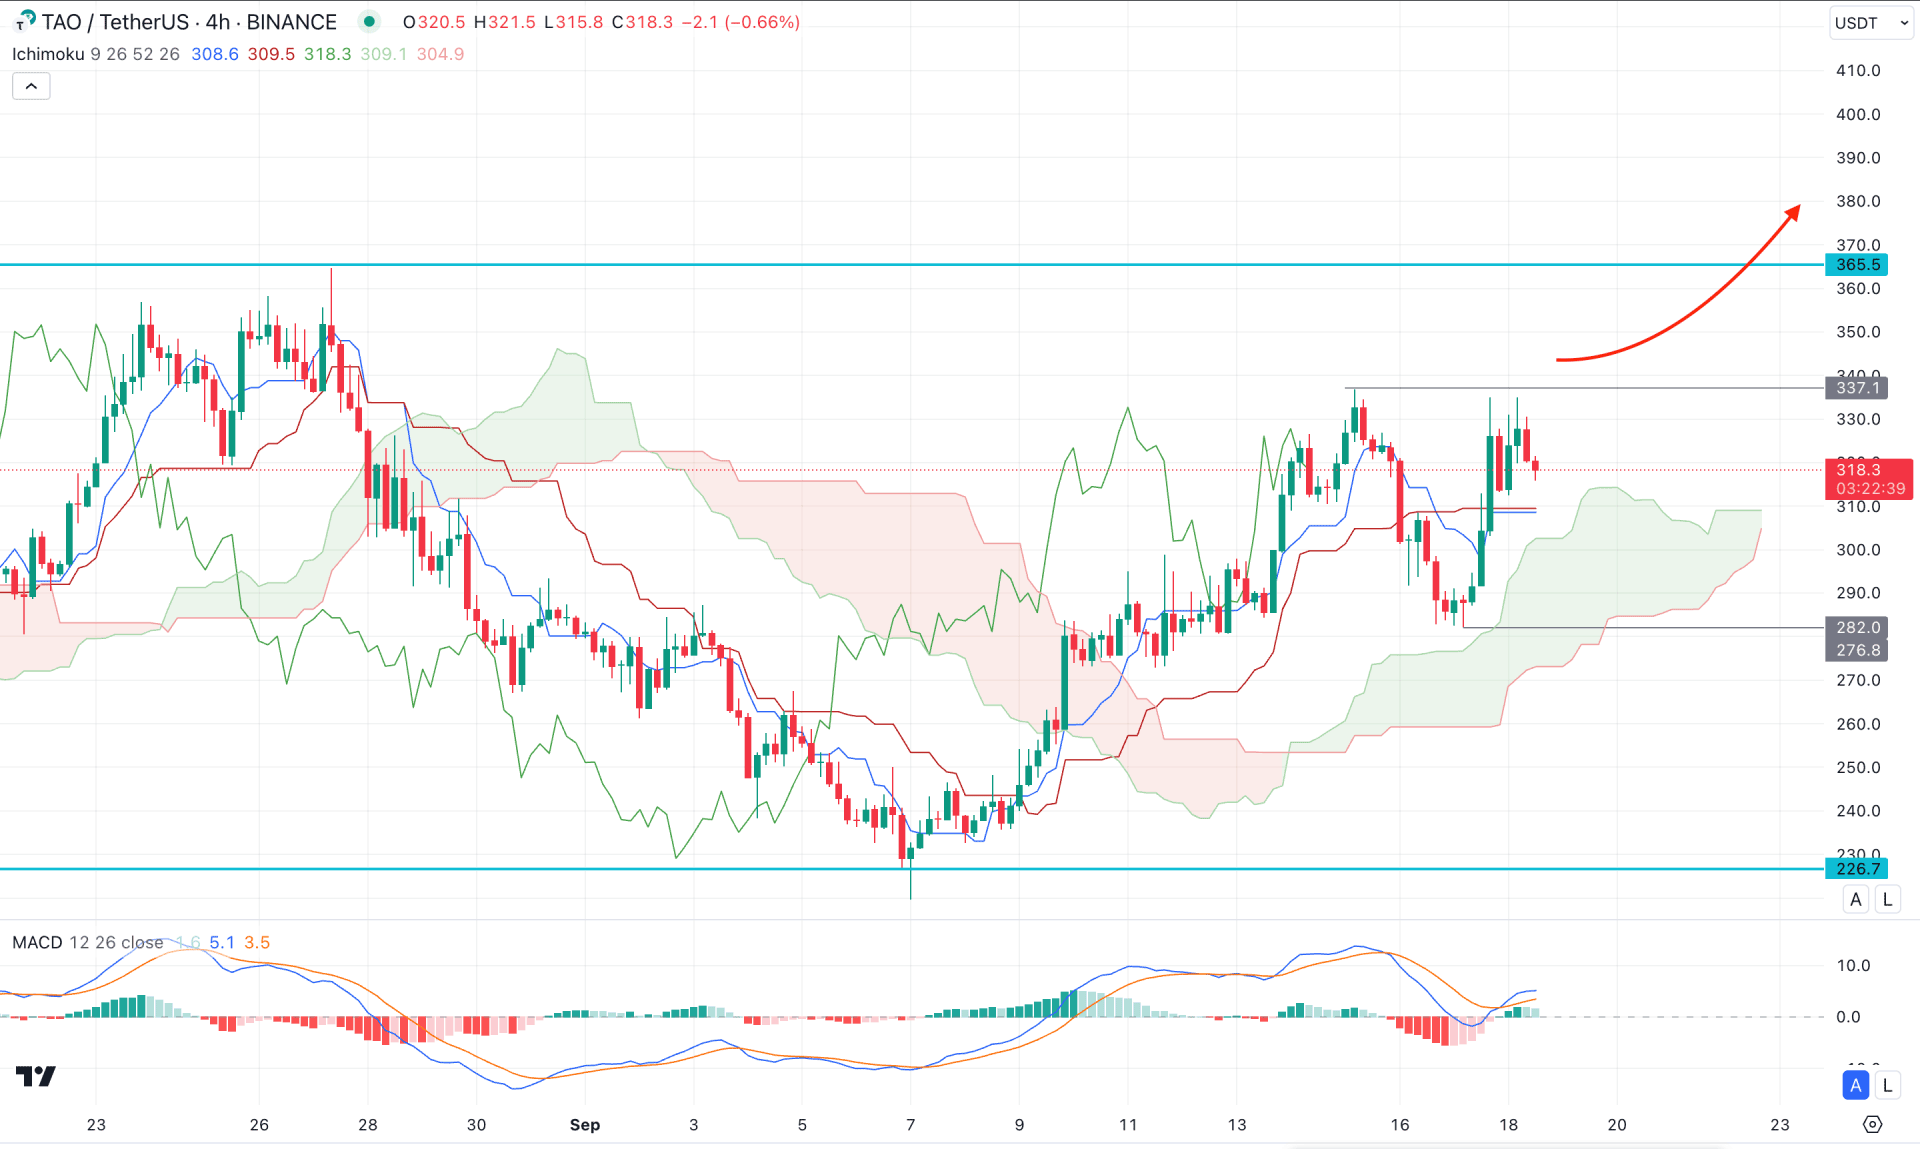
In the H4 timeframe, the current TAOUSD price is trading within a bullish momentum as the recent price hovers above the crucial Cloud support for a considerable time. Moreover, the recent bullish rebound with an U-shape recovery signals a possible upward breakout from the near-term resistance.
In the futures cloud, the recent Senkou Span A is above the Senkou Span B, following the major trend.
The MACD indicator shows a mixed sentiment, where the current Histogram is closer to the neutral point, while a bullish crossover is present in the signal lines.
Based on the current H4 structure, a valid bullish break with an H4 close above the 337.10 high could be a probable long opportunity, aiming for the 365.50 level. Moreover, a stable price above the near-term resistance might extend the upward pressure at the 400.00 psychological line.
On the bearish side, investors should closely monitor the near-term price action as any immediate downside pressure below the 282.00 level might invalidate the buying pressure and lower the price towards the 220.00 area.

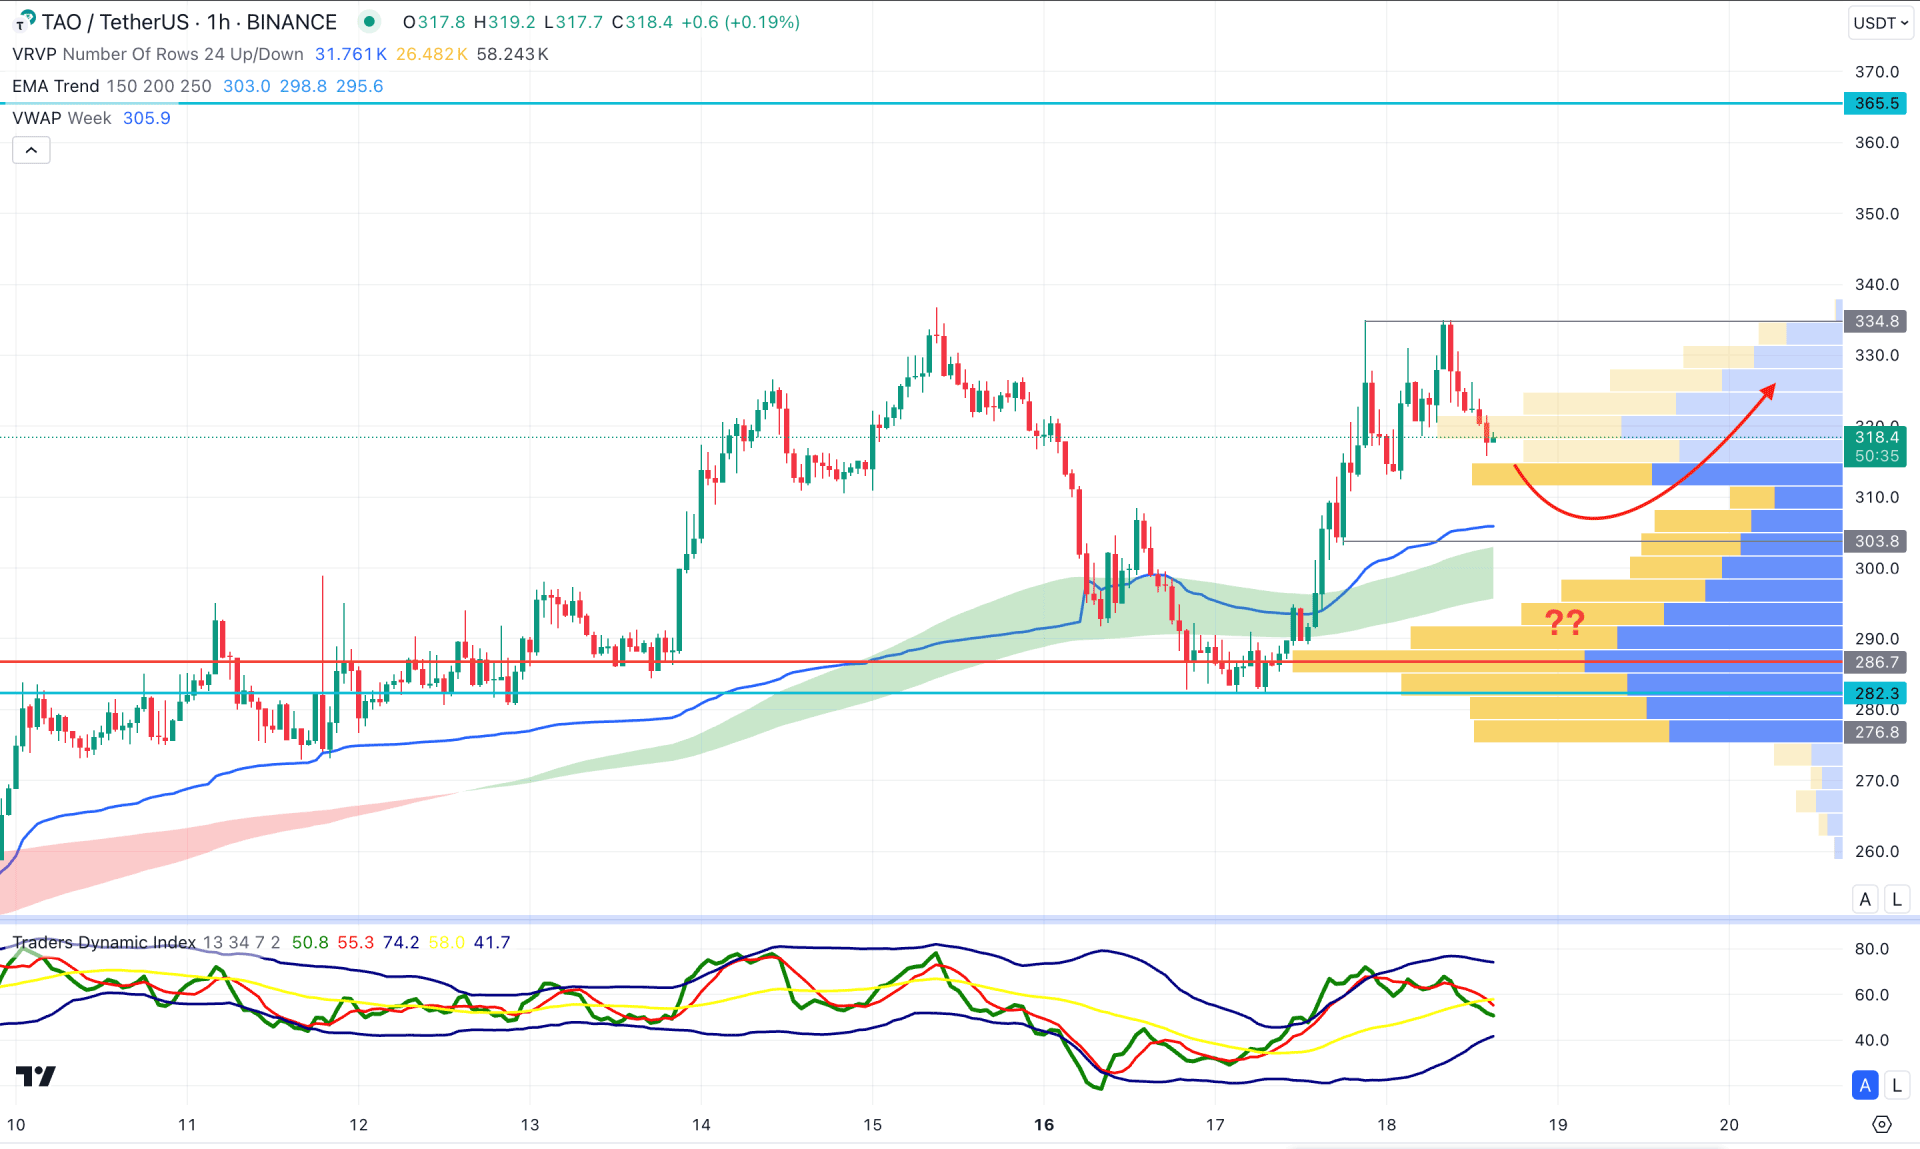
In the hourly time frame, the TAO/USDT is trading below the intraday resistance of 334.80 level with a double top formation. However, the visible range high volume line and MA wave are below the current price with an upward slope. It is a sign that the major market trend remains bullish, where a minor downside correction is pending as a mean reversion.
In the indicator window, the current TDI line is hovering at the 50.00 line after rebounding from the overbought level.
Based on this structure, the price might extend the downside pressure and find support from the MA wave. In that case, a valid bullish rebound from the 303.80 to 290.00 area could offer a long opportunity, aiming for the 360.00 level.
Based on the current multi-timeframe outlook, TAO/USDT is more likely to initiate the long-term bullish wave after validating the bullish breakout from the near-term resistance. As a downside correction is pending in the intraday price, investors might find a decent long signal from the discounted price with proper validation.