Published: May 26th, 2026
Bittensor (TAO) is a distributed, blockchain-driven machine learning network, where machine learning models receive recognition based on the aggregate informational value they provide during collaborative training. Additionally, TAO provides external access, enabling users to take data from the network and customise its operations to suit their requirements.
Machine learning models can be trained in a cooperative setting via a decentralised network using Bittensor's open-source protocol. In order to ensure that those who contribute to the network's expertise are paid appropriately, this cooperative training is rewarded depending on the informational value given.
The price of the native token TAO faced selling pressure as soon as Sam Dare, the CEO of Covenant AI, announced the project's separation from Bittensor.
Dare charged Bittensor CEO Jacob Steeves (also referred to online as "Const") of maintaining unchecked authority over a network that purports to be decentralised in his statement.
Let's see the further outlook from the TAO multi-timeframe analysis:
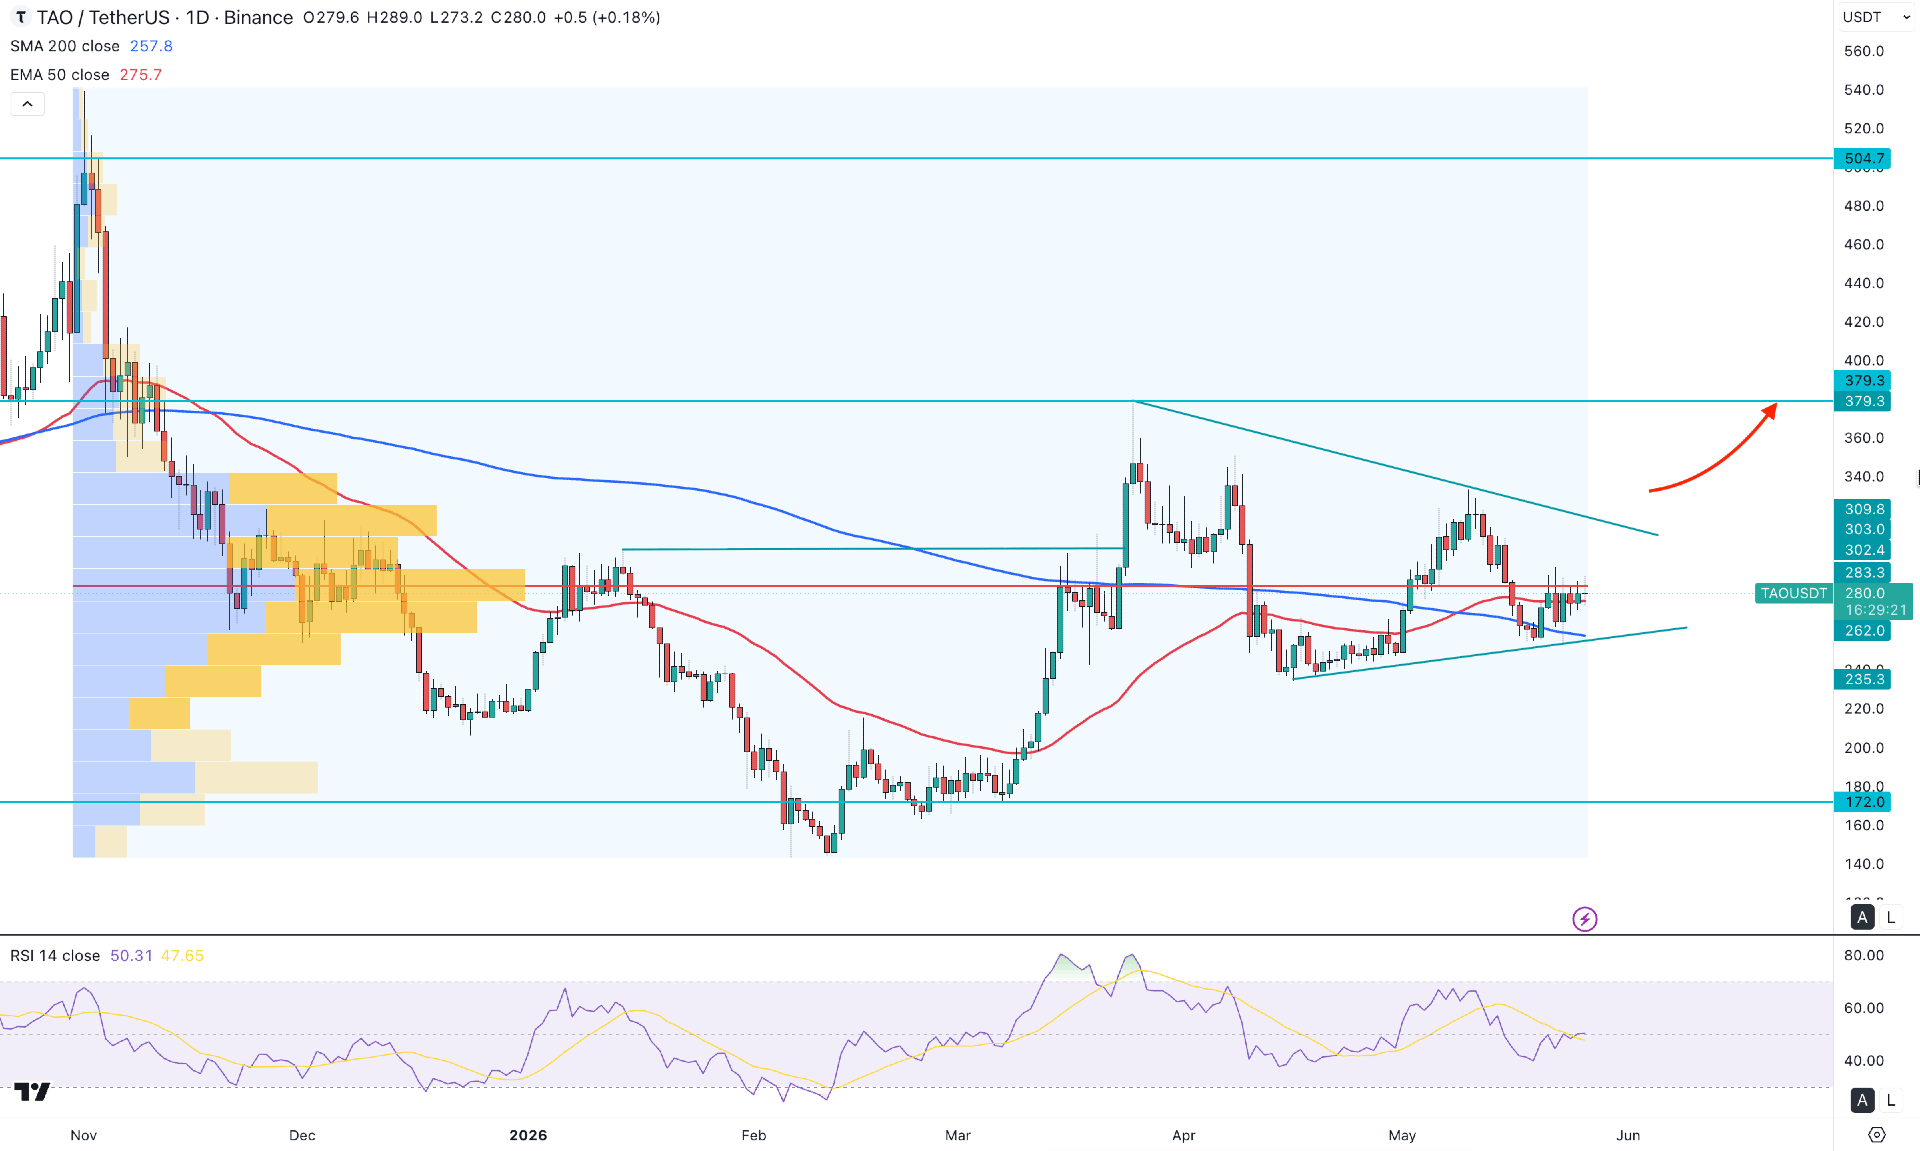
In the daily chart of TAO/USDT, a valid bullish bounce is seen from the February 2026 low, creating a new swing high above the 302.30 level. Later on, the price went sideways instead of forming an immediate pump and dump, which signals buying interest in the market.
Looking at the higher timeframe, the monthly candle suggests a sideways market momentum where the current price is trading within the body of a bullish inside bar candlestick. In that case, breaking above the 308.20 level with a valid monthly close would be a good signal for a bullish inside bar continuation opportunity. Moreover, the weekly timeframe remains sideways, where the recent price is holding the pressure below the 261.00 weekly support level.
In terms of volume, the price is trading within the consolidation zone, where the most active level since November 2025 is marked at 283.70, which is just below the current price.
The sideways market is also visible from the main price chart, where the 200-day SMA and 50-day EMA are closer together. Moreover, the recent price rebounded from the 200-day SMA and is currently hovering above the 50-day EMA, which creates a bullish continuation possibility.
In the Relative Strength Index, the current line is operating at the 50.00 neutral level, which came after forming a bullish rebound from the 40.00 area. The Average Directional Index rebounded and moved below the 20.00 satisfactory line, creating a need for a rebound before forming a valid market trend.
Overall, the TAO/USDT is trading within a pre-breakout structure at the current price pattern. The immediate barrier to look at is the 332.60 resistance level before heading towards the 379.30 key resistance level.
On the other hand, the sideways market could extend and find support from the 200 SMA at any time. In that case, a break below the 200-day SMA with a new swing low below the 233.90 level could increase the possibility of grabbing the liquidity from the 172.00 area.
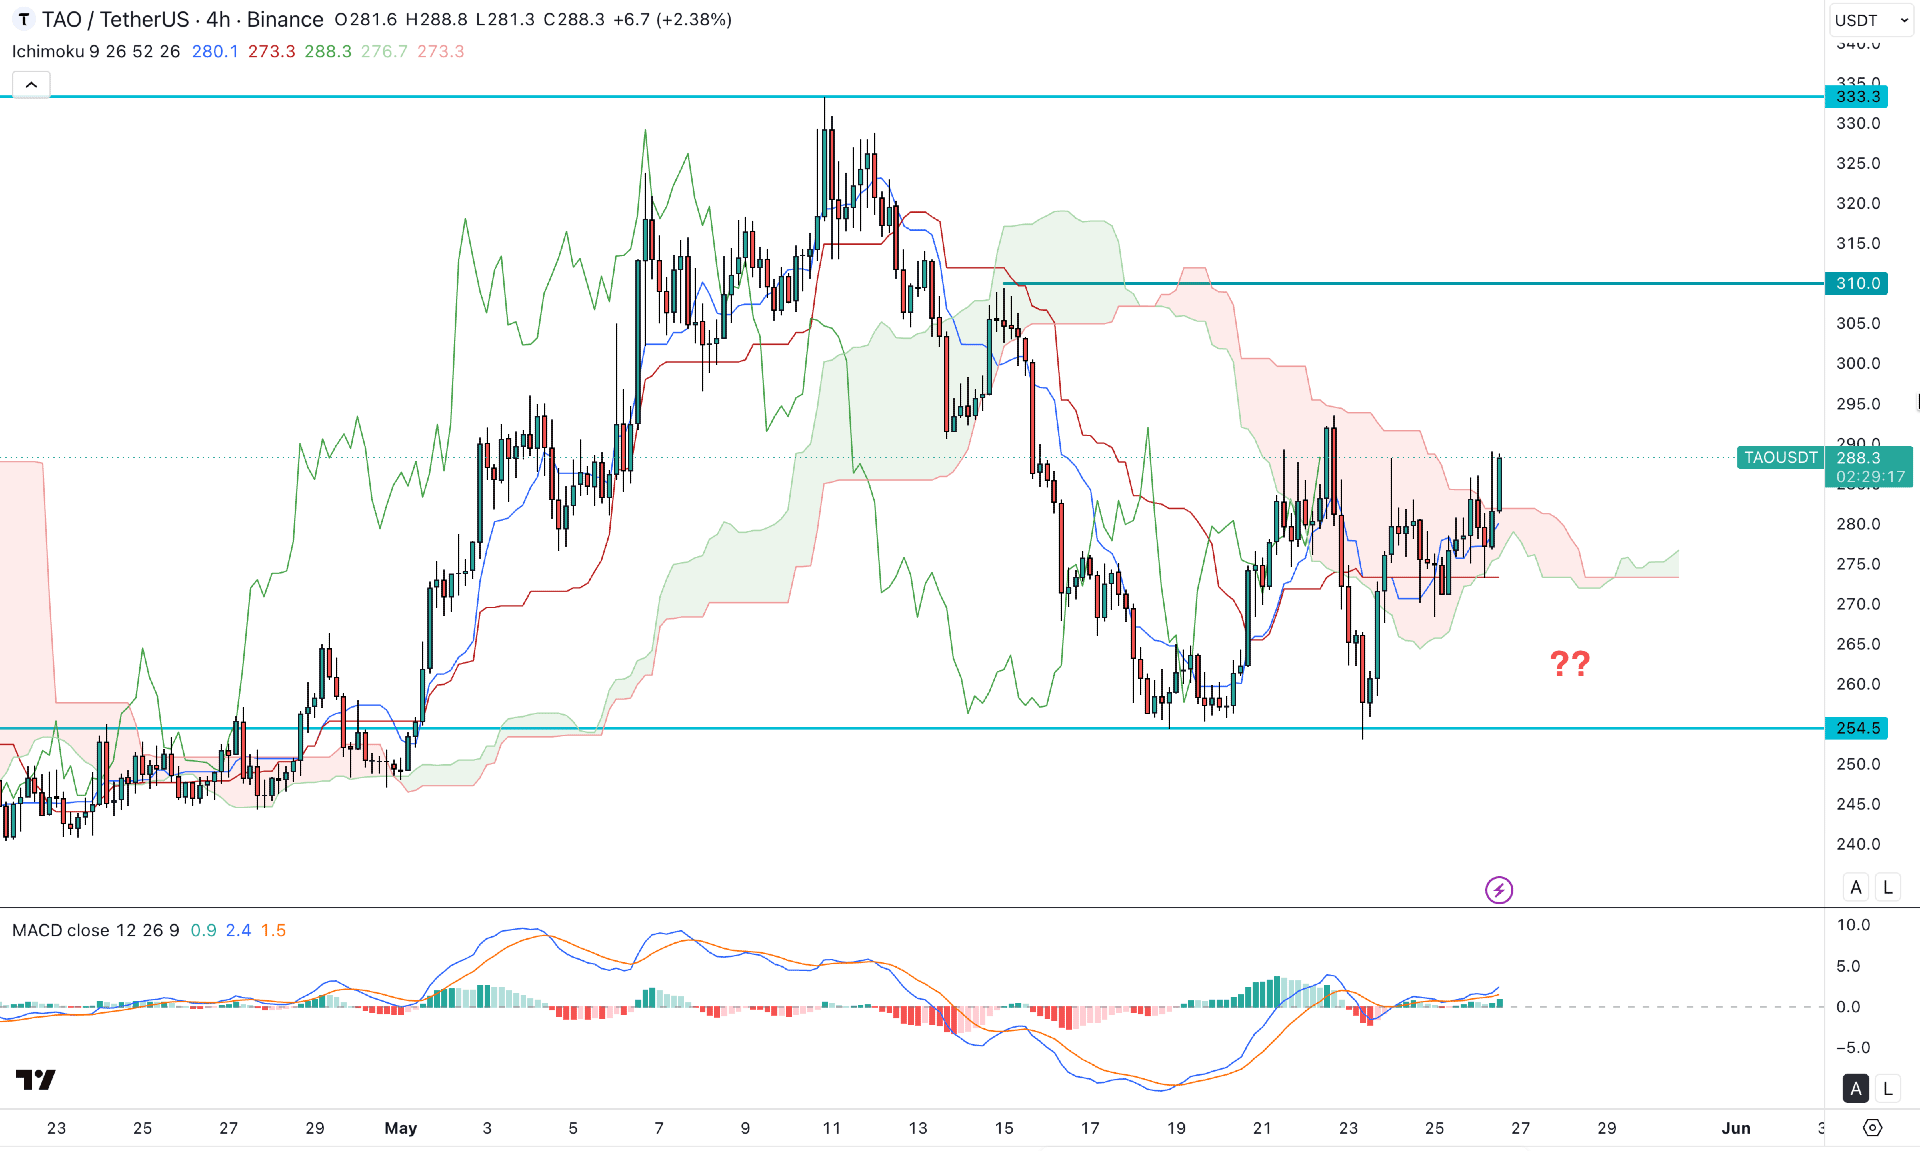
In the four-hour timeframe, the recent price shows a valid bullish reversal from the 254.50 support level, but failed to overcome the cloud area. As a result, a rebound is seen with a liquidity sweep from the support area, signalling a bullish breakout possibility. As the current price is hovering above the cloud support, the price is likely to extend the buying pressure following the existing liquidity grab.
In the future cloud, both lines are heading upwards; the dynamic lines are closer to the current price and working as an immediate support.
In the secondary indicator window, the MACD histogram remains above the neutral line for a considerable time, while the signal line is having an upward movement above the neutral area.
Based on this market outlook, the bullish possibility is valid as long as the price remains above the dynamic cloud support level. The immediate resistance is at the 310.00 level, and overcoming this line could open the room for moving beyond the 333.30 level.
On the other hand, a failure to hold the buying pressure above the cloud support signals a deeper discount at the 250.00 area.
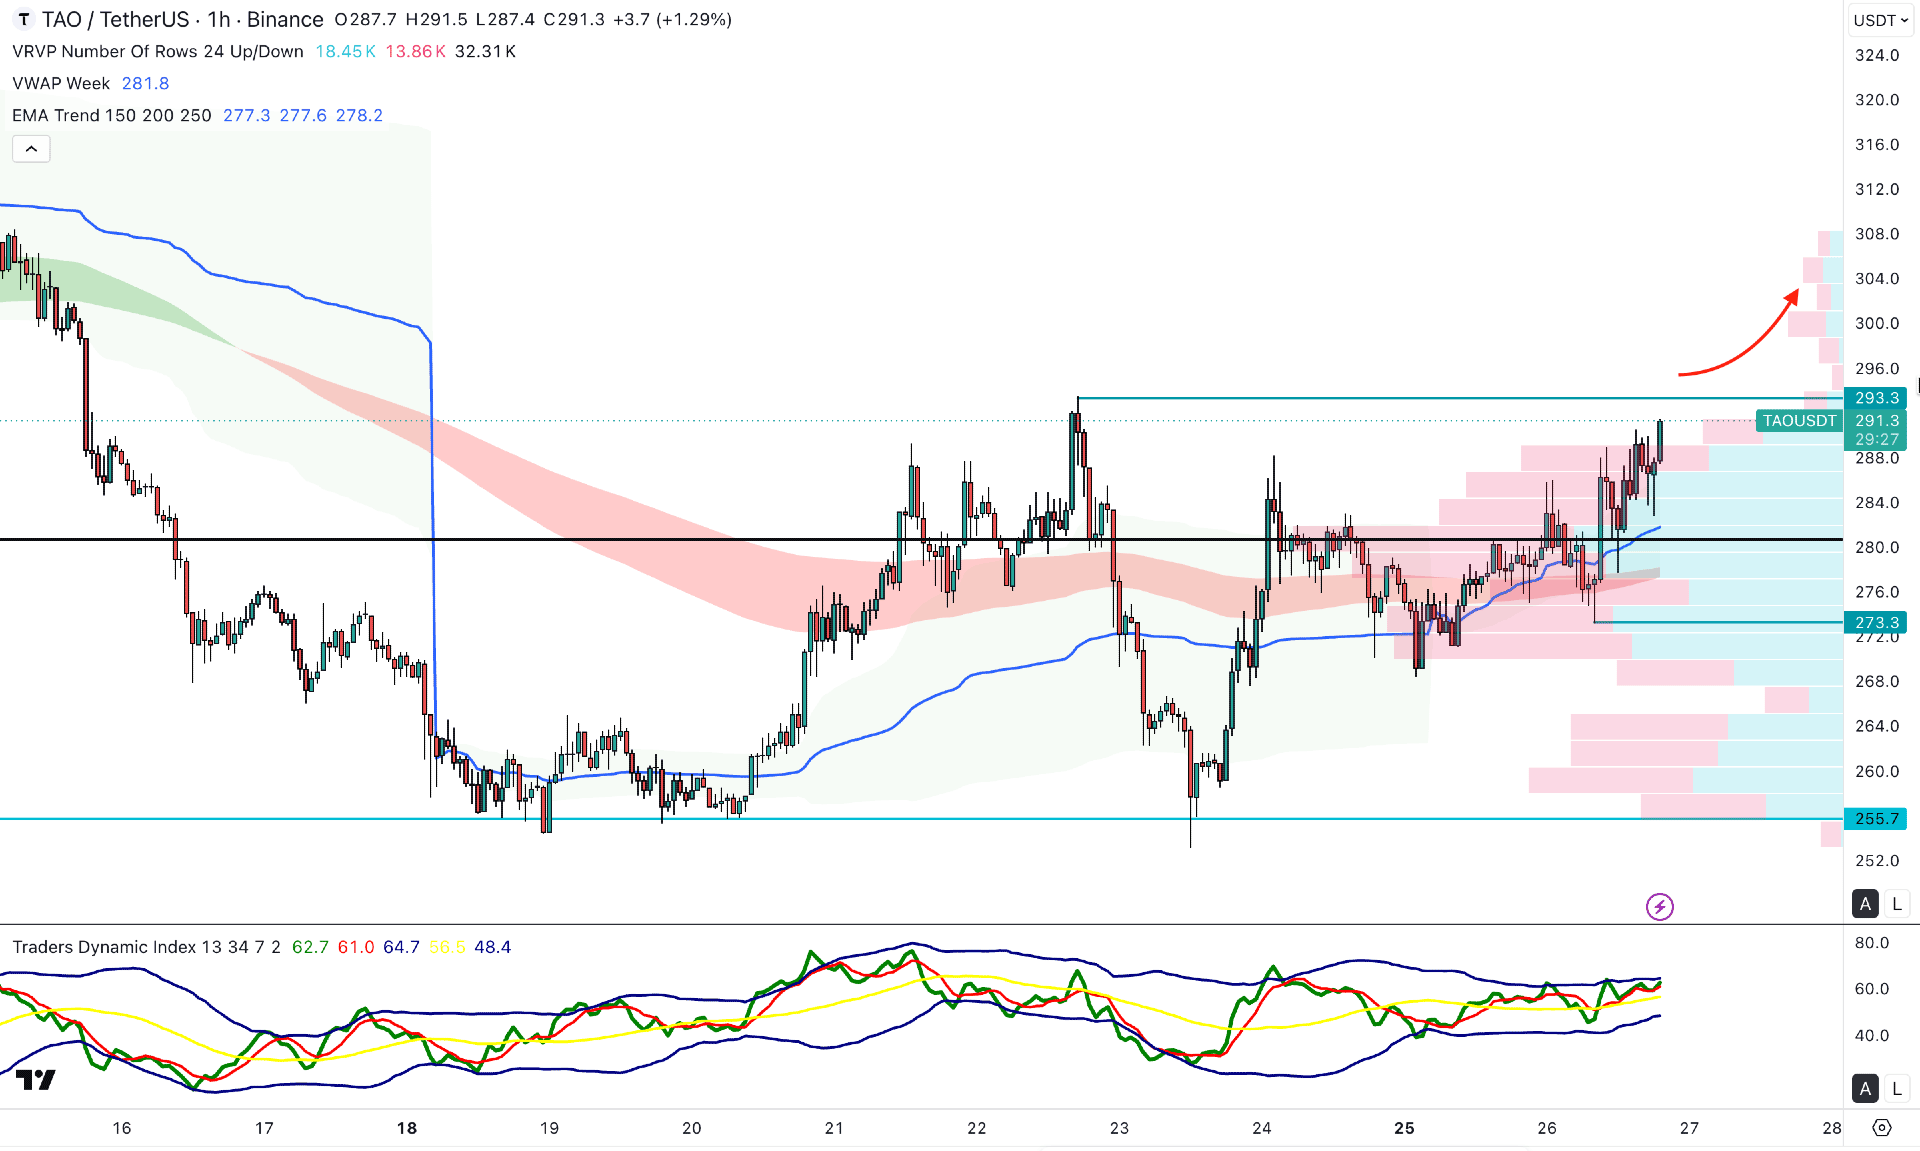
In the hourly timeframe, the recent price shows a strong bullish recovery, suggesting a potential buying pressure in the intraday market. The weekly VWAP level is below the current price with a bullish slope, suggesting active buying pressure.
Moreover, the Exponential Moving Average wave is below the current price, which is in line with the intraday high volume level. The Traders Dynamic Index shows a different story, where the current TDI line is at a bullish peak, suggesting an extreme bullish condition.
Based on the hourly market structure, the price is trading at a bullish premium zone, where a breakout above the 293.30 level could open the room for moving towards the 320.00 area.
The alternative trading approach is to find an immediate bearish break with a recovery below the weekly VWAP line. In that case, a break below the 273.30 support level could increase the possibility of testing the 255.70 level.
Based on the overall market outlook, TAO/USDT is trading within a bullish breakout structure, where more confirmations are needed before heading for a long-term bullish wave. The market is strongly bullish, but the higher timeframe needs more confirmation from the trendline breakout. Investors might expect a minor pullback pressure from the intraday chart, but a confirmed pattern breakout will validate the long-term bullish opportunity.


