Published: March 19th, 2024
This week, central banks' meetings will be in focus as the Bank of Japan, Federal Reserve, Bank of England, and Swiss National Bank will meet with monetary policies and interest rate decisions. These decisions are anticipated to have far-reaching consequences for many financial assets, including cryptocurrencies.
Another significant occasion approaching is Nvidia's AI Conference, expected to be attended by several of the world's most prominent corporations. Several cryptocurrency companies will also be involved, highlighting the robust correlation between advancements in artificial intelligence and the performance of AI-related tokens such as Bittensor (TAO).
Bittensor (TAO) is an open-source protocol that enables a decentralized machine-learning network based on blockchain technology. Machine learning models collaborate within this network and are compensated in TAO according to the combined value they contribute.
The aim of this project is to establish an open-source repository for machine intelligence, which will foster permissionless and transparent innovation worldwide. Additionally, they will ensure that rewards and network ownership are distributed equitably in proportion to the contributions made by users.
If you are keen to expand your crypto trading portfolio, this token would be a great choice.
Let's see the upcoming price direction of this instrument from the TAO/USDT technical analysis:
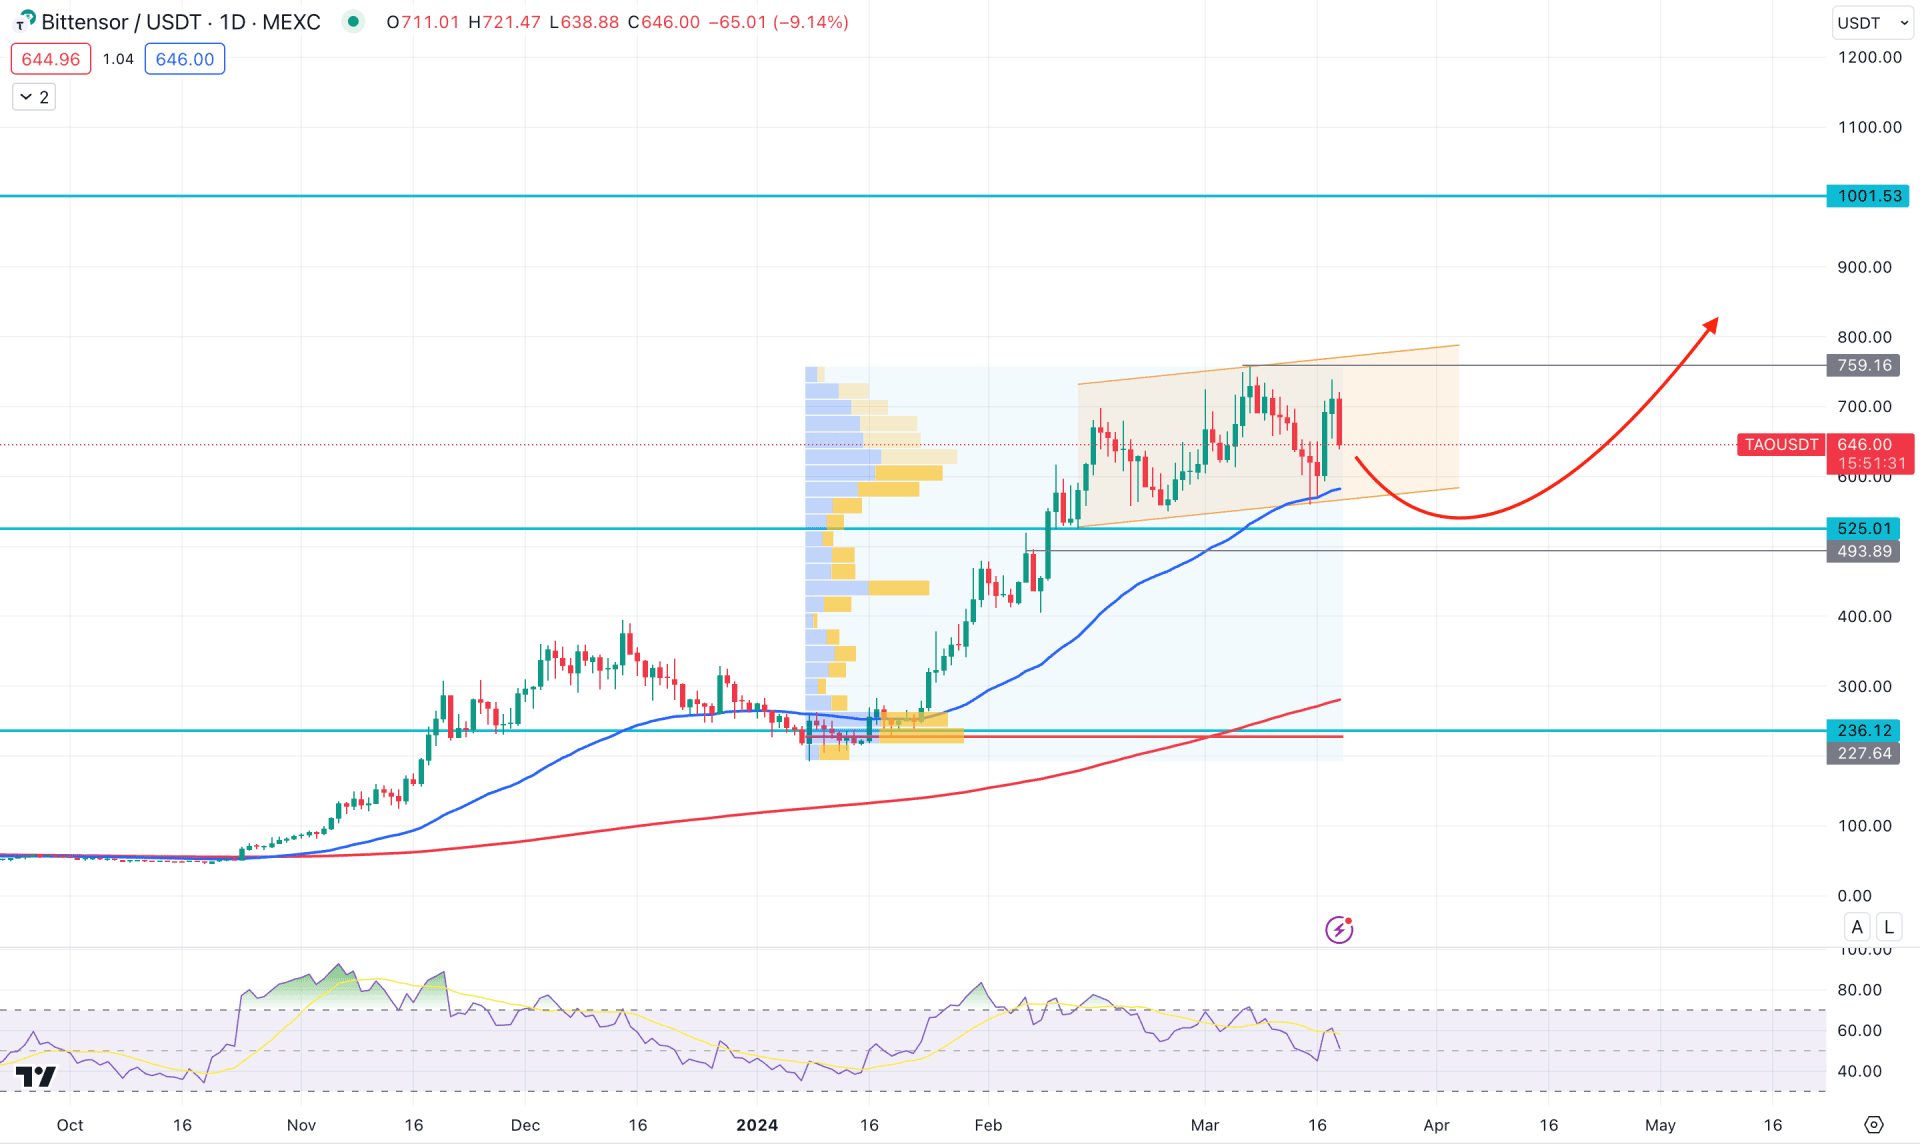
In the daily chart of TAO/USDT, the ongoing buying pressure is potent, where the current price trades within an ascending channel formation. Despite the corrective pressure after setting a top to the 759.16 level, the price showed no sign of a bearish reversal. In that case, investors should monitor how the price reacts in the near-term support area as a strong break could indicate a possible trend reversal.
In the higher timeframe, the overall market structure is still bullish as the current price trades above the last month's closing price. However, volatility is seen in the weekly chart, where the latest candle trades bearish after a Doji formation. Based on the higher timeframe, investors need a valid breakout with a confirmation from the lower timeframe before opening a position.
In the volume structure, the most significant level since the opening of 2024 is at 227.64 level, which is below the current price. Moreover, the gap between the current price and the high volume level has expanded, which indicates a possible downside correction as a mean reversion.
In the daily chart, the 50-day Exponential Moving Average is the immediate support, which is carrying the price from the channel support. Moreover, the 525.01 level is the next static level to look at, which is another bullish factor for this instrument. Therefore, as long as the current price trades above these levels, we may expect bulls to regain the momentum at any time.
Based on the daily outlook of TAO/USDT, a minor downside correction and a valid bullish rejection from the 600.00 to 490.00 zone could be a long opportunity, targeting the 1000.00 psychological level.
The alternative trading approach is to look for a bearish pressure below the 490.00 level. A valid bearish daily close below this line would be the first sign of a possible downside pressure towards the 236.12 static level.
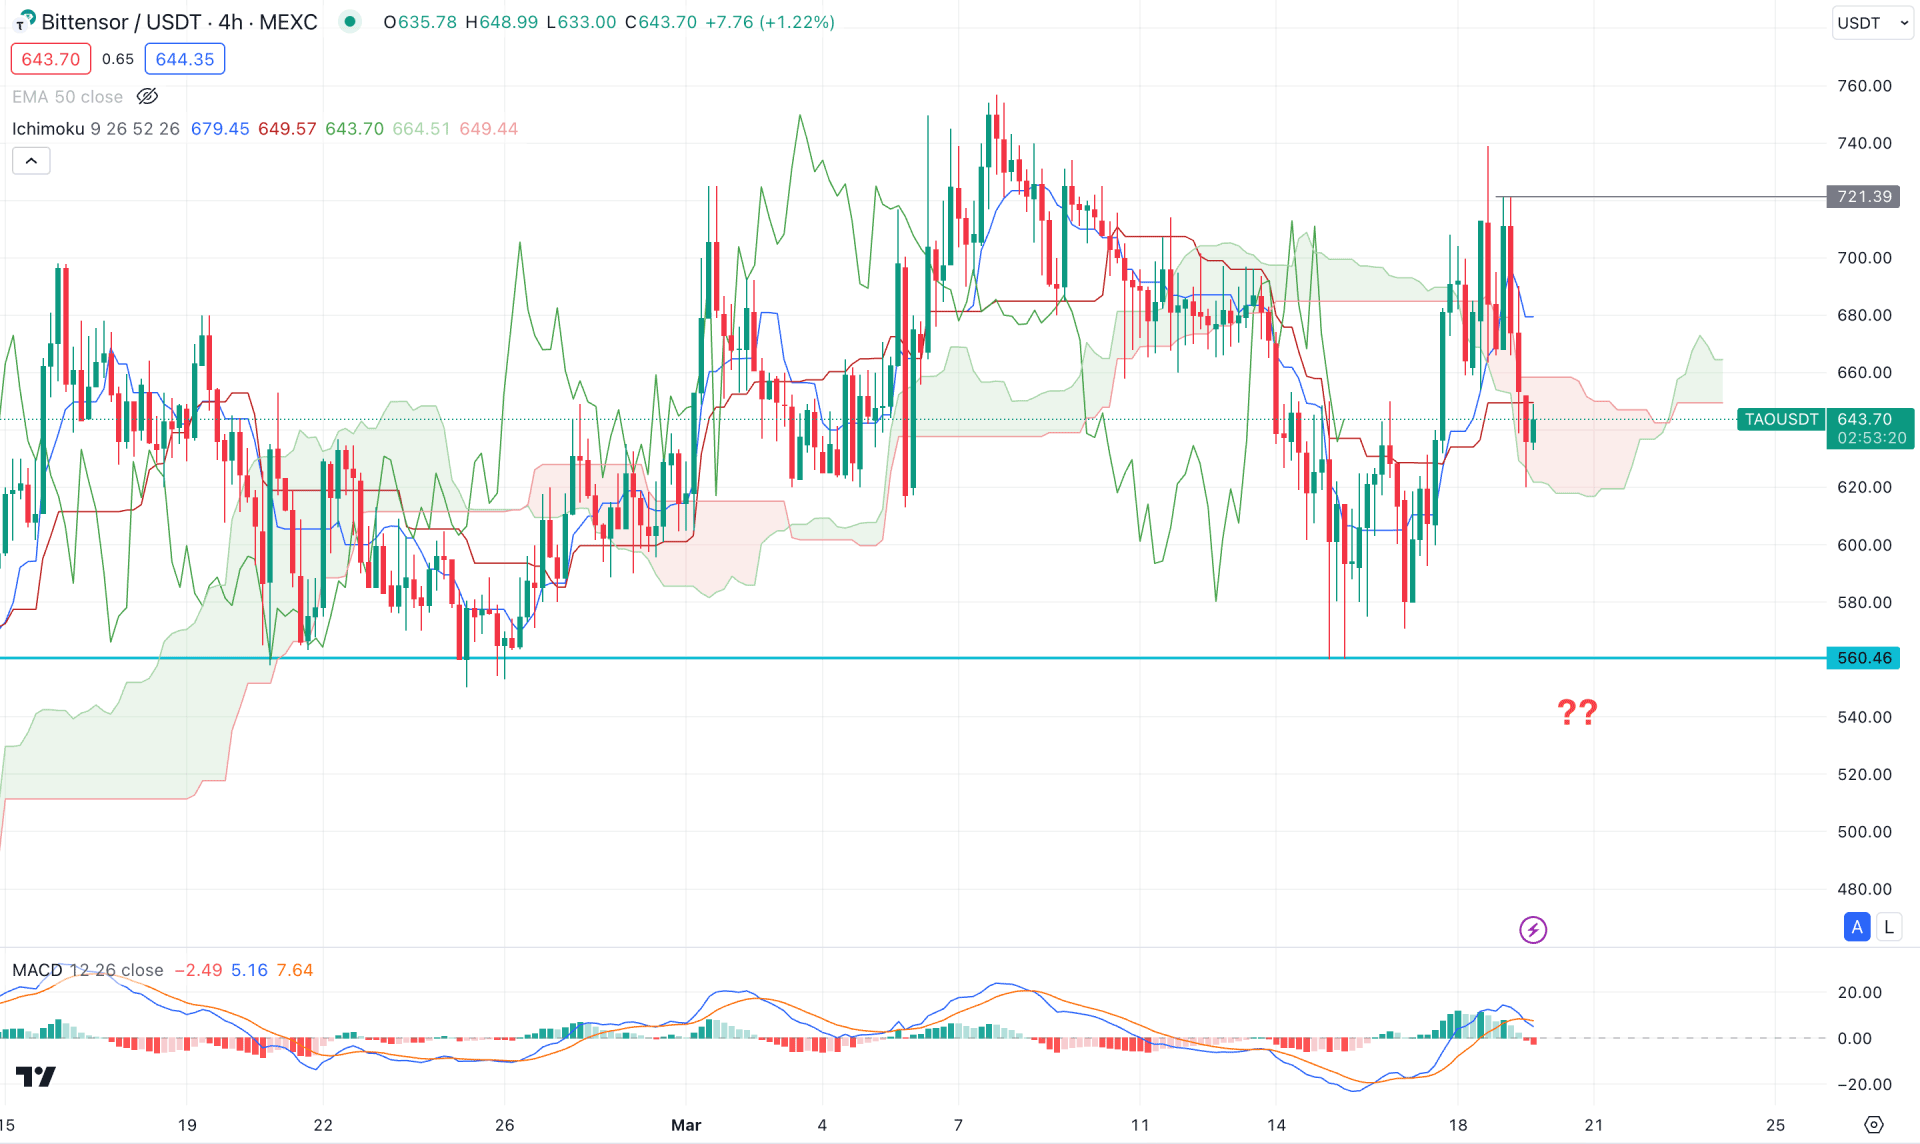
In the H4 timeframe, the ongoing price action is volatile as the recent price remained sideways at the Cloud zone. Moreover, multiple violations are seen from dynamic levels, which indicates a potential uncertainty in the market.
In the future cloud, the Senkou Span A and B remained bullish, while the dynamic Kijun was the immediate resistance. As a downside pressure is visible at the Kijun sen level, investors should monitor how the price holds the bearish pressure below this line.
In the secondary window, the MACD Histogram turned bearish while the Signal line formed a crossover above the neutral line.
Based on the H4 structure, TAO/USDT has a higher possibility of forming a stable trend after having a proper breakout. As the recent price hovers below the dynamic Kijun Sen line, a continuation with an H4 candle below the cloud support could be a bearish signal, targeting the 500.00 level.
On the other hand, the long-term market trend is still bullish, where the weekly range extension might provide an early sign in the H4 chart. A bullish rebond above the Kijun Sen line with an H4 close could be a potential long opportunity, targeting the 750.00 level.
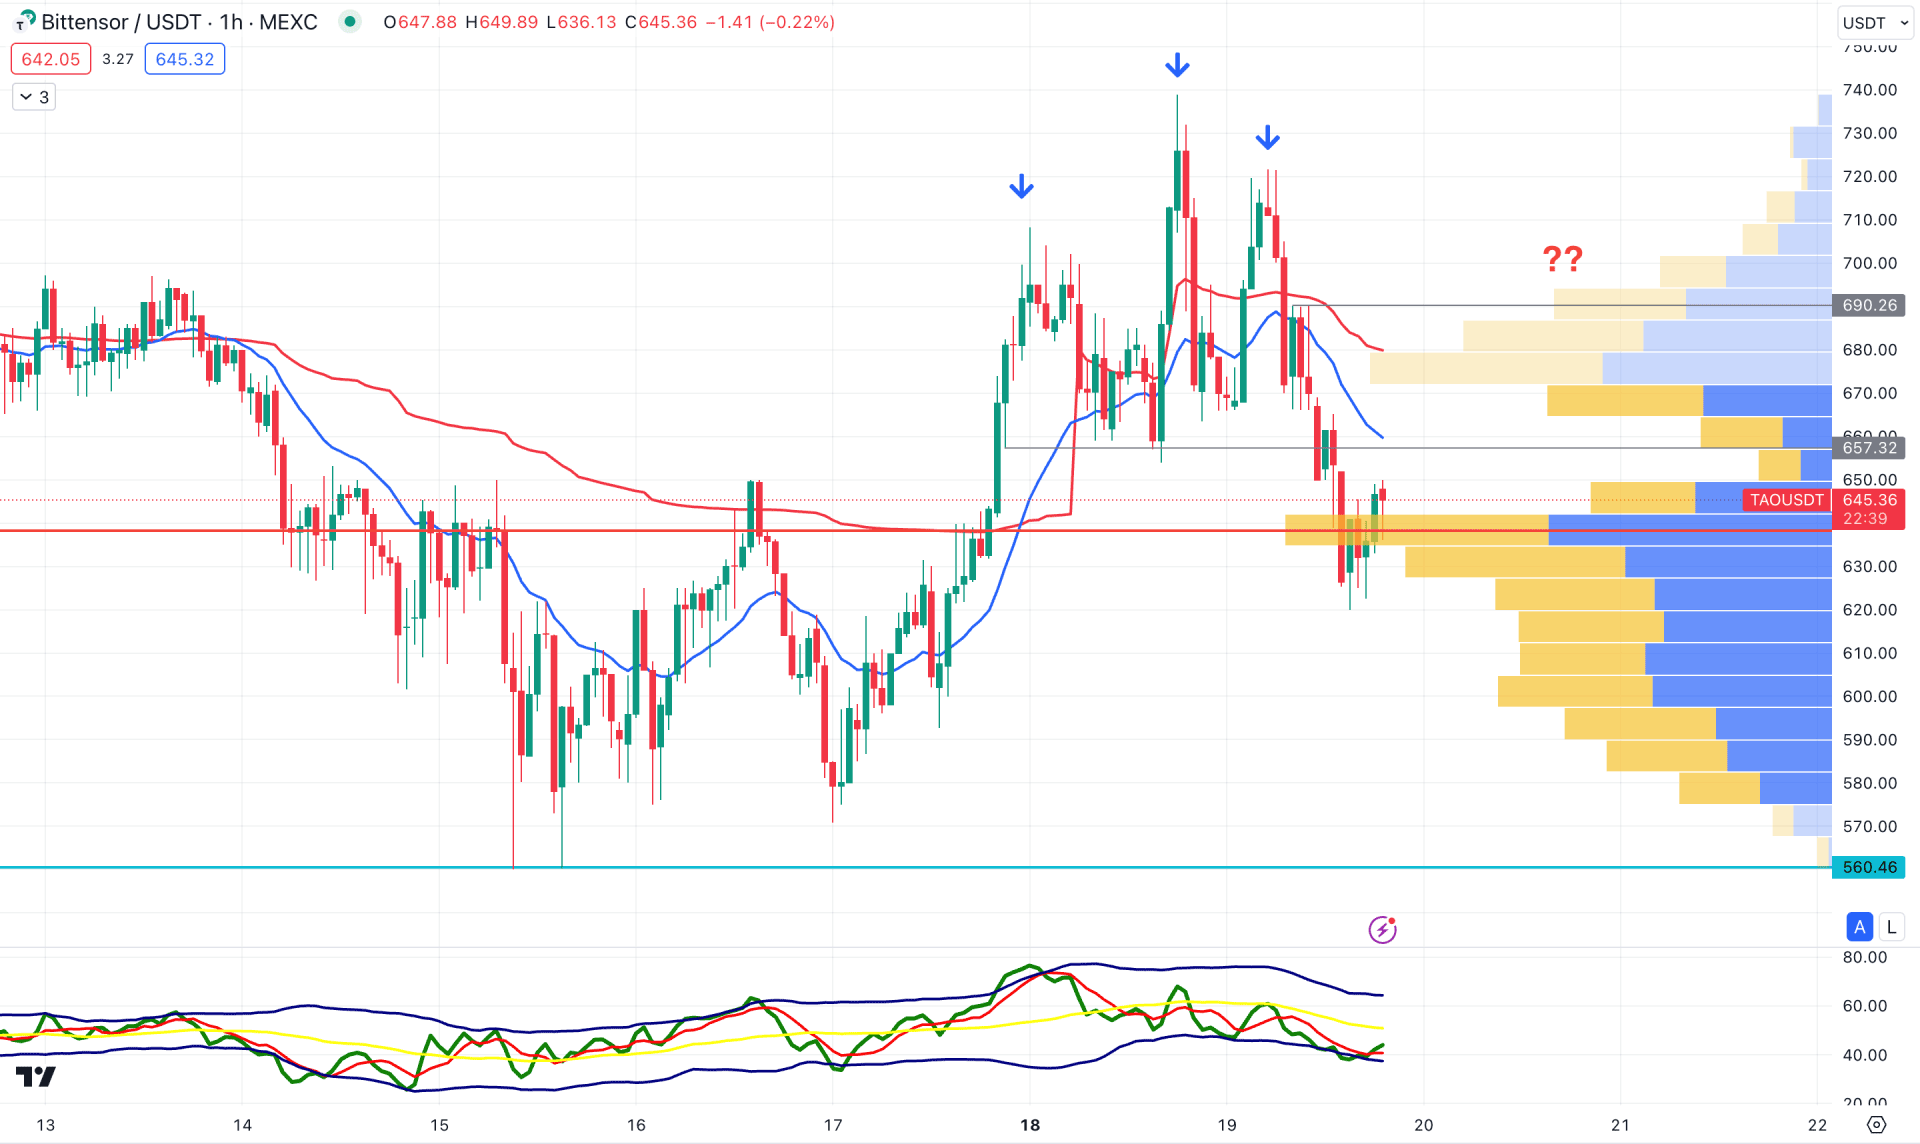
In the H1 chart, the ongoing selling pressure is present in the TAO/USDT price, which could be an early sign of a bearish range breakout formed in the daily price.
A potential Head and Shoulders pattern is visible in the hourly chart, where the recent price trades below the dynamic 20 EMA. Moreover, the visible range high volume level is at the current price area, which could work as a strong level to look at.
Based on this outlook, the bullish slope in the Traders Dynamic Index (TDI) and with a breakout above the H&S neckline could be a long opportunity. However, the downside pressure is valid as long as the price trades below the dynamic 20 EMA level, which could lower the price towards the 560.46 level.
Based on the current price action, TAO/USDT has a higher possibility of forming a bearish pressure in the coming days. As the early sign is visible in the hourly chart, investors should closely monitor how the daily price trades at the near-term support line to gauge the breakout possibility.


