
Published: May 20th, 2025
Bitget Token (BGB) is a base token for the distributed Bitget Wallet ecology and the centralized Bitget exchange. It can be used to trade, pay transaction costs, engage in platform operations, and access benefits as a utility token.
Bitget is the driving force behind a group of forward-thinking early adopters committed to a blockchain-powered vision. They have been developing an exchange since 2018 to give consumers the tools by providing a safe, comprehensive cryptocurrency investing platform.
Bitget Token (BGB) distinguishes itself by providing access to a multitude of advantages throughout Bitget's controlled and decentralized ecosystems. Token farming, staking for passive income, early availability of high-potential companies on Bitget Launchpad, cost reductions, and VIP privileges are among the current benefits.
Future use cases include on-chain trade, DeFi apps, fuel costs, and mission airdrop eligibility. Furthermore, BGB offers premium benefits and enhanced services by facilitating discounted payments using Bitget Pay and Card. Thanks to its many applications, BGB improves user experience and increases acceptance within Bitget's ecosystem.
Let's see the future outlook of this coin from the BGB/USDT technical analysis:
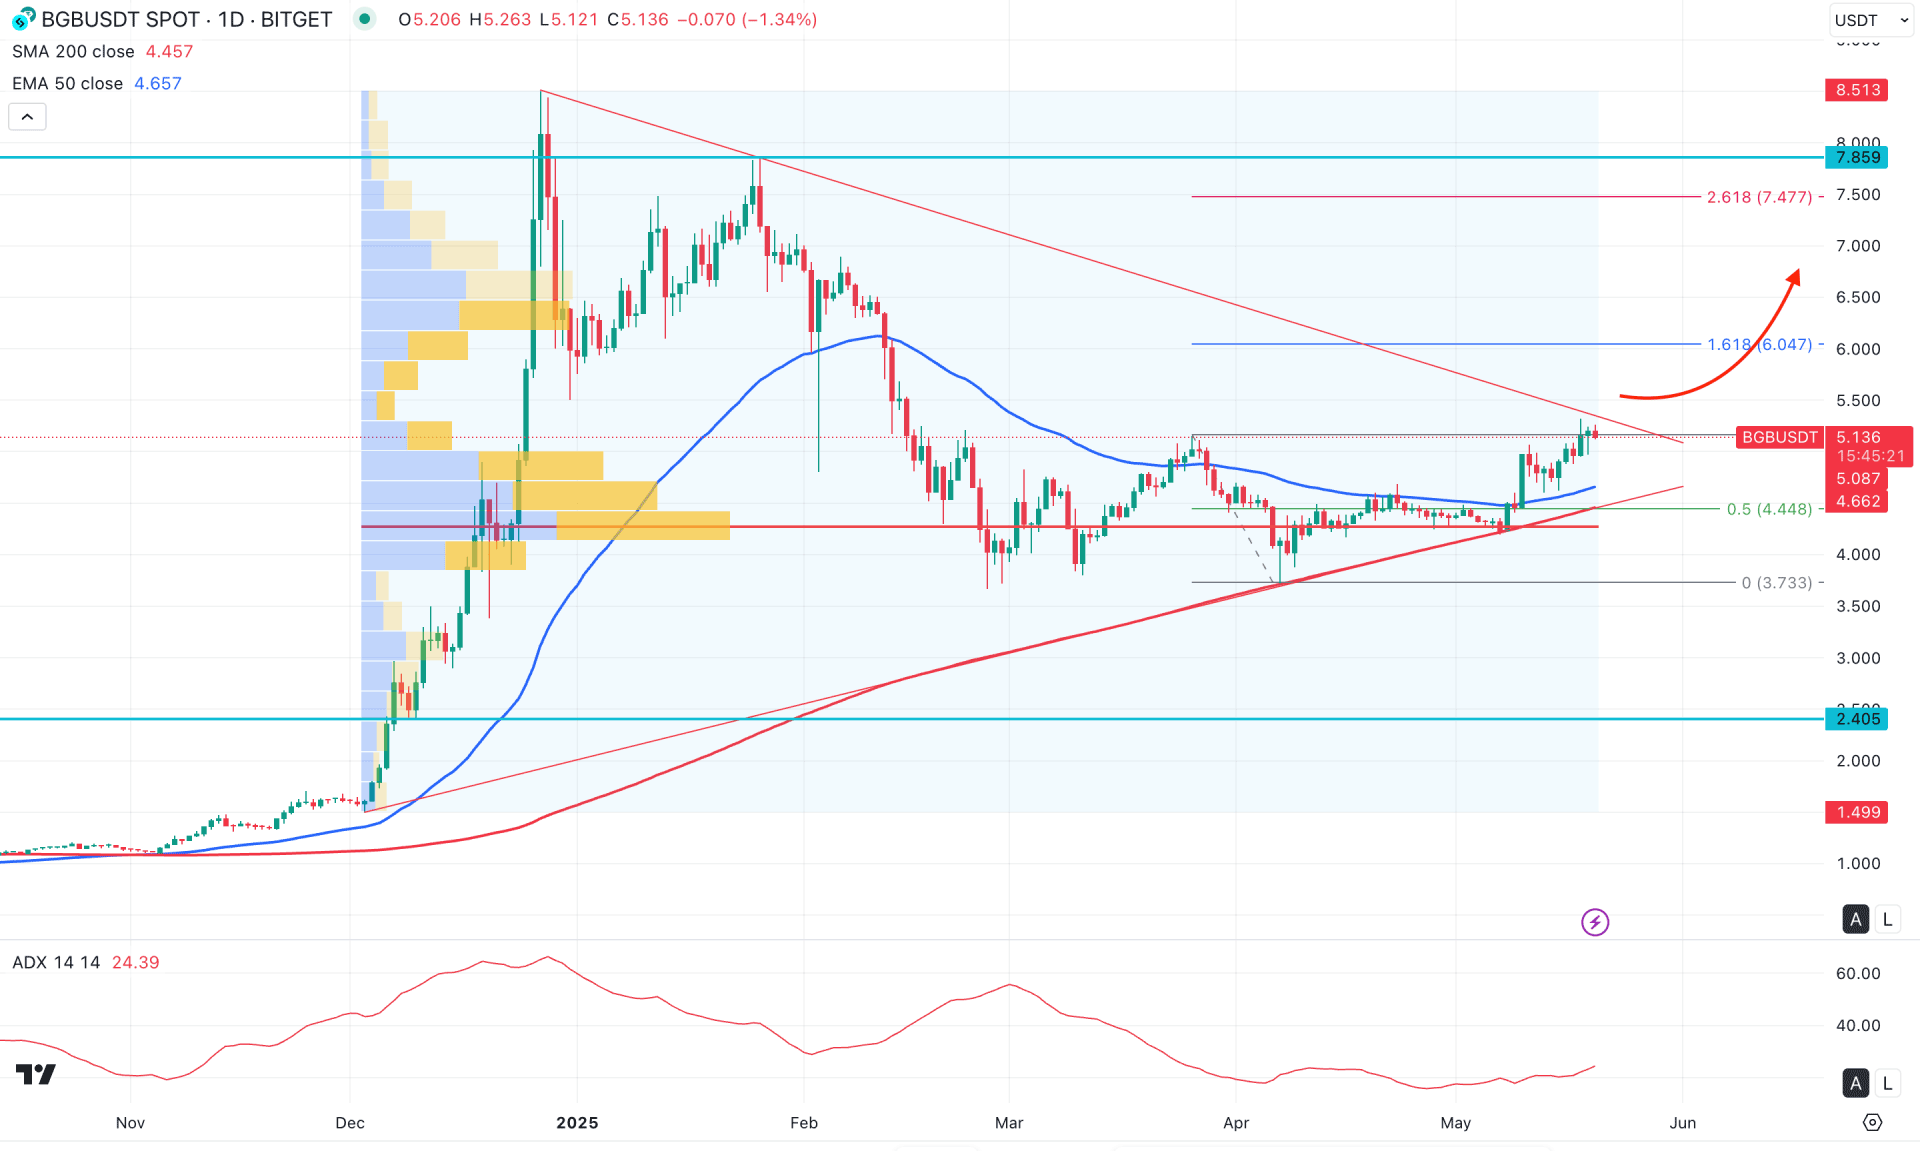
In the daily chart of BGB/USDT, the recent price has been trading sideways after a massive bull run. As a result, the price awaits a breakout from the symmetrical triangle formation, from which a stable trend might emerge.
Looking at the higher timeframe, the monthly candle shows bullish continuation momentum, which came after an inside bar breakout. The weekly price also supports bulls, where a clear rally-base-rally is visible.
On the other hand, the volume looks positive to bulls, as the most active level since December 2024 is below the current price and acting as immediate static support. As long as the high volume line remains below the current price, we may expect the bullish continuation to explode.
The candlestick pattern suggests an upward continuation in the main price chart, as no significant downside recovery is visible from the high volume breakout. As a result, the price has stayed above the 50-day Exponential Moving Average level for 11 consecutive days.
Moreover, the 200-day Simple Moving Average is below the current price and is acting as a significant support level. The indicator window tells a similar story: the current Average Directional Index (ADX) has rebounded from the key 20.00 level. As long as the ADX remains above the 20.00 threshold, we may expect the current market trend to remain stable.
Based on the daily market outlook for BGB/USDT, a triangle breakout with consolidation above the current triangle resistance could present a decent long opportunity. As volume and dynamic levels support the buying pressure, investors might look for a long setup targeting the 161.8% Fibonacci extension level. Moreover, breaking above this level would likely extend the buying pressure and potentially lead to a new all-time high.
Meanwhile, price is currently testing the triangle resistance. A side-by-side liquidity sweep and strong order grab from this level could push the price back toward the triangle support. However, a break below the 200-day Simple Moving Average followed by consolidation would be a strong signal for a short-term bearish opportunity, targeting the 2.5000 area.
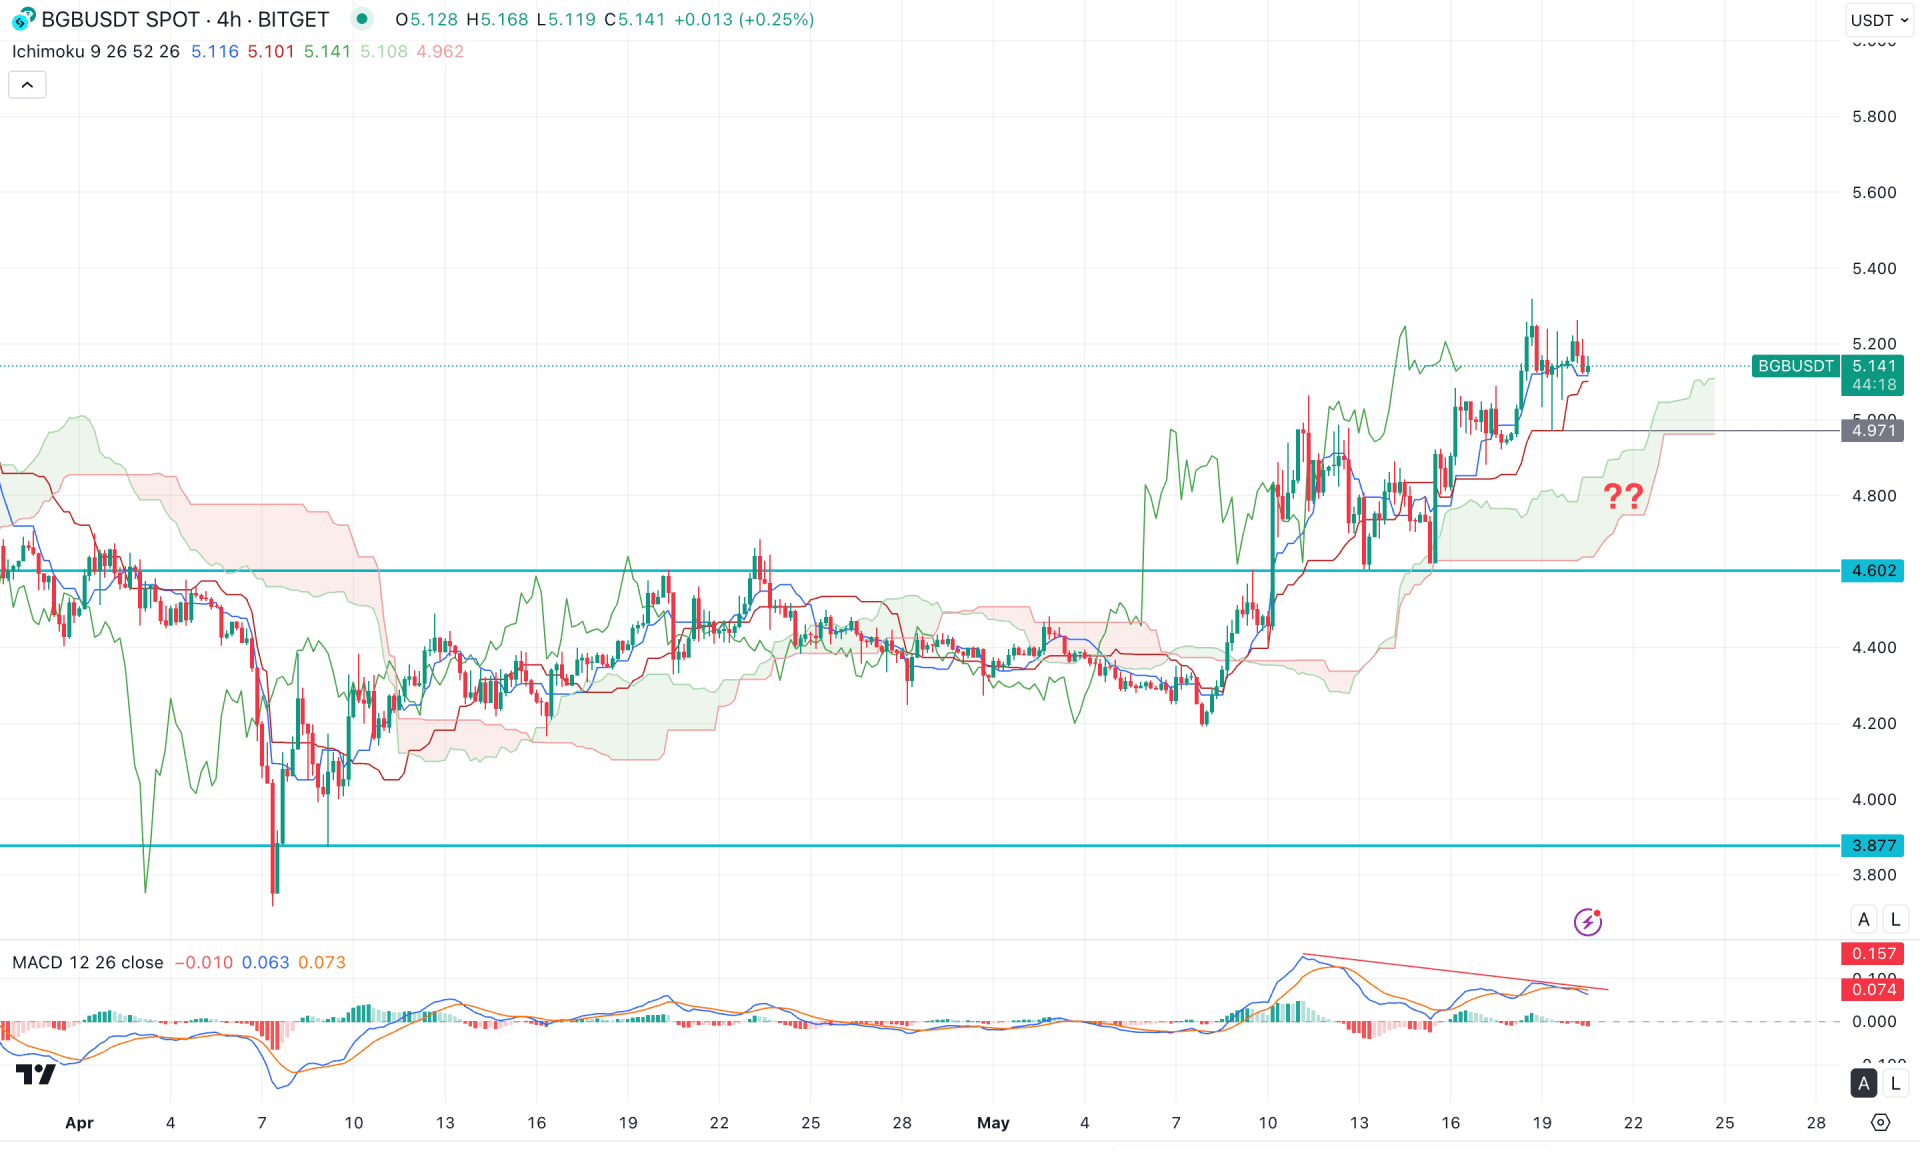
In the 4-hour timeframe, the recent price shows a strong bullish pressure supported by the rising Ichimoku Cloud zone. As a result, the Future Cloud has flipped the position where the Senkou Span A is above the Senkou Span B.
In the secondary indicator window, the MACD Histogram has failed to follow the momentum as the current vertical lines are heading lower, creating divergence. Moreover, the Signal line has flipped the position from the top with a bearish crossover.
Based on the current market outlook, the bullish possibility is limited due to ongoing divergence pressure. In that case, a bearish price action below the 4.971 support level could be a short-term bearish opportunity. However, a rebound is possible as long as the Ichimoku Cloud zone is protected.
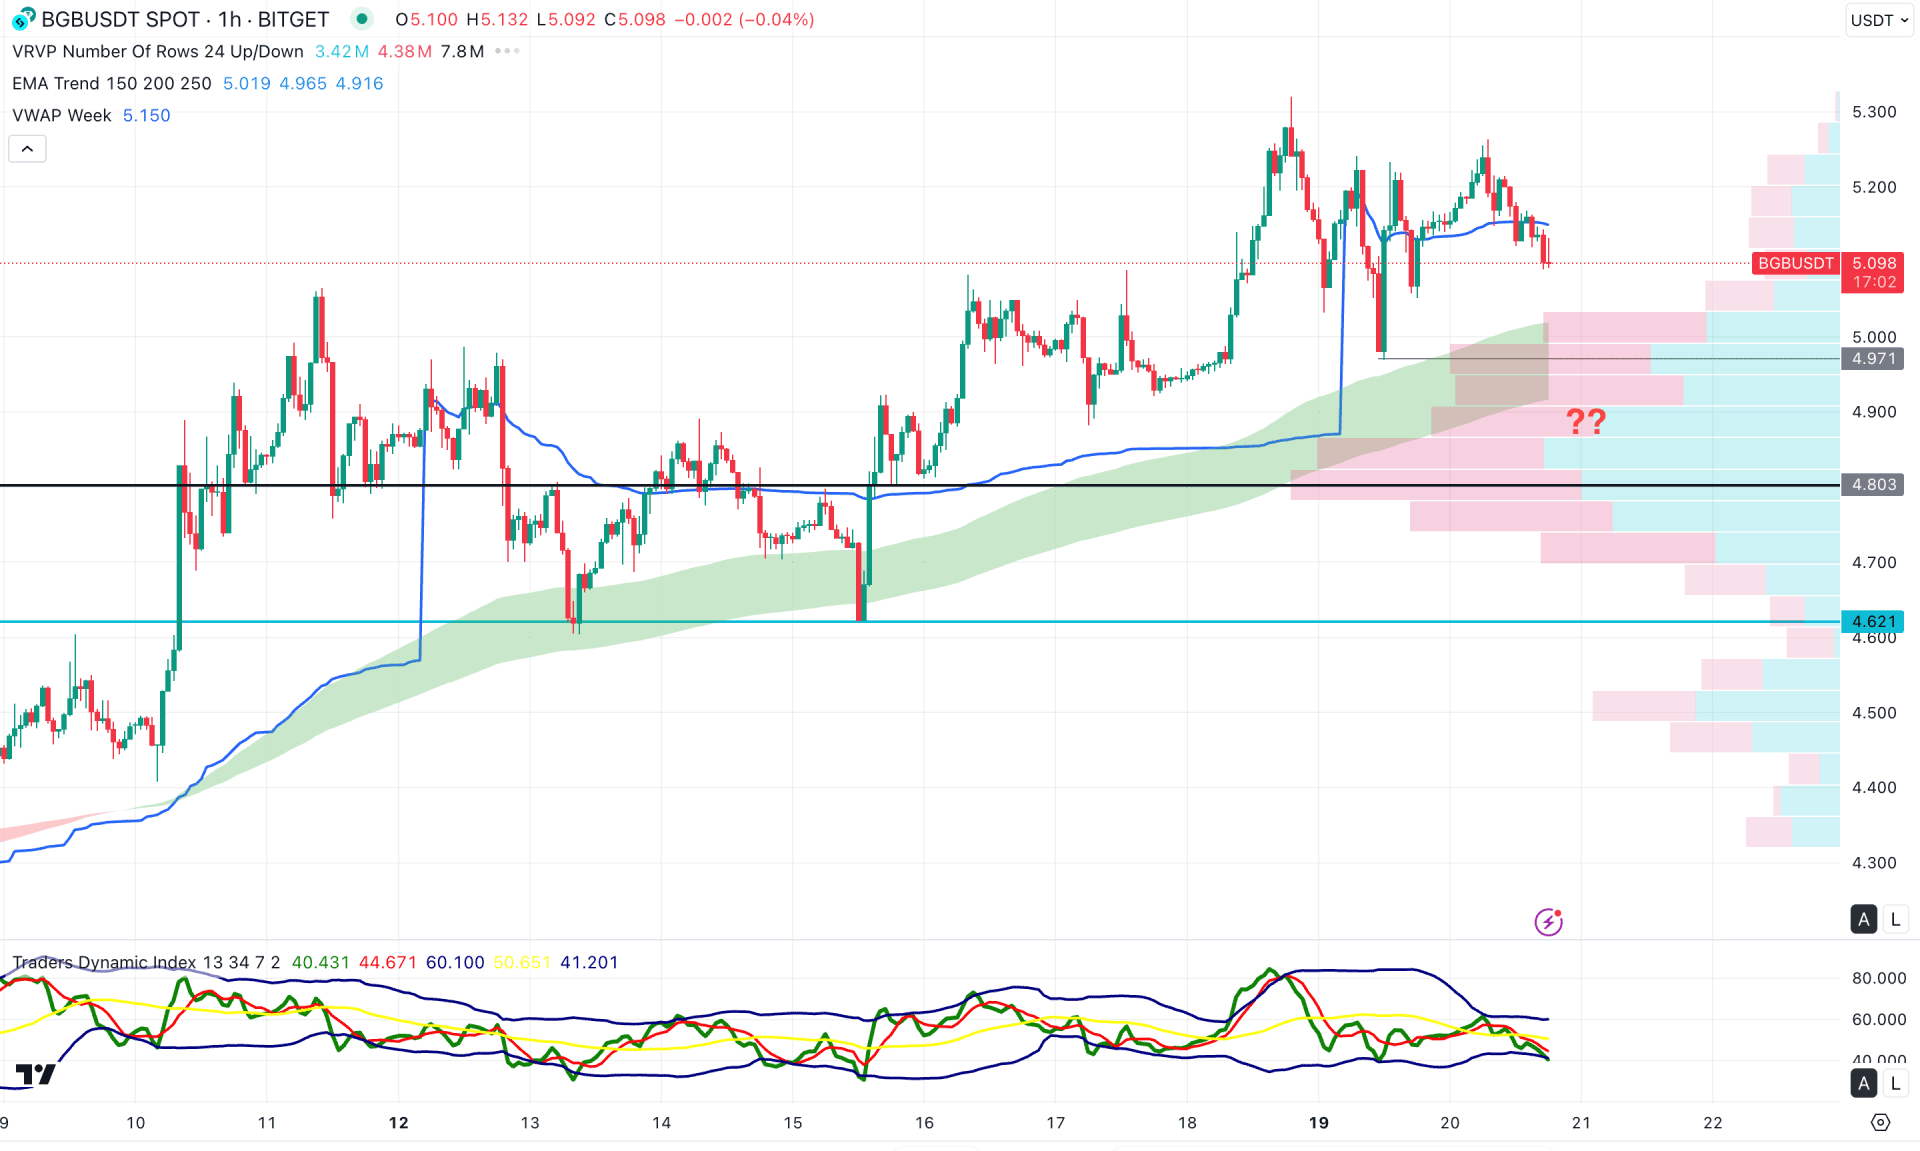
In the hourly time frame, the BGB/USDT price is trading near the intraday high, where more upside pressure is limited. However, the Moving Average wave and VWAP line are below the current price, working as support.
Meanwhile, a sideways momentum is visible from the indicator window where the Traders Dynamic Index (TDI) is below the 50.00 neutral level.
Based on this outlook, the bullish push is possible as long as the price hovers above the high volume line. However, the corrective price action at the top signals a pending downside pressure before validating the long-term bullish trend.
Based on the current market outlook, BGB/USDT is more likely to form a bullish trend, where a valid confirmation is pending. The daily price is still sideways from where an aggressive approach would be to follow the triangle breakout. However, the intraday price is at a premium zone from where a valid discount could be an early long opportunity.


