Published: November 13th, 2024
Bitget's native utility currency, Bitget Token (BGB), showed massive selling pressure in October 2024, creating panic among investors. However, the immediate recovery with a rebound above monthly highs might indicate a decent investment opportunity.
BGB is a cryptocurrency centralized exchange (CEX). The revised BGB token was introduced in July 2021 to give platform users a way to make payments within the ecosystem.
Traders can use Bitget's utility token for profit sharing, social trading, staking, and trading fee reductions. The Launchpad and Launchpad are also open to BGB holders.
By September 2022, the platform had grown to become the third-largest derivatives trader globally. Bitget asserts that BGB provides low transaction expenses because it uses a decentralized ledger network that is devoid of middlemen.
The website claims that the BGB token is very scalable. Developers make sure the Bitget infrastructure services can handle large volumes of transactions without becoming crowded as it expands.
Additionally, BGB gives Bitget consumers access to special incentives and promotions, as well as reduced trading costs of up to 20%. With the BGB, clients may utilize Copy Trade, Bitget's flagship item, to profit share.
Let's see the future outlook of this coin from the BGB/USDT technical analysis:

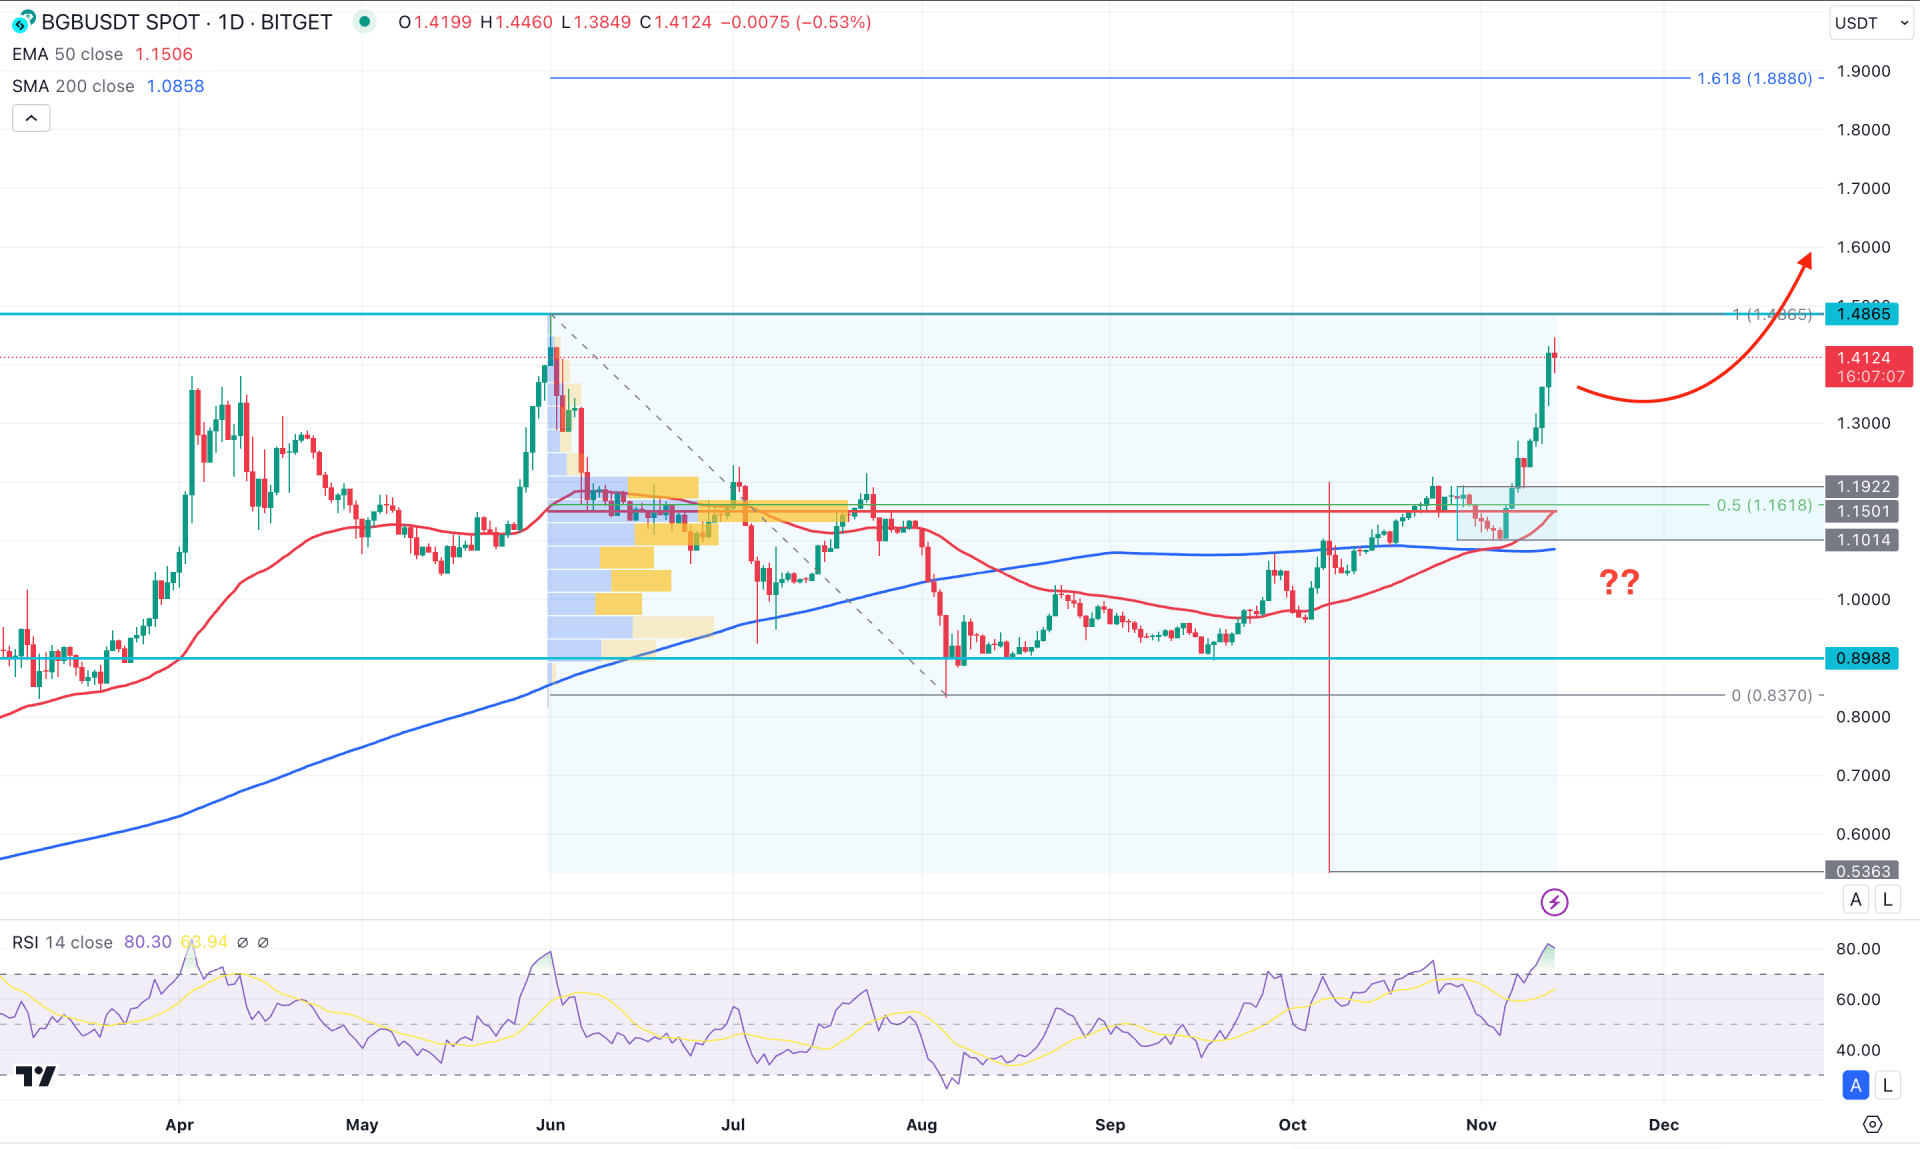
In the daily chart of BGB/USDT, a strong bullish momentum is visible, supported by the sell-side liquidity grab. However, the most recent price approached a crucial resistance, which could limit the gain at any time.
Looking at the higher timeframe, the price has kept moving higher since the inception, with no significant downside recovery until October 2024. However, the price spiked lower and rebounded immediately before closing October as a bullish Hammer candlestick. Later on, the price kept moving higher and formed multiple daily candles above the October 2024 high. The exhaustion is also clear in the weekly chart, which eliminated bulls from the 51% crash.
In the volume structure, the buying pressure is supported as the most recent bullish wave signals a trend continuation pressure as a rally-base-rally formation. As the high volume line is within the immediate bullish order block, we may consider the market momentum as bullish.
In the main price chart, the 100-day Simple Moving Average is below the immediate daily swing and working as a major support. The 50-day EMA is also below the current price, with an upward crossover from the 200 DMA. It is a clear sign of a Golden Cross, where a continuation is highly possible towards the buyers' side.
On the other hand, the price is trading at the premium zone from where further upward pressure needs additional confirmation. The 14-day Relative Strength Index (RSI) is already at the overbought zone, signaling a limit to bulls.
Based on the daily market outlook of BGB/USDT, investors should remain sceptical before opening a long position in this instrument. Overcoming the 1.4865 high could validate the recent bullish order block. In that case, a bullish signal from the 1.2500 to 1.1014 zone could be a conservative long approach. However, a deeper discount is also possible as a crucial trendline liquidity is present below the 200-day SMA. In both cases, the immediate target level would be 1.7000 level before reaching the 1.8880 Extension point.
On the bearish side, a dump is possible after having massive selling pressure from the 1.4800 to 1.6000 zone could offer a bearish signal, aiming for the 1.0000 psychological line. In the broader context, a selling pressure below the 200-day SMA could validate the long-term bearish trend, targeting the 0.7000 area.

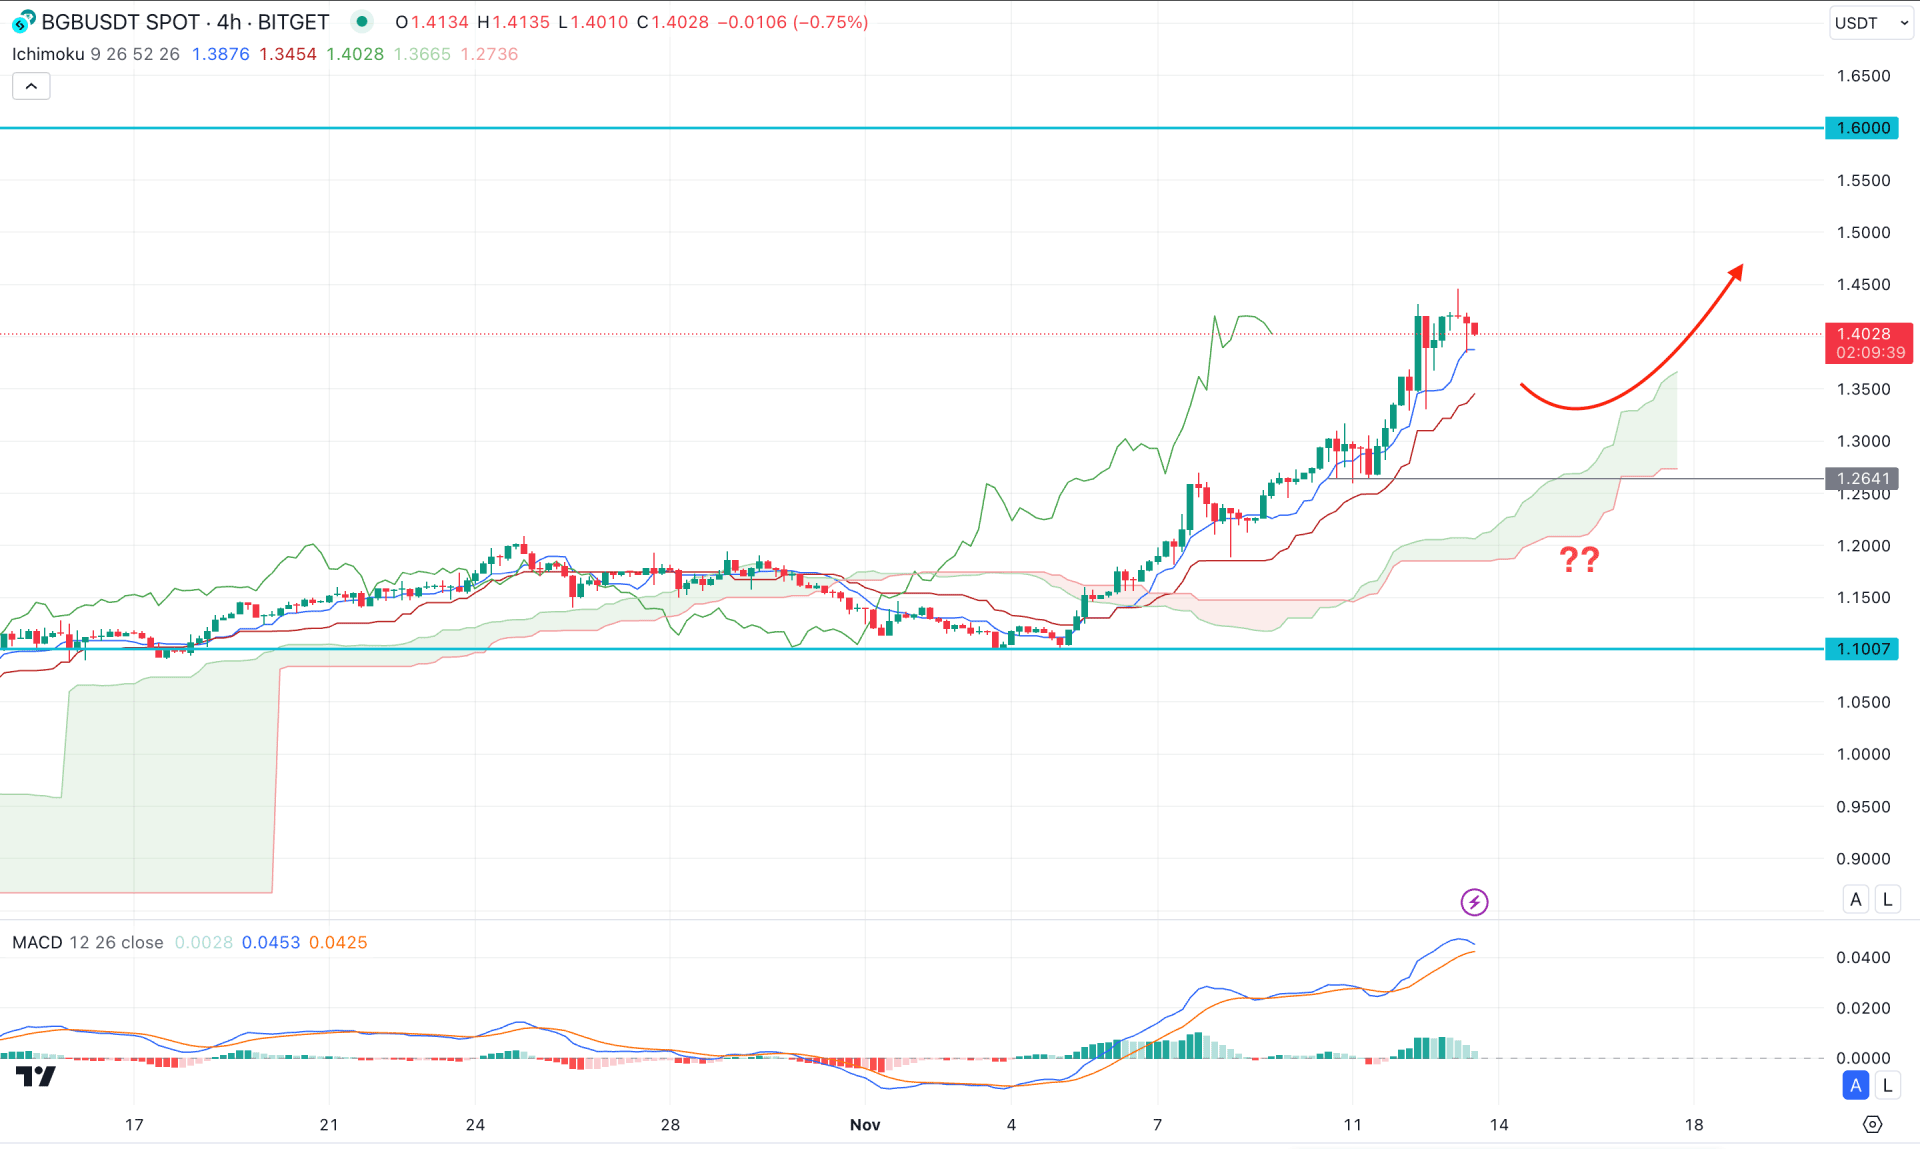
In the H4 timeframe, strong bullish pressure is visible as the current price hovers above the dynamic cloud zone for a considerable time. Also, the dynamic Kijun Sen level is below the current price, working as an immediate support.
On the other hand, the MACD Signal line reached the highest level in a month, suggesting an overbought condition. Although there is no divergence present, the Histogram failed to sustain above the neutral point.
Based on this outlook, any immediate bullish pressure from dynamic lines could open a long opportunity, aiming for the 1.600 psychological line. However, the failure to hold the price above the Cloud zone could be a bearish opportunity aiming for the 1.1000 zone.

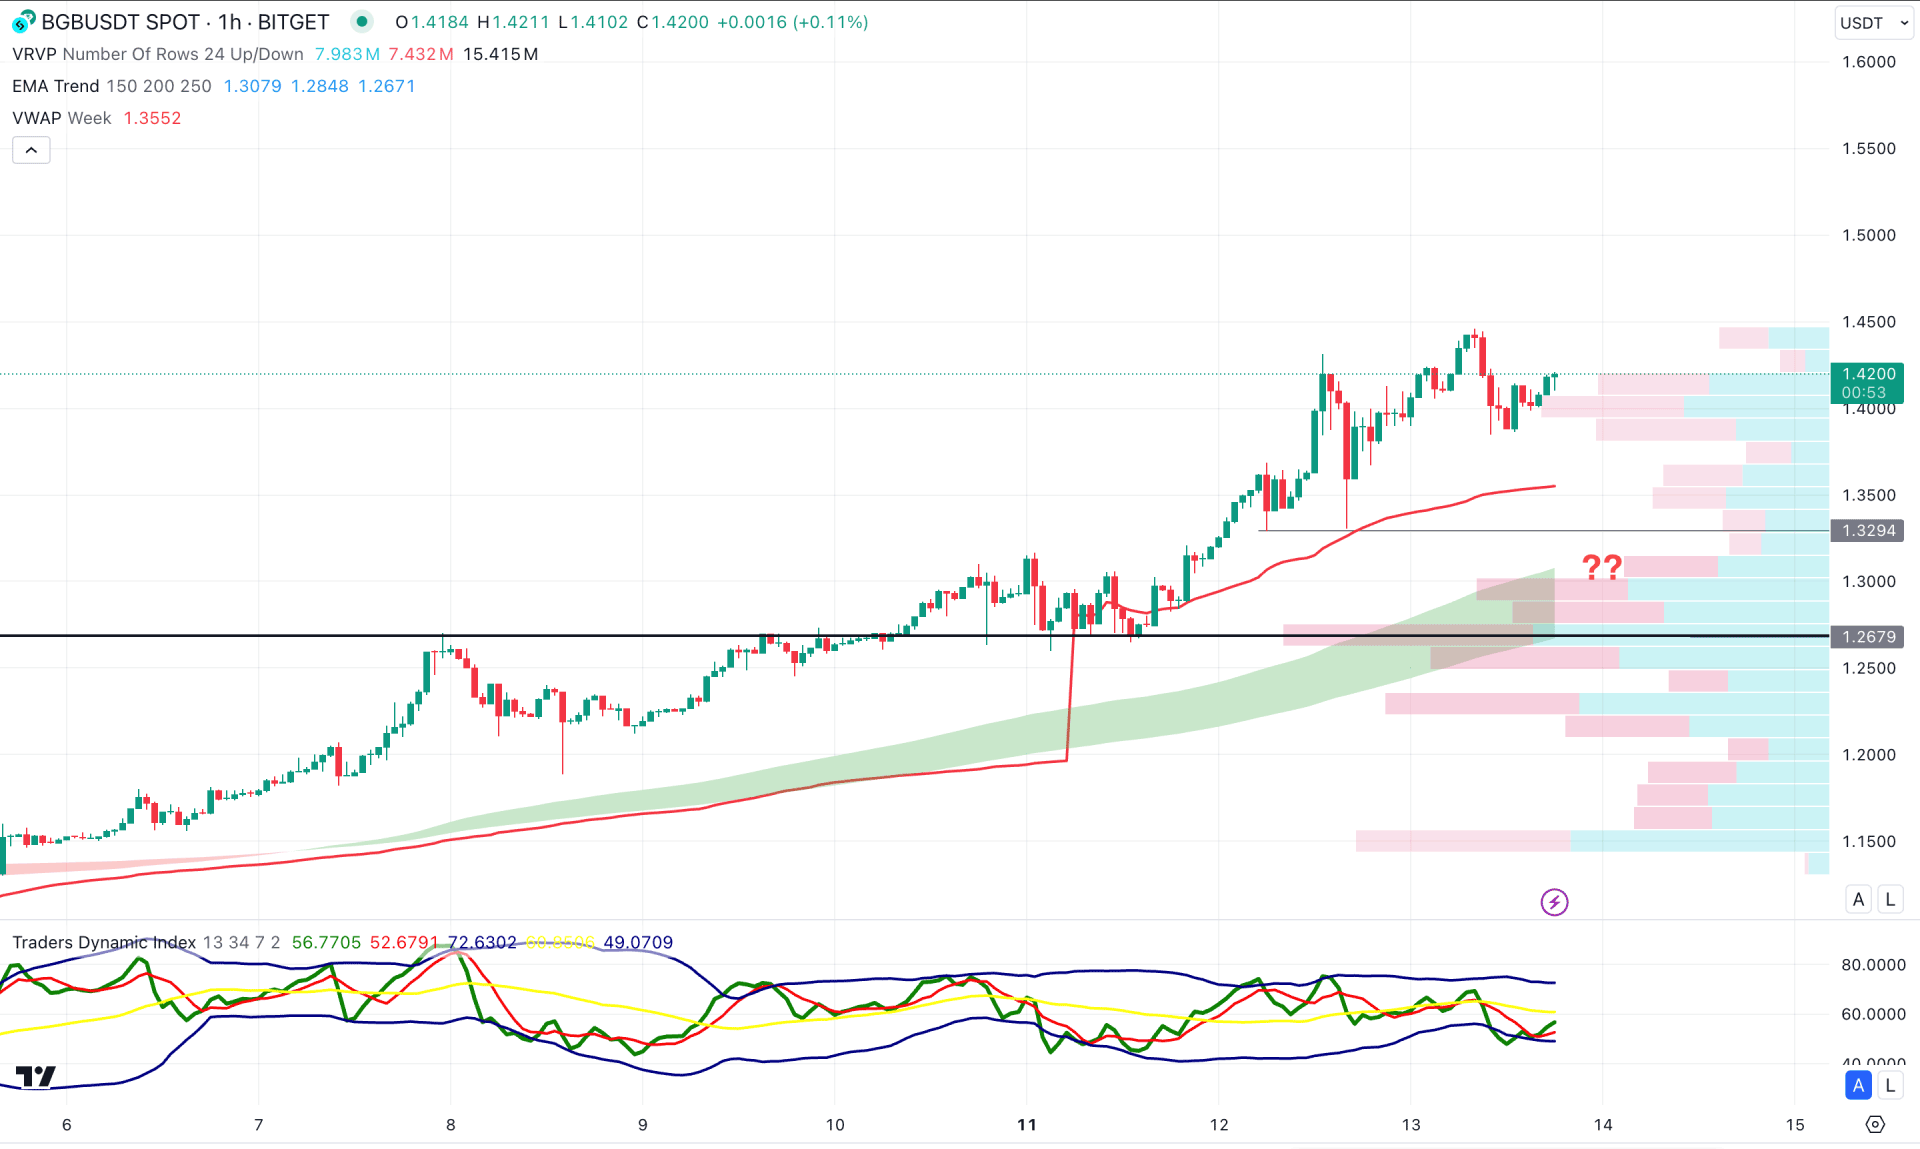
In the hourly time frame, a stable bullish trend is visible, where the Moving Average wave is the major support level. Moreover, there are multiple high-volume lines below the Ma line suggesting several buyers' attempts.
In the indicator window, the Traders Dynamic Index (TDI) showed a valid rebound from the lower band, while the weekly VWAP is below the current price.
Based on the hourly structure, the BGB/USDT is more likely to move higher in the coming days. The MA wave would work as a major support in this structure, while the primary target would be the 1.6000 level.
Below the VWAP line, the 1.3294 level is a crucial line to look at as a bearish recovery from this line could offer another long opportunity.
BGB/USDT is hovering at the crucial level, from where a Pump and Dump scheme is possible. However, the existing bearish exhaustion already wiped out enough bulls, which can lead to a bullish breakout soon.