
Published: March 5th, 2025
The Bitcoin Cash network, which was a hard- fork of the core Bitcoin blockchain in August 2017, was split off in November 2018 to become Bitcoin Satoshi's Vision (BSV). According to this network, Satoshi Nakamoto's original idea for the Bitcoin protocol is still in its purest form.
The supply cap, block timings, and block rewards of Bitcoin SV are all the same as those of Bitcoin Cash (BCH) and Bitcoin (BTC), however, there are some significant differences between the two. The scalability options for Bitcoin SV, like those for Bitcoin Cash, focus on enlarging the block dimension, which permits more transaction processing at the expense of availability to the mining industry due to an even greater computational burden. The Bitcoin Cash network debated a number of enhancement suggestions to improve the efficiency of transactions and on-chain processes, which led to the creation of the Bitcoin SV fork.
The development of Bitcoin SV is being directed by nChain, a distributed ledger research and development firm run by Craig Wright, who is infamously claiming to be Satoshi Nakamoto, the inventor of Bitcoin.
Let's see the future price direction from the BSV/USDT technical analysis:
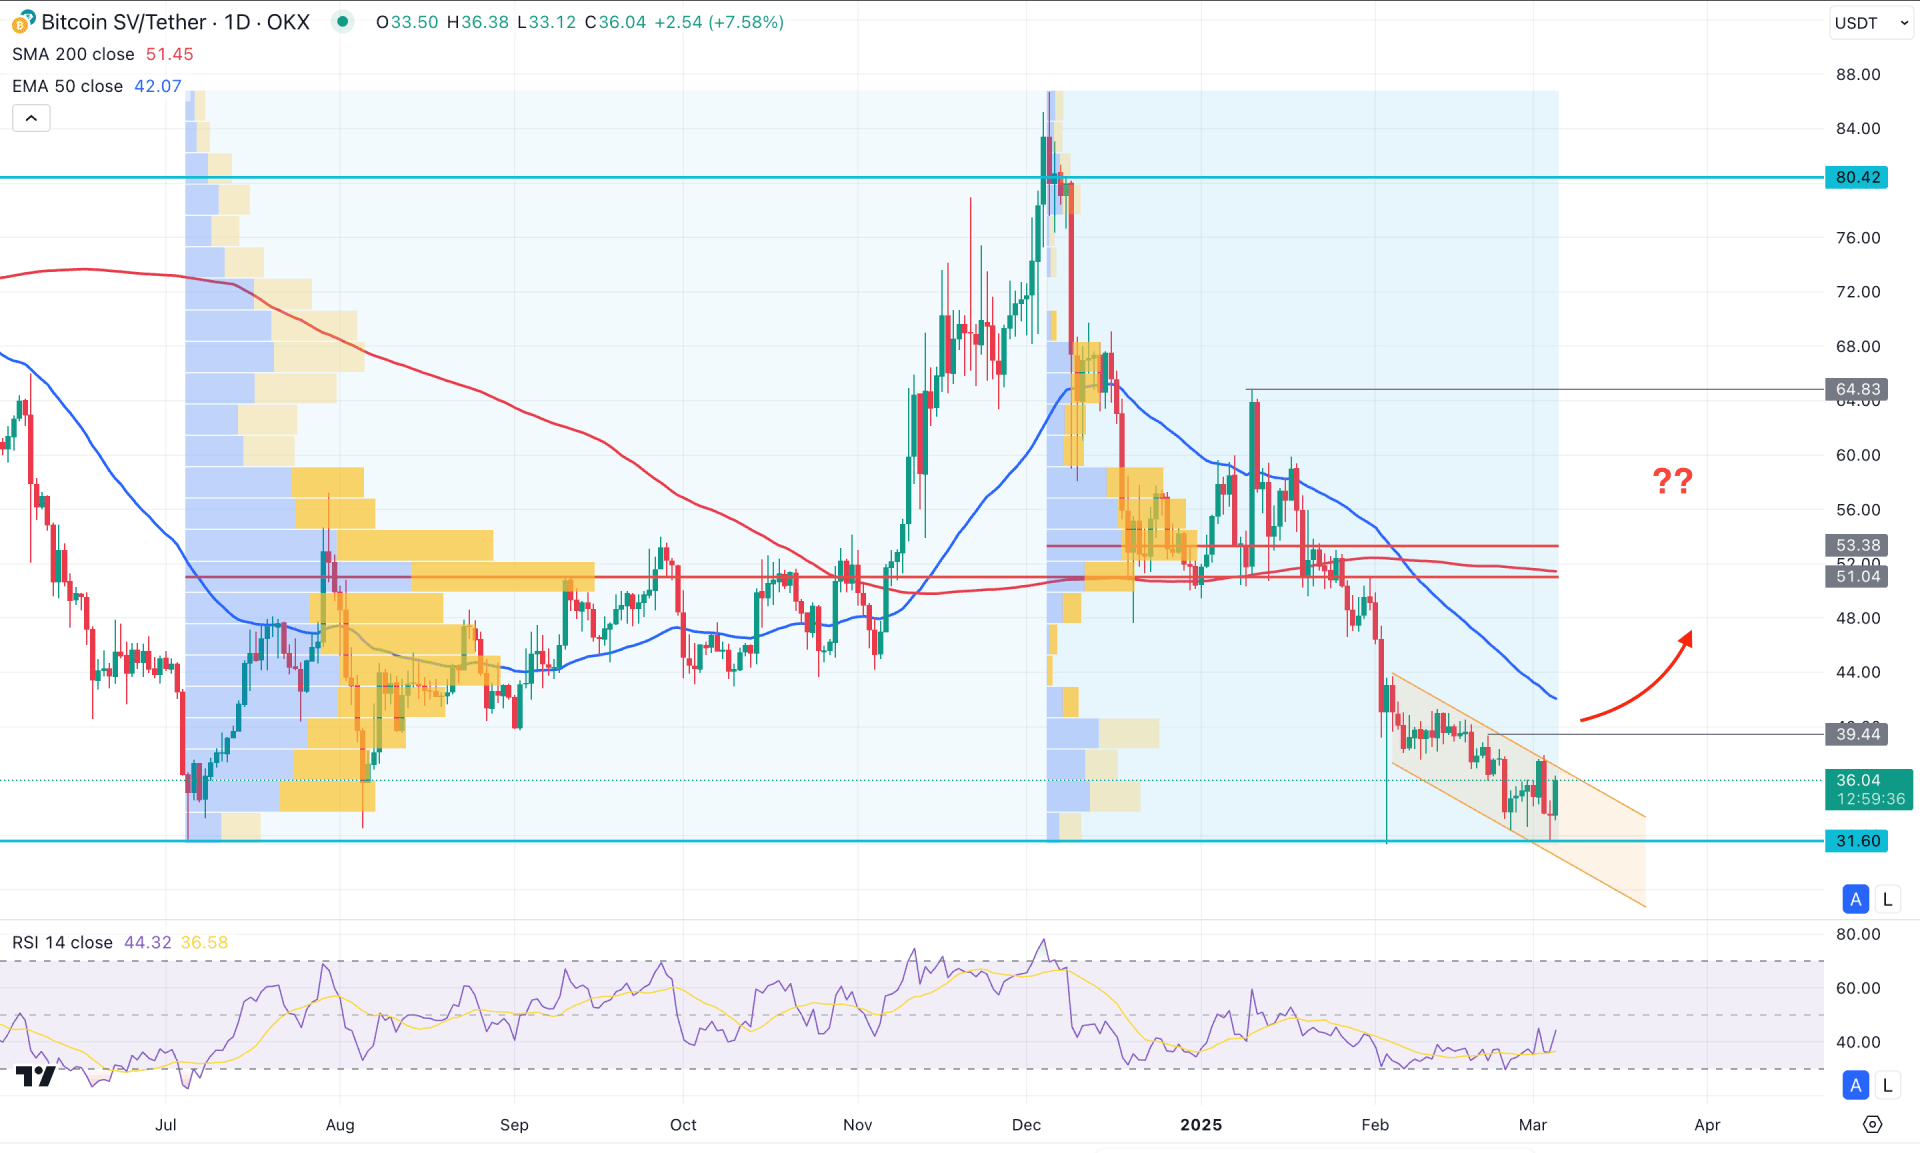
In the daily chart of Bitcoin SV (BSV/USDT), the current price is trading at a multi-year low, showing sideways momentum from which a decent bullish recovery could occur. Although technical indicators suggest a bearish continuation, a bullish rebound is likely after a valid rejection.
In the volume structure, the largest activity level from July 2024 is at the 51.04 level. Another high-volume level from December 2024 is at the 53.38 level. Since both of these levels are above the current price with a strong gap, investors may expect a bullish correction even if the major trend remains bearish.
In the primary chart, the selling pressure from the high-volume line has created a bottom at the 31.60 level. However, instead of forming a new swing low, the price moved sideways and is currently hovering within a descending channel. Therefore, a breakout from this downward channel could be the first sign of an upward trend.
On the other hand, the 200-day Simple Moving Average has flattened and remains above the high-volume line. Meanwhile, a bearish crossover is visible in the 50-day Exponential Moving Average line. This suggests a potential death cross, indicating a continuation of the bearish trend.
In the indicator window, the Relative Strength Index (RSI) has found a bottom at the 30.00 level and showed a rebound. However, the current price line is still below the 50.00 neutral level. With open space in the indicator window, any bullish signal in the price chart could offer a higher reward.
Based on the daily market outlook, investors might find a long opportunity if the price overcomes the 39.44 resistance level. However, a more conservative approach could be considered after the price breaks above the 50-day Exponential Moving Average line.
If the price continues to move higher, it could extend the buying pressure above the 80.42 level. On the other hand, if the price fails to maintain the buying pressure above the 50-day Exponential Moving Average, an immediate bearish shift could open a short opportunity for a death cross continuation. In that case, the price could decline and form a new bottom below the 30.00 area.
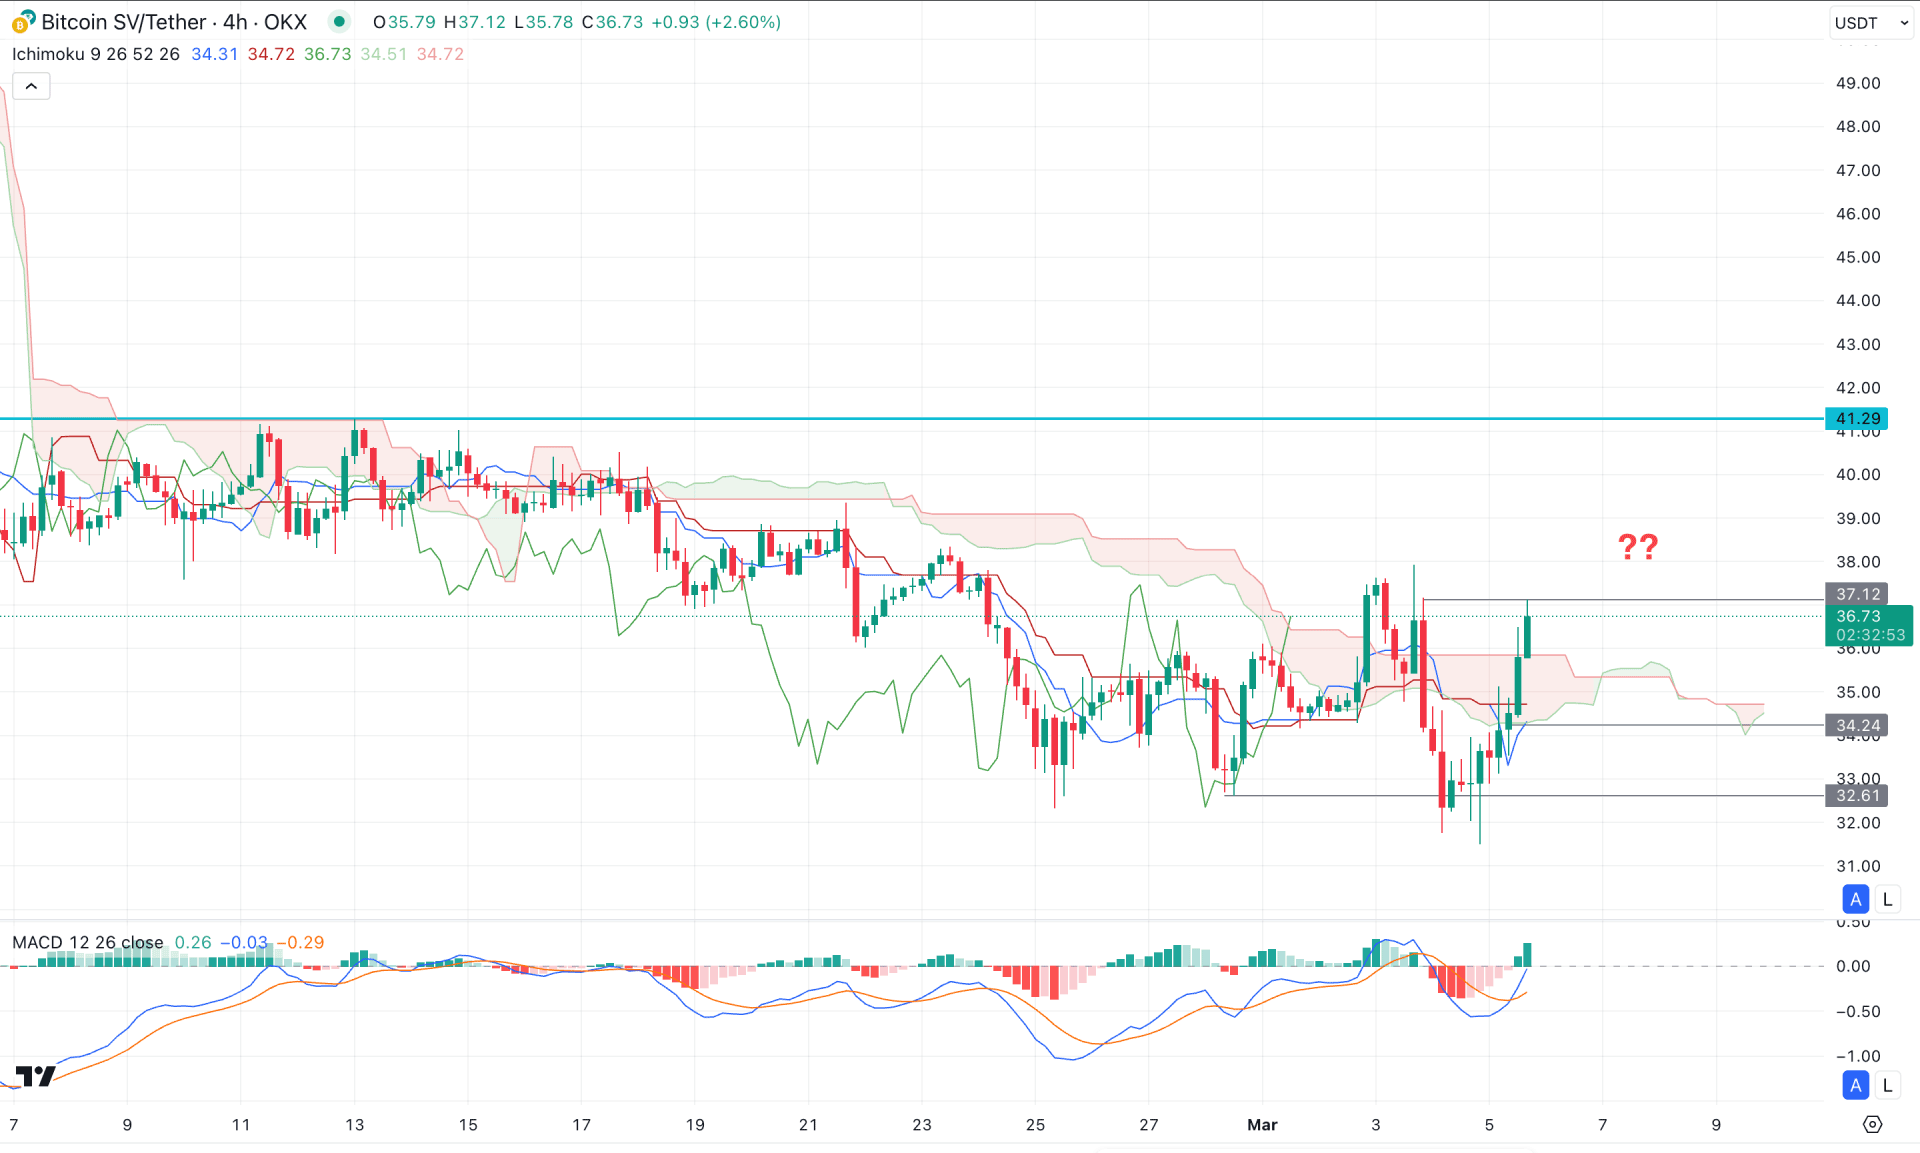
In the H4 timeframe, the existing market momentum is bearish, as the price remained below the Ichimoku Cloud zone for a considerable time. However, the most recent price showed a bullish recovery, above the cloud level. The primary aim for this pair is to look for long trade after a valid bullish V-shape recovery.
In the indicator window, the MACD Histogram showed a buying pressure as the current line is above the neutral level.
Based on this outlook, a minor downside recovery is possible as the current price is facing resistance from the static line. However, a bullish H4 candle above the 37.12 level could be a potential long opportunity, aiming for the 41.29 level.
On the other hand, an immediate downside pressure with a stable market below the 34.24 level could resume the existing trend towards the 31.00 area.
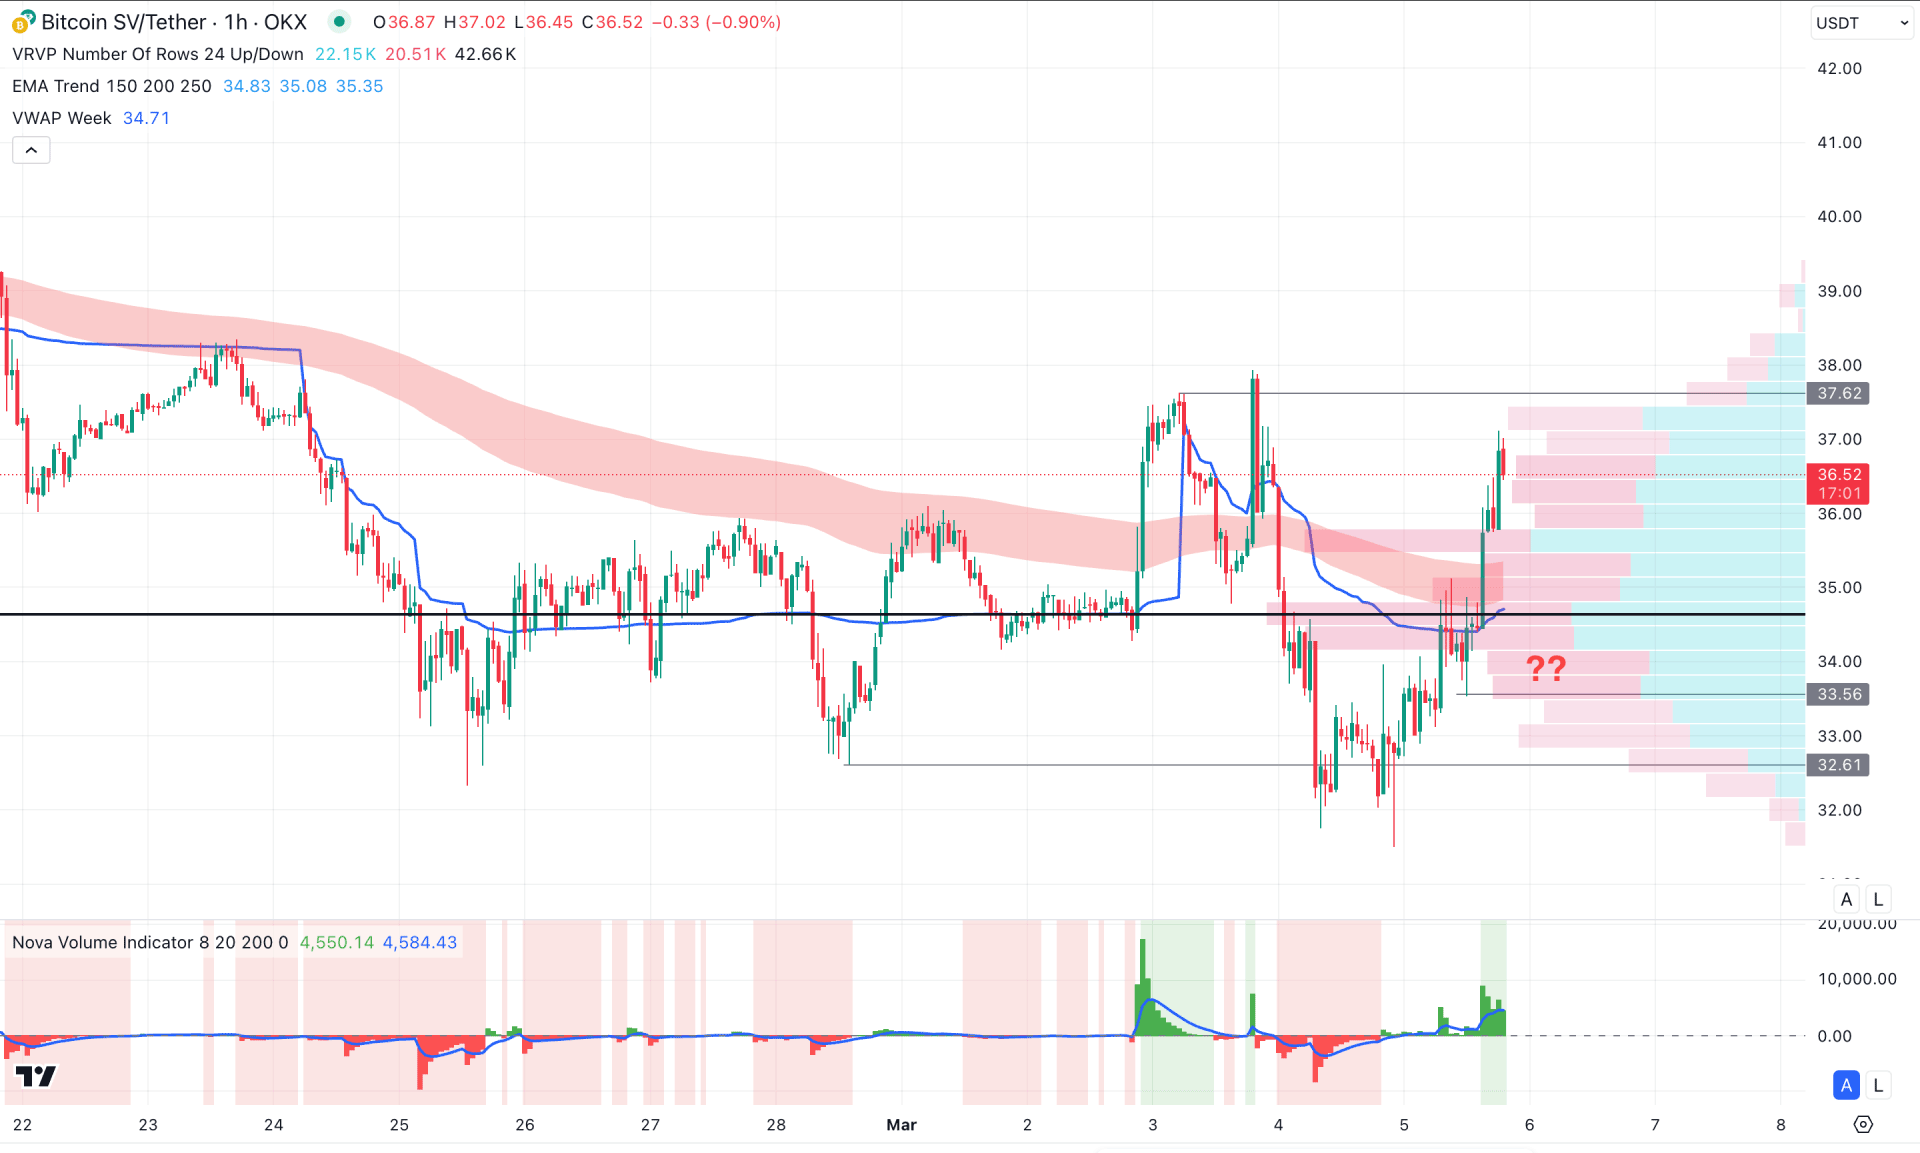
In the hourly timeframe, the current price is trading within sideways momentum. After accumulating enough liquidity from the near-term swing low, the price rebounded above the visible range high-volume line. This is a sign of institutional accumulation, with a potential breakout or trend change.
In the most recent chart, the Moving Average Wave is below the current price and is acting as a support. The weekly VWAP line is following the same momentum, while the high-volume line is closer to it.
Based on this context, investors might find a bullish trend after overcoming the 37.62 resistance level. On the other hand, downside recovery is pending before showing an additional bullish signal from the 35.00–33.00 area.
Based on the current multi-timeframe analysis, BSV/USDT is more likely to form a bottom. Therefore, investors should monitor the intraday price action, as any potential bullish impulse could be an early long signal.


