Published: July 10th, 2020
It seems that most traders underestimate analysis on the Monthly chart, especially when it comes to Bitcoin. Unlike fiat currencies, cryptocurrencies are much more volatile, and therefore higher timeframe analysis could be a great way to look at this asset class. This is disregarding whether you are a day or a swing trader.
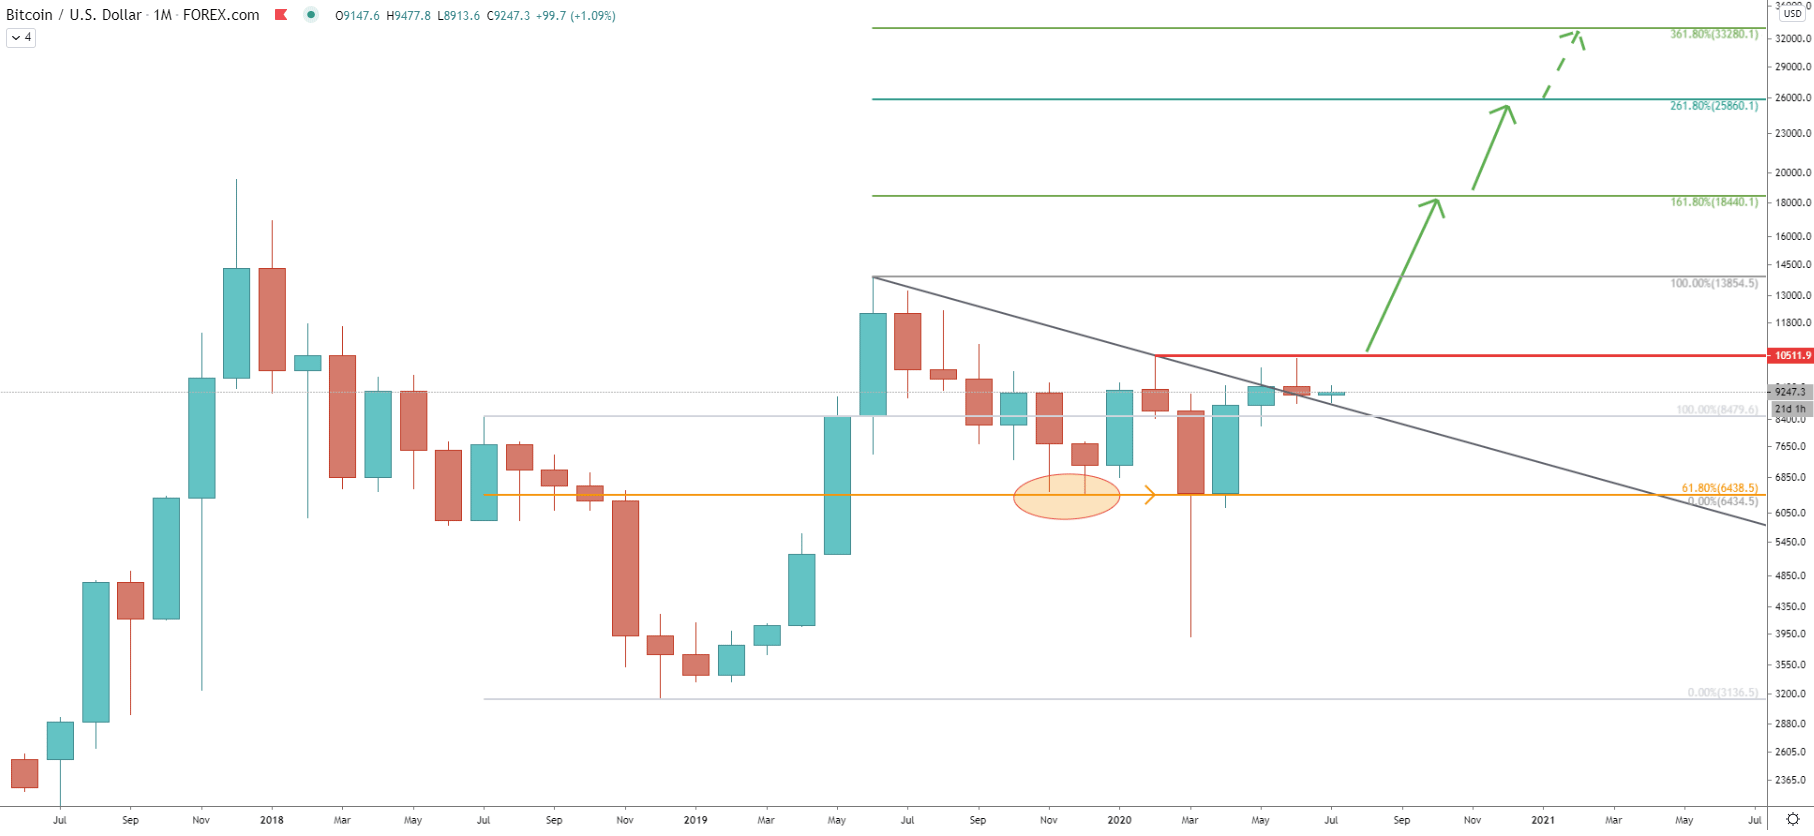
On the chart above, the Fibonacci retracement indicator was applied to the last wave down, where BTC/USD found the bottom at $3136. It is so obvious that there was a clear rejection of the 61.8% retracement level, which is at $6438. Even when the financial crisis started, Bitcoin held that support, as bulls were heavily defending this level.
The first rejection of 61.8% occurred in December 2019. Then, in March 2020 there was a huge spike produced below the support, although monthly close still remained above. This is a very bullish price action, although it can take a long time before BTC/USD will continue trending up.
The nearest resistance level is at $10511, which is the second point of the downtrend trendline. There still was no monthly closing price above the trendline and/or $10511 resistance. However, when Bitcoin will finally close the month above the resistance, the upside potential becomes enormous.
Fibonacci applied to the corrective wave down, where $6438 support was rejected, shows 3 possible long term resistance levels. These are 161.8% Fibs at $18440, 261.8% at $25860 and 361.8% at $32280.
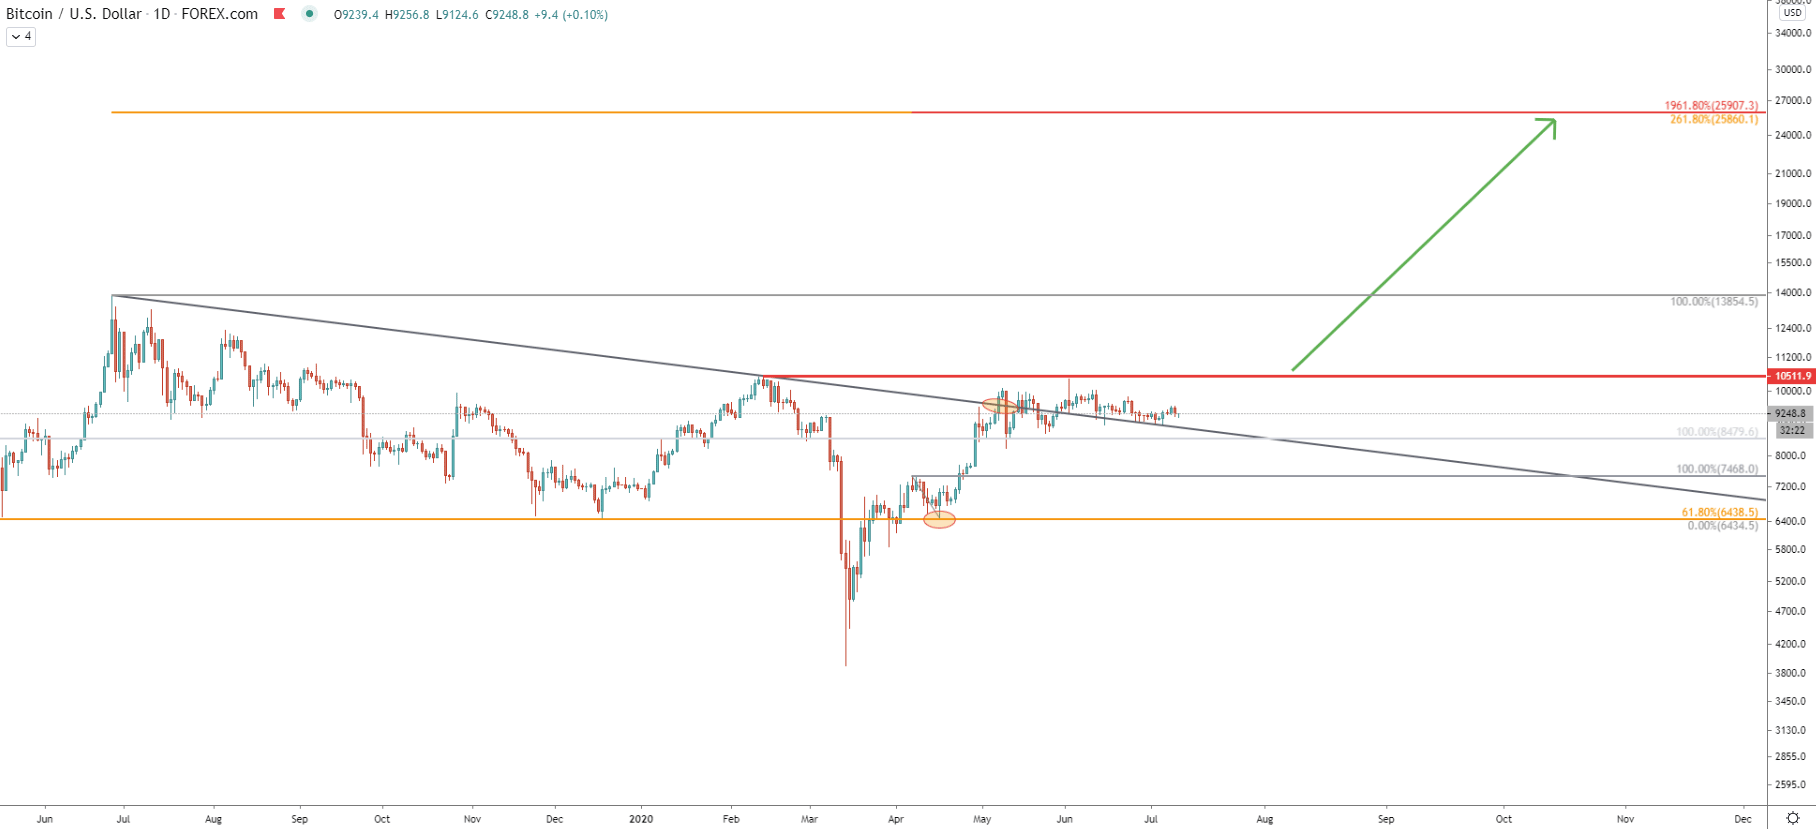
On the monthly chart, there was no break and close above the downtrend trendline, but on the daily chart, we can see quite the opposite. BTC/USD broke above the trendline and then corrected down. Currently, the trendline is acting as the support, which could trigger another wave to the upside anytime.
We have applied the Fibonacci retracement indicator to the corrective wave down where 61.8% Fibs at $6438 was rejected. It shows that the 1961% retracement level corresponds precisely to the 261.8% Fibs as per the Monthly chart. Perhaps this will be the most-watched price level, when/if the uptrend will continue. But obviously for this scenario price must also break above the $10511 resistance.
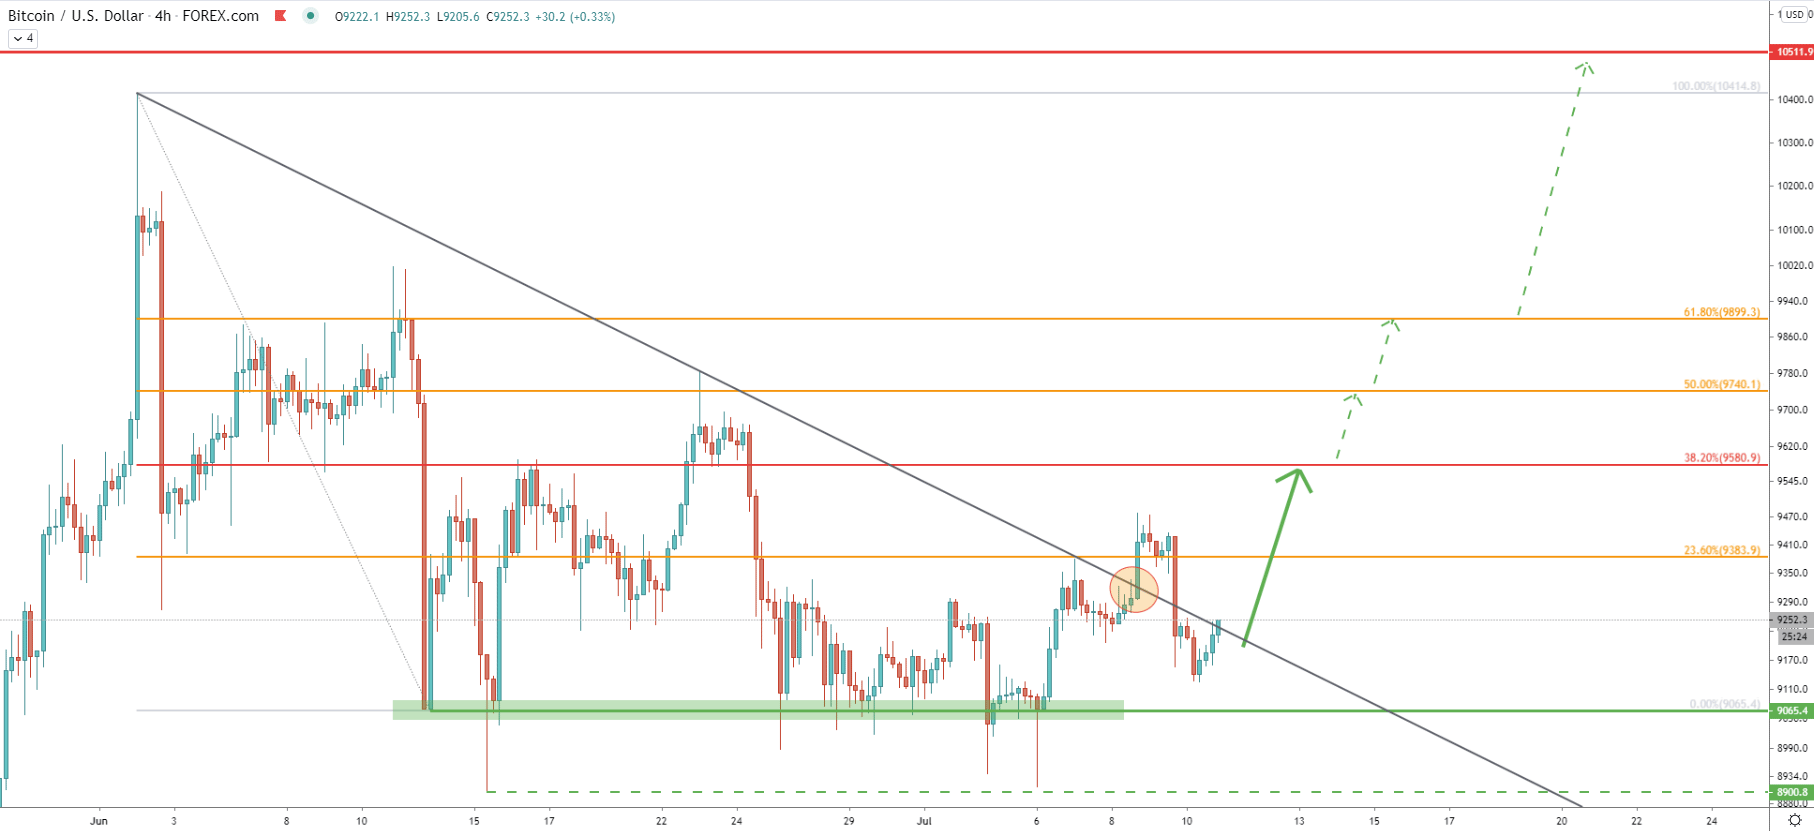
Time to look at the short term key resistance starting with the 4-hour chart. Here we can see that price has formed massive support at $9065, which was rejected multiple times. Then BTC/USD did break above the downtrend trendline, which also looks like a break above the triangle pattern.
The Fibs applied to the 2-11 June shows multiple resistance levels. As the 23.6% Fibonacci retracement level was broken, the next nearest resistance is now 38.2% Fibs at $9580.
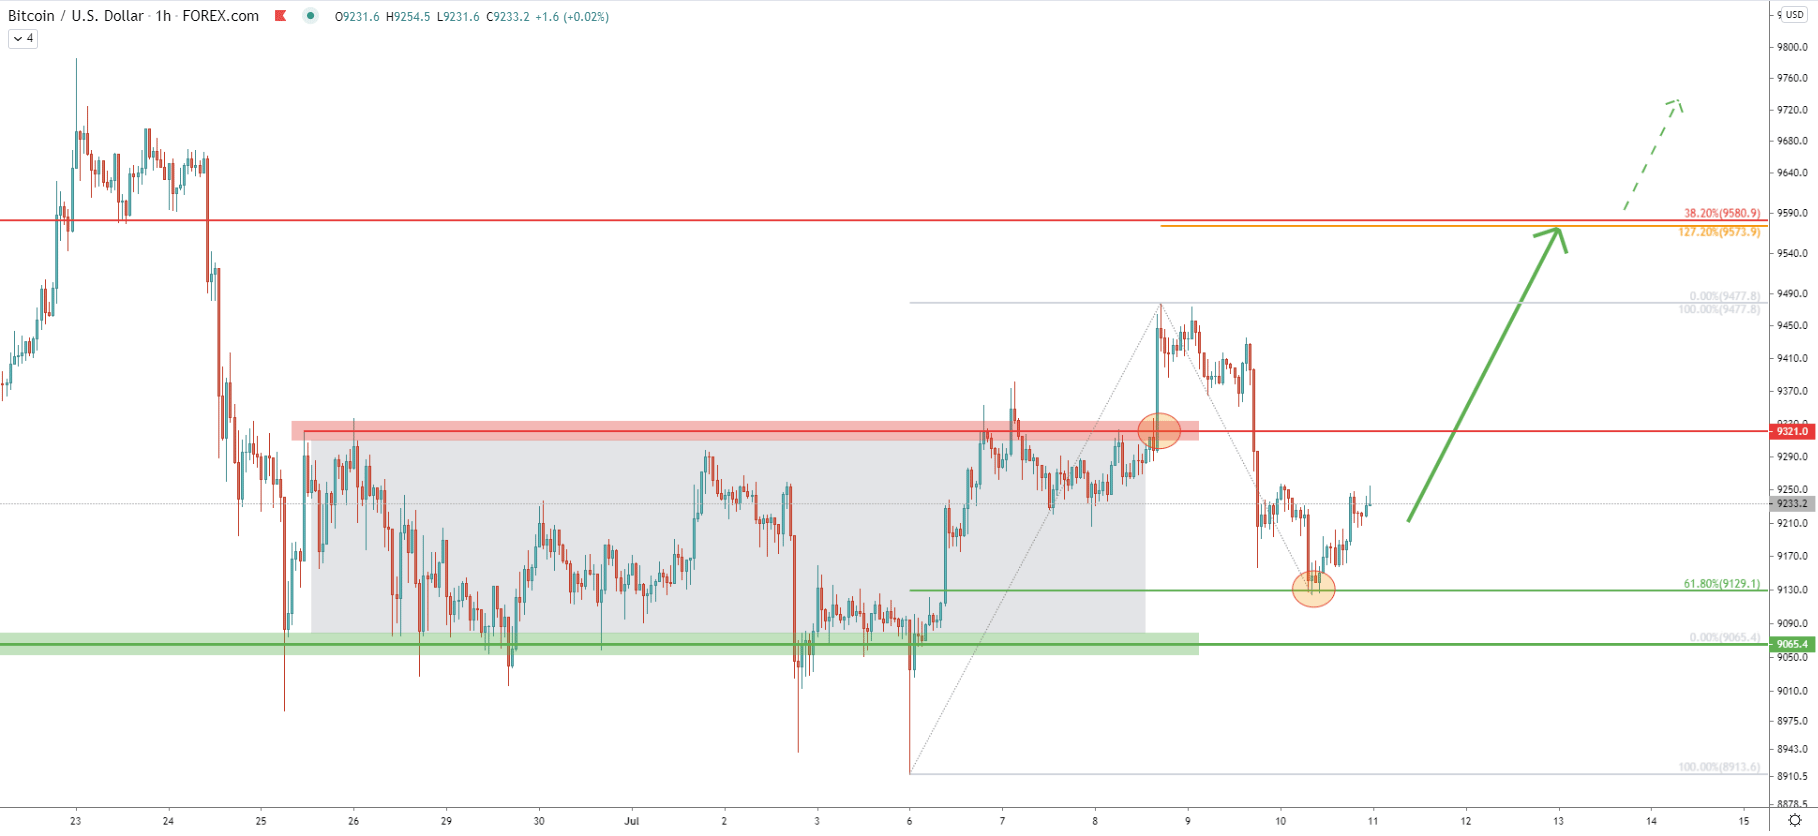
On the 1-hour chart, the consolidation phase is very clear. But along with the trendline break as per the 4-hour chart, Bitcoin broke above the range, suggesting further growth potential. On the current pullback, the price has reached and rejected 61.8% Fibs at $9129, which could have been the ideal entry point for buyers as well as long term investors.
Fibs applied to the current correction shows taht 127.2% retracement level almost exactly corresponds to the 38.2% Fibs as per the 4-hour chart. Therefore, in order for Bitcoin to confirm a stronger upside move, the price must break and close with confidence above the $9580 resistance first.
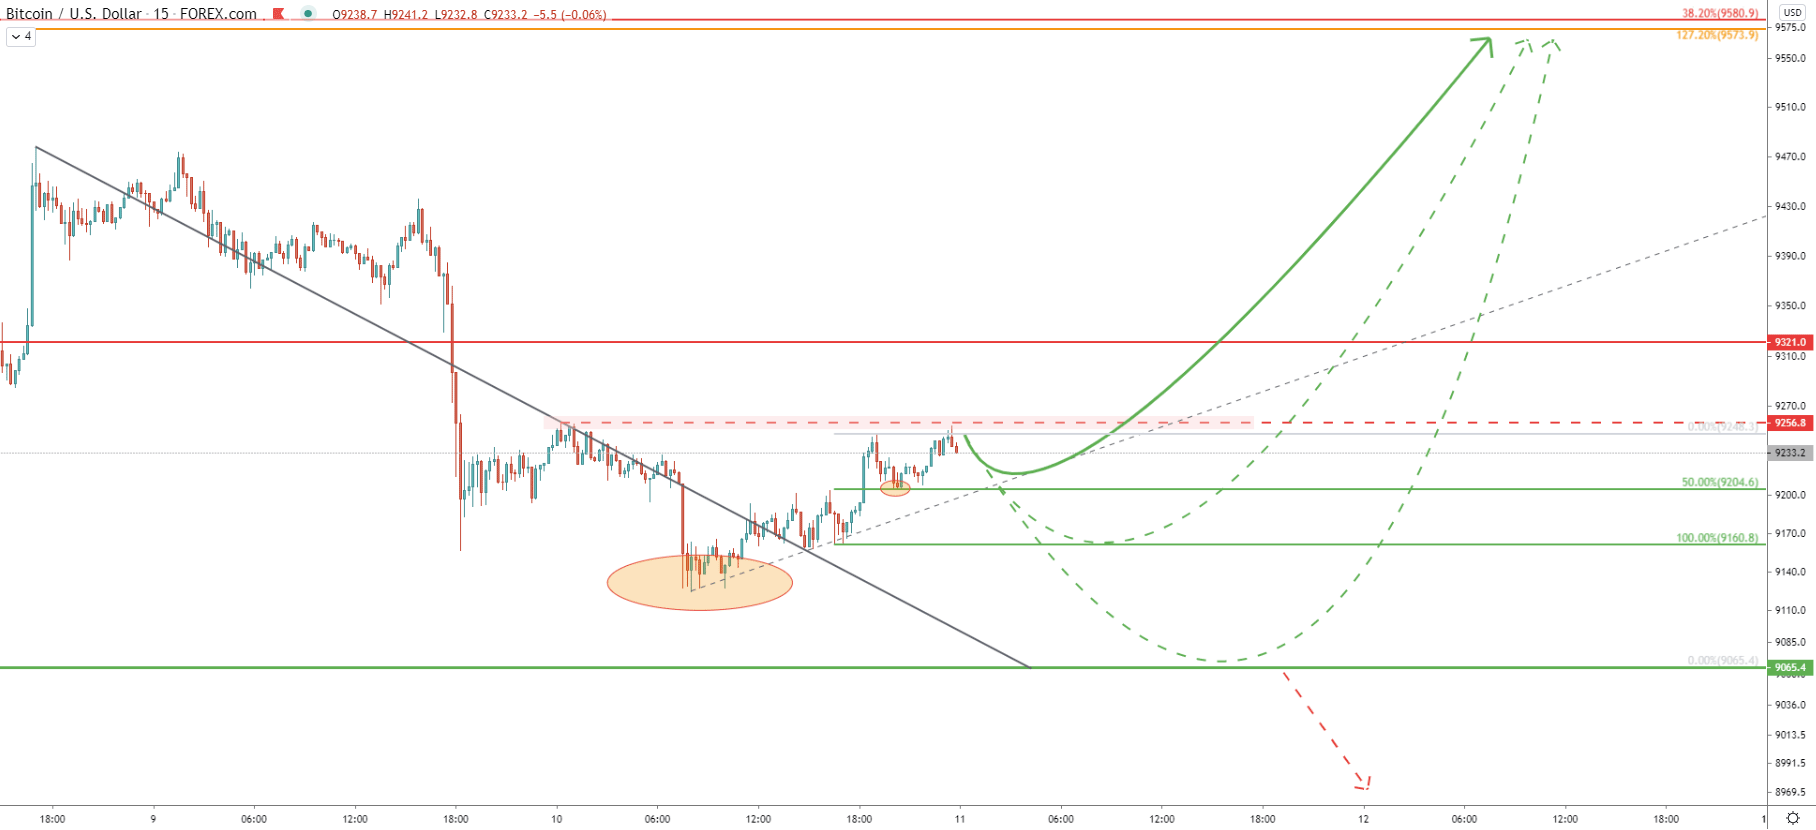
On the 15-minute chart, we wanted to share potential short term scenarios. They all suggest a bullish trend as long as the price remains above $9065. Bitcoin could either start moving up without any correction or correct down towards either $9200 or $9160 support before/if the price will move up. But to confirm even the short term growth, there must be a 1-hour break and close above the current resistance at $9256.
In the long, medium, and short term Bitcoin price does look very bullish and currently, BTC/USD stands at a very attractive price level for buyers and investors.
If we look at the long term Bitcoin price perspective, the key resistance is seen at $25860 as per the Daily chart. But in the short term, key resistance is seen at $9580 as per a 1-hour chart. Each of the resistance levels is confirmed by two Fibonacci retracement indicators.
The key support level is seen at $9065, and if BTC/USD will produce a Daily close below, the bullish outlook will be invalidated and the downside risk will increase substantially.
Support: 9204, 9160, 9065
Resistance: 9256, 9321, 9580


