Published: June 1st, 2020
It has been a very extended consolidation for the bitcoin if we consider previous exponential growth prior to 2018. We must all remember what Bitcoin price did during the COVID paranoia, where many stop losses were triggered and many lost their Bitcoins. Perhaps this was the final “stop-loss kick out” move by the market, after which a long term trend usually starts. It seems like Bitcoin is about to go exponentially once again and let’s have a look at why there are these thoughts.
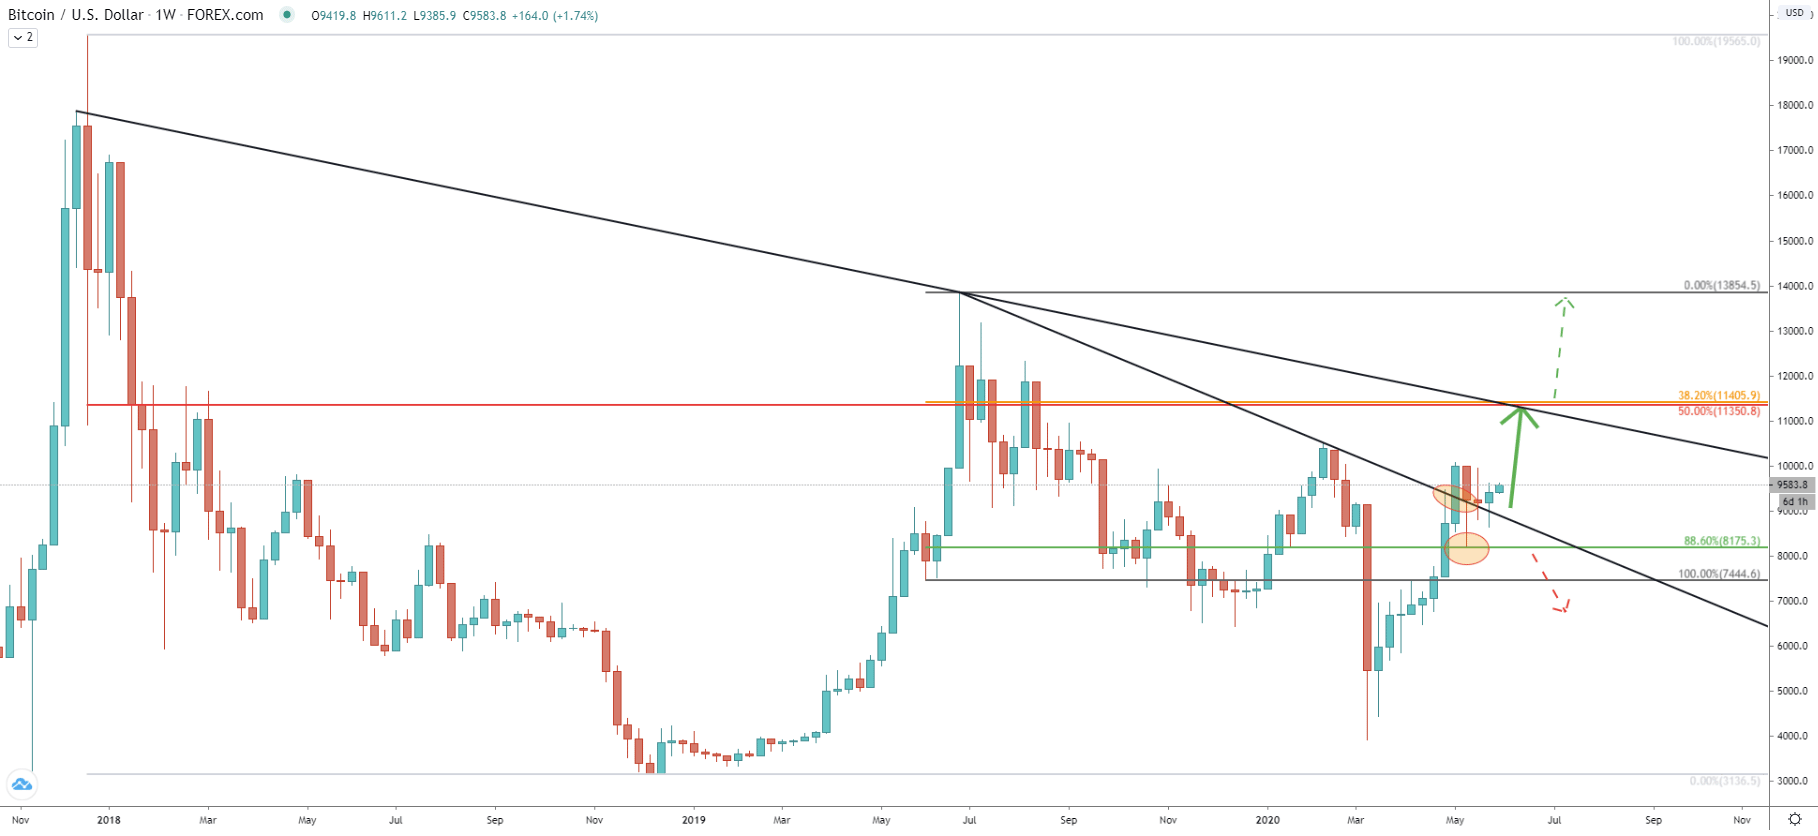
On the Weekly chart, there is a Fibonacci indicator applied to the last upswing, when BTC/USD has established a $13854 high back in May 2019. While this seems like outdated indicator, it usually shows good price levels when applied to last waves, past or current. In any way, we can see that several weeks ago BTC bounced off 88.6% Fibs at 8175. This clean rejection of the Fibonacci support occurred right after price broke above the downtrend trendline. This validates the uptrend and should result in a new wave up, potentially towards 11.5k area. The upside target is confirmed by two Fibonacci retracement levels, 38.2% and 50%, both of which are pointing out to the $11400 price area. But there will be much more upside potential if there will be a daily break and close above 11406, which truly could be a huge bullish confirmation.
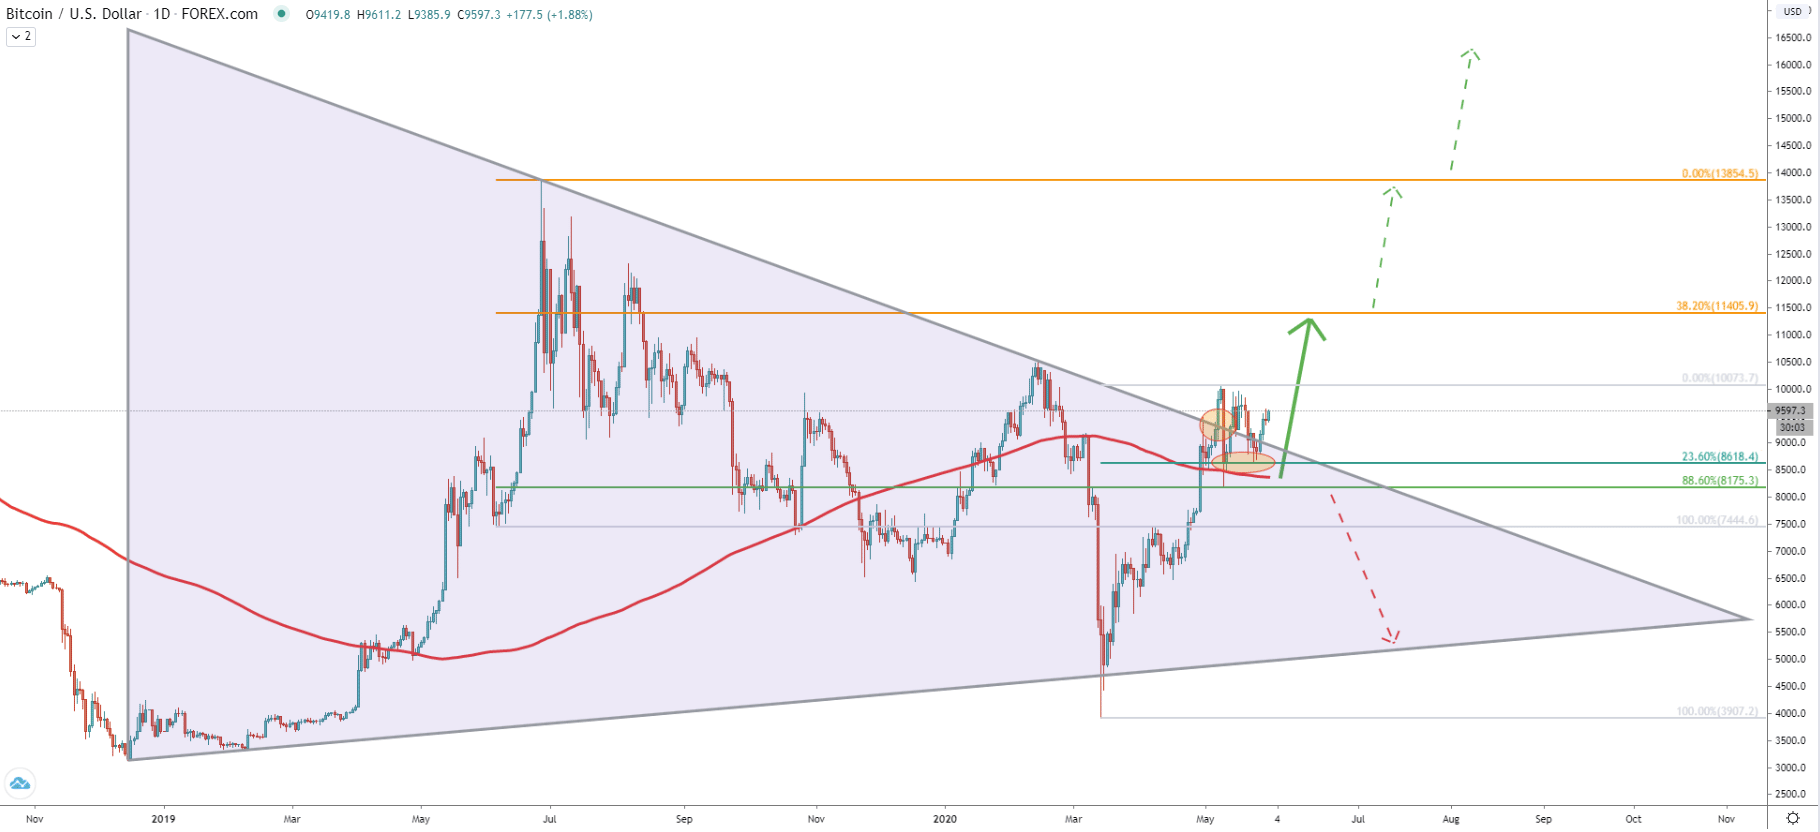
On the daily chart, we can observe the breakout of the Triangle pattern after which the price corrected down and rejected the 200 Simple Moving Average. On the second correction down, the price has cleanly rejected the 23.6% Fibs at 8618, confirming strong bullish intentions by the Bitcoin. On the other hand, if the price manages to move down and break below the 8175 support, strongly bullish scenario will no longer be valid and consolidation within the triangle is likely to continue.
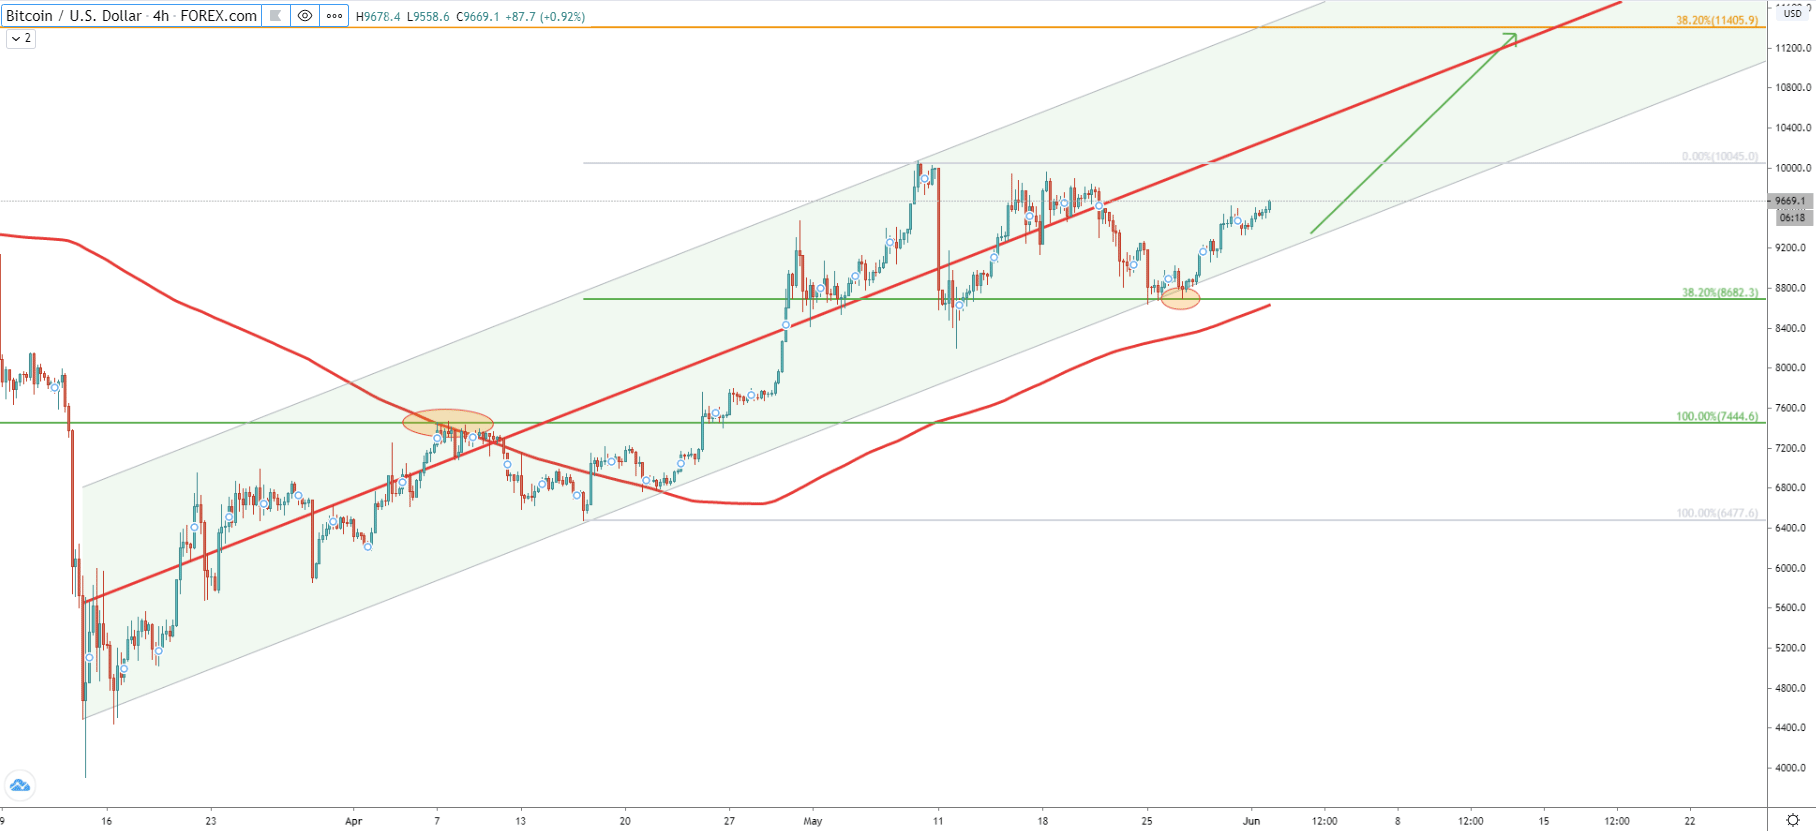
The 4h price action shows a clear bullish pattern, where price remains within the ascending channel. The first stage was the break above the 200 SMA, and rejection of the uptrend trendline. Then the price has reached 10k high, which was right at the top of the current channel. Finally, after some consolidation, where Bitcoin has rejected 38.2% Fibs at 8682 several times, the price started to move up yet again. Higher highs and higher lows are being printed and this should push price up to 11.4k resistance area, which also corresponds to the middle trendline of the ascending channel. But also, the price might reach the target much faster and in fact test the upper trendline of the channel within a few days.
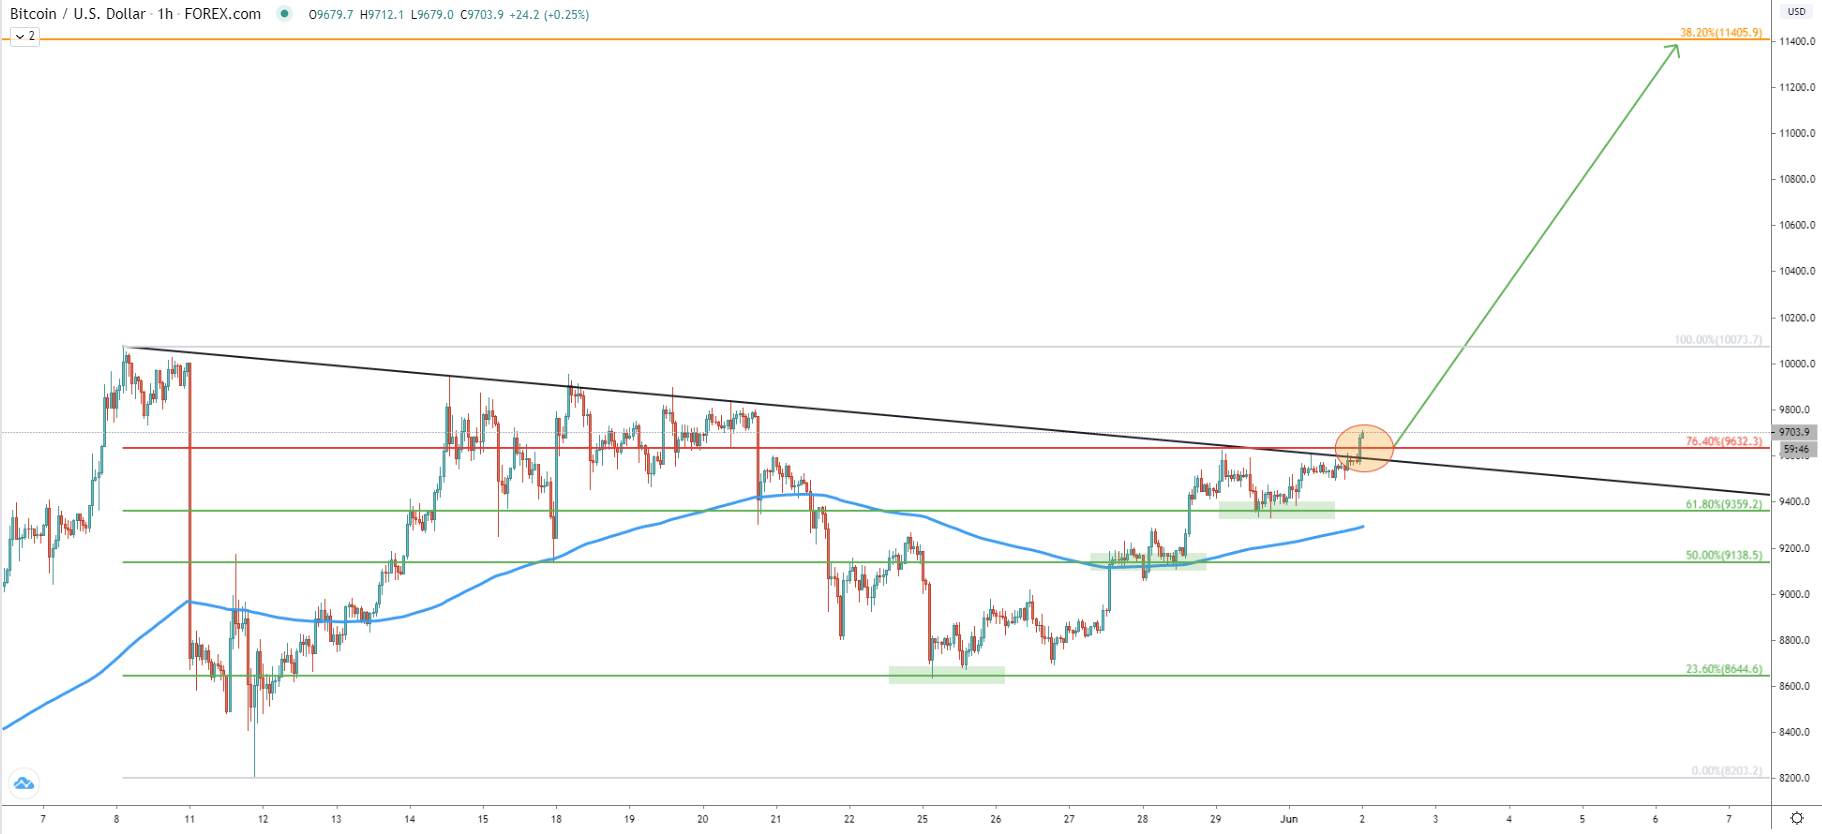
On the 1-hour timeframe, there is a very bullish tendency based on the consistent rejection of the Fibonacci retracement levels. At first, price rejected 23.6%, then 50%, and finally 61.8% Fibs. Right now we can see the break above the 76.4% Fibs resistance at 9632 along with the breakout of the downtrend trendline. It looks like the very beginning of the massive growth by Bitcoin for the short and potentially long term.
The long waited Bitcoin uptrend could have begun, considering multiple rejections of the support levels and break above the downtrend trendline. This can result in either a short term growth or a massive exponential rally towards a new all-time high.
Considering the expectancy for the short to medium term price action, BTC/USD should be heading towards $11400 resistance in the coming days. But at the same time, break above this level could push the price towards the $20k area and even higher.
As per the Daily chart, the key support level is seen at 8175, which is 88.6% Fibonacci retracement level. The daily break and close below this price will invalidate bullish outlook and Bitcoin should be heading down to re-test the uptrend trendline near 5.5k area. It is probably worth mentioning that such a scenario has an extremely low probability.
Support: 8618, 8175
Resistance: 10000, 11400


