
Published: March 17th, 2021
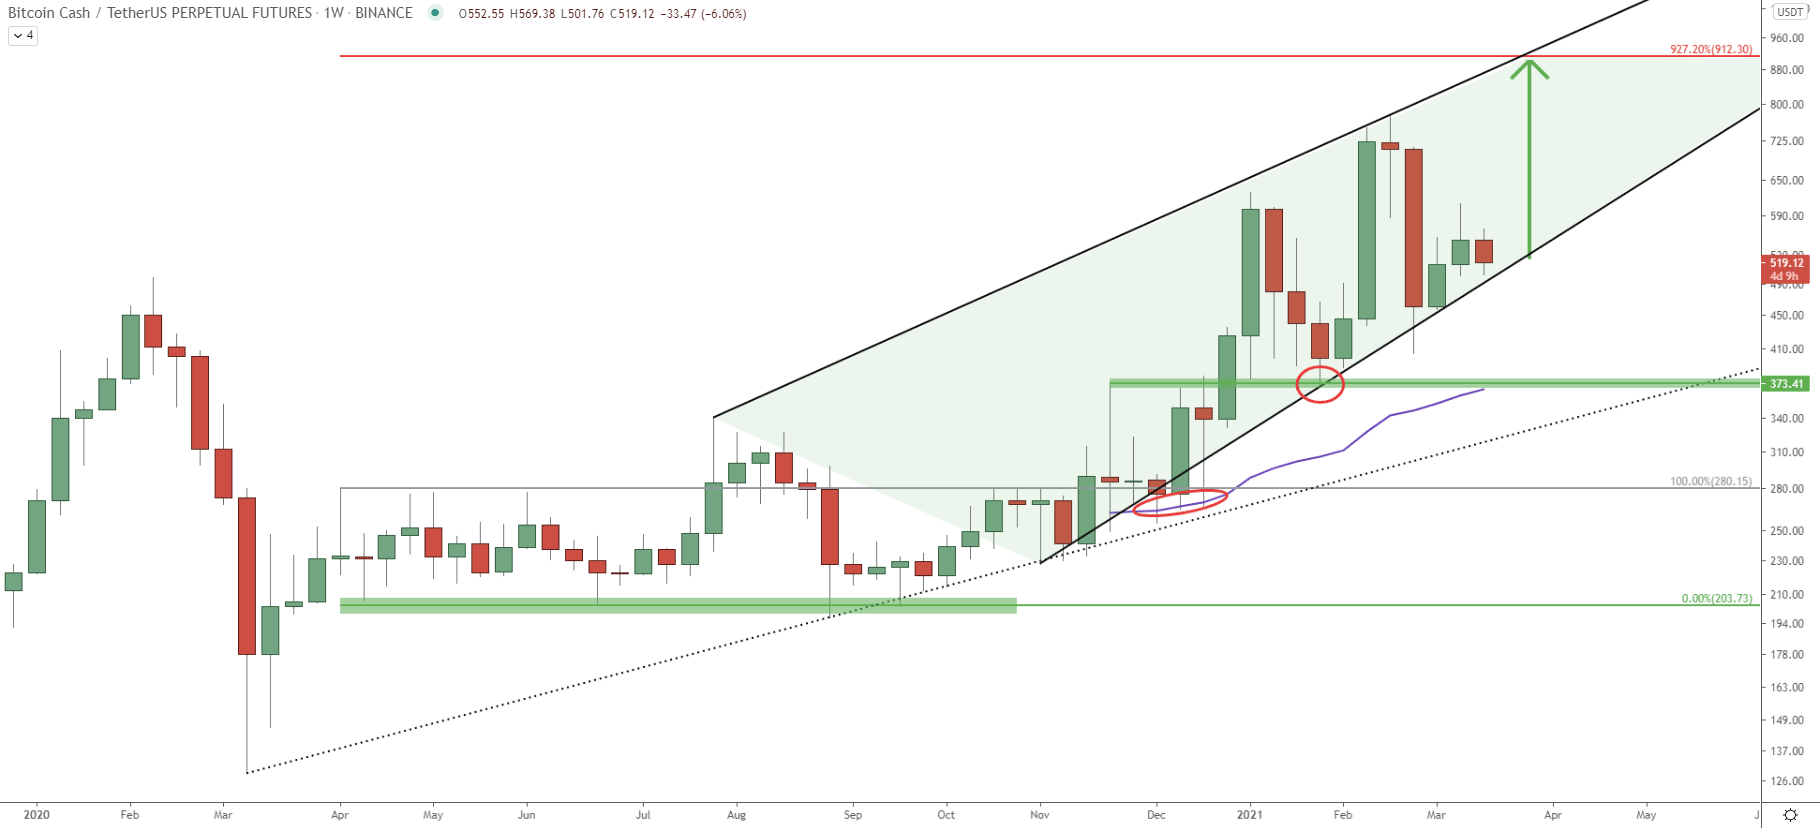
On the weekly chart, Bitcoin Cash price has been steadily rising since the end of August 2020. At that time a massive support area has been formed near the $200 psychological level, which has been rejected three consecutive times. After the last bounce, in August 2020, the price has been moving slowly, but after rejecting the simple uptrend trendline and then 50 Exponential Moving Average, BCH/USDT rise started to accelerate.
Price has reached $777 high and currently remains within the ascending wedge pattern. Back in Januarry2021, BCH price pulled back and bounced off the $373 support area, which previously acted as the resistance. This suggested the continuation of the uptrend, and in fact, the uptrend was intact once again. After reaching $777 high, BCH/USDT price went down very sharply, entering the $400 support area.
Price has bounced off the uptrend trendline yet again, confirming the validity of an uptrend. Perhaps the next big move is just around the corner and Bitcoin Cash might be moving up towards the $900 resistance area. This is the 927.2% Fibonacci retracement level, which has been applied to the downside correction that occurred back in April 2020. But we’ll talk about the importance of this resistance in just a moment.
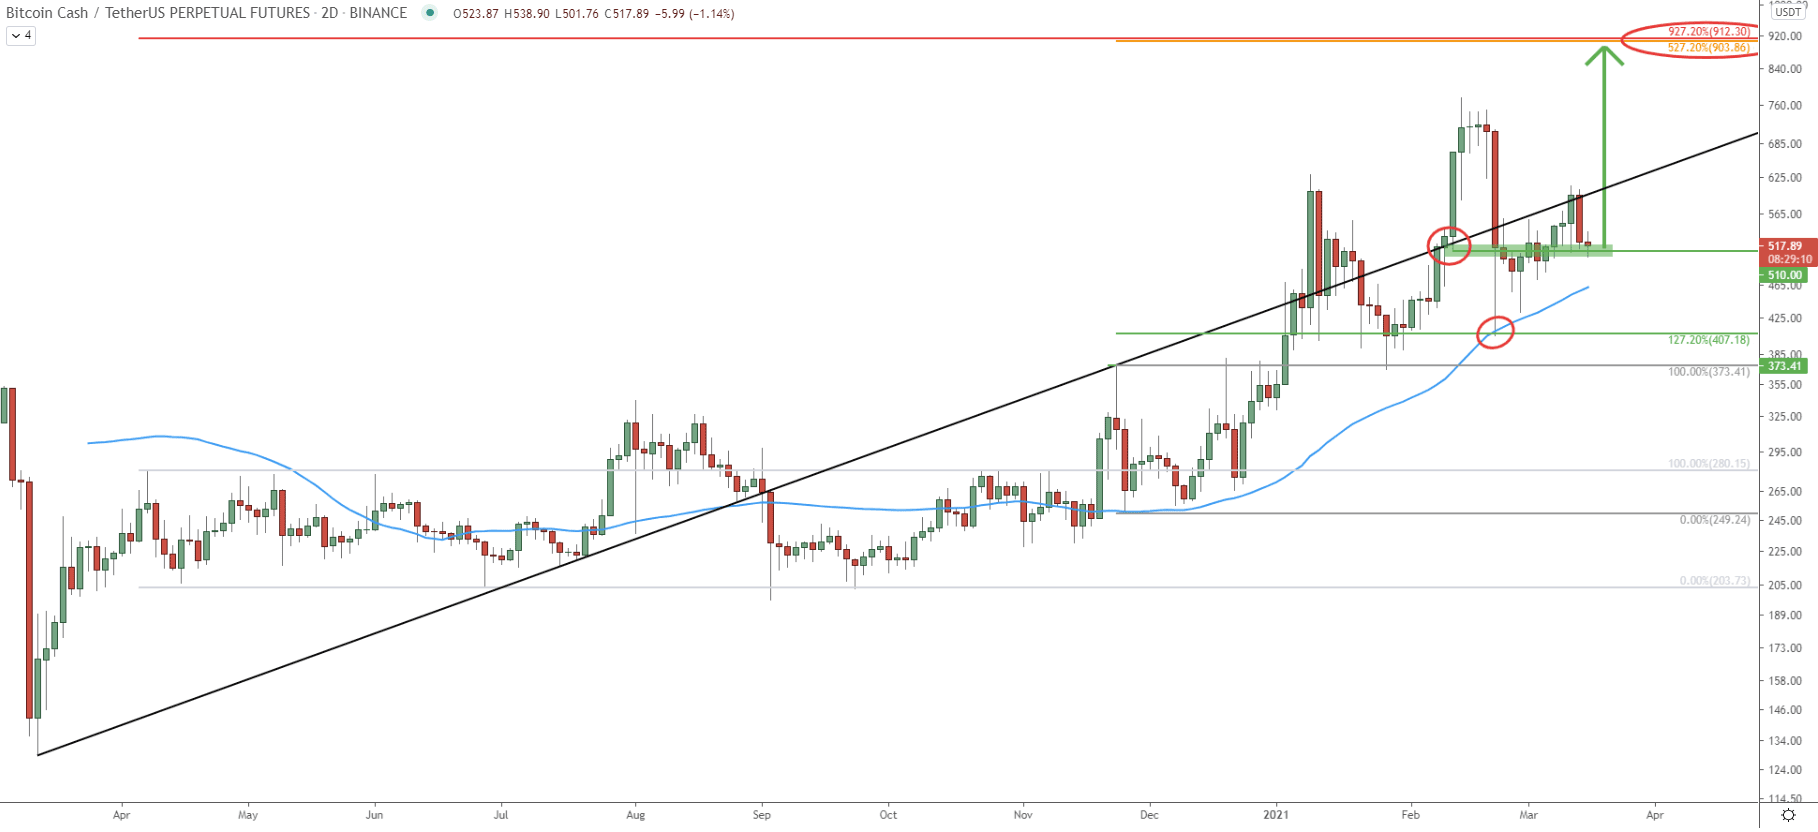
Moving on to the 2-day chart, the price has been dancing around an average-price uptrend trendline. In February, the trendline got rejected, and after the breakout, the daily low was established at $517. During the past few weeks, this level has been acting as the support, and in fact, there was no daily close below.
After the price topped out, correction down was stopped right at the 50 Simple moving average which also corresponds to the 127.2% Fibonacci retracement level at $407. Therefore, the uptrend is still intact, and considering that price is currently right a the support, it would be reasonable to assume that the demand might start to increase, thus the price is highly likely to move up.
In regards to the resistance, on this chart it is confirmed by 2 Fibonacci retracement levels, First is 927.2%, while the second is 257.2% Fibs, applied to the corrective move down where price bounced off the 50 EMA back in November 2020.
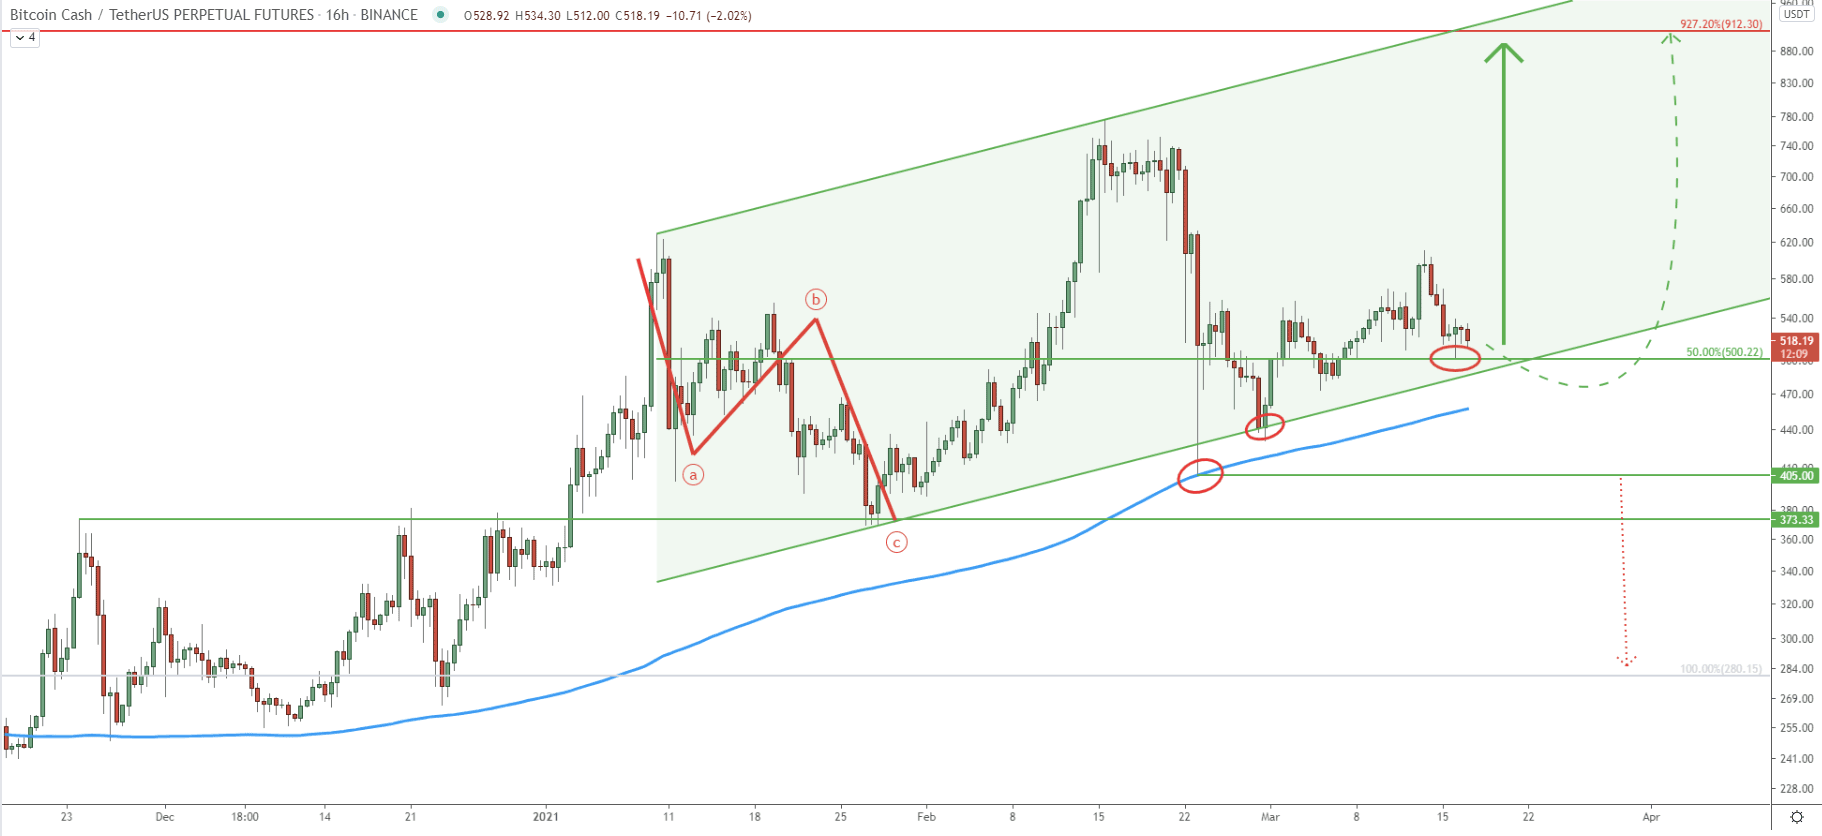
Price is moving within the ascending channel since the beginning of the year. In fact, there was a corrective ABC pattern, based on the Elliot Wave theory. This implies the continuation of the major trend, which is obviously bullish. The recent correction resulted in the bounce off the 200 SMA as well as the bottom of the ascending channel, forming a support near the $400 psychological level.
As long as the price remains above $400, the uptrend should be considered valid. Yesterday, BCH cleanly rejected the 50% Fibs at $500, which is yet another psychological support that has been respected. Of course, there is a possibility that the price will attempt to break below the $500 support, but as long as the daily closing price is above this level, buyers will continue to strongly dominate.
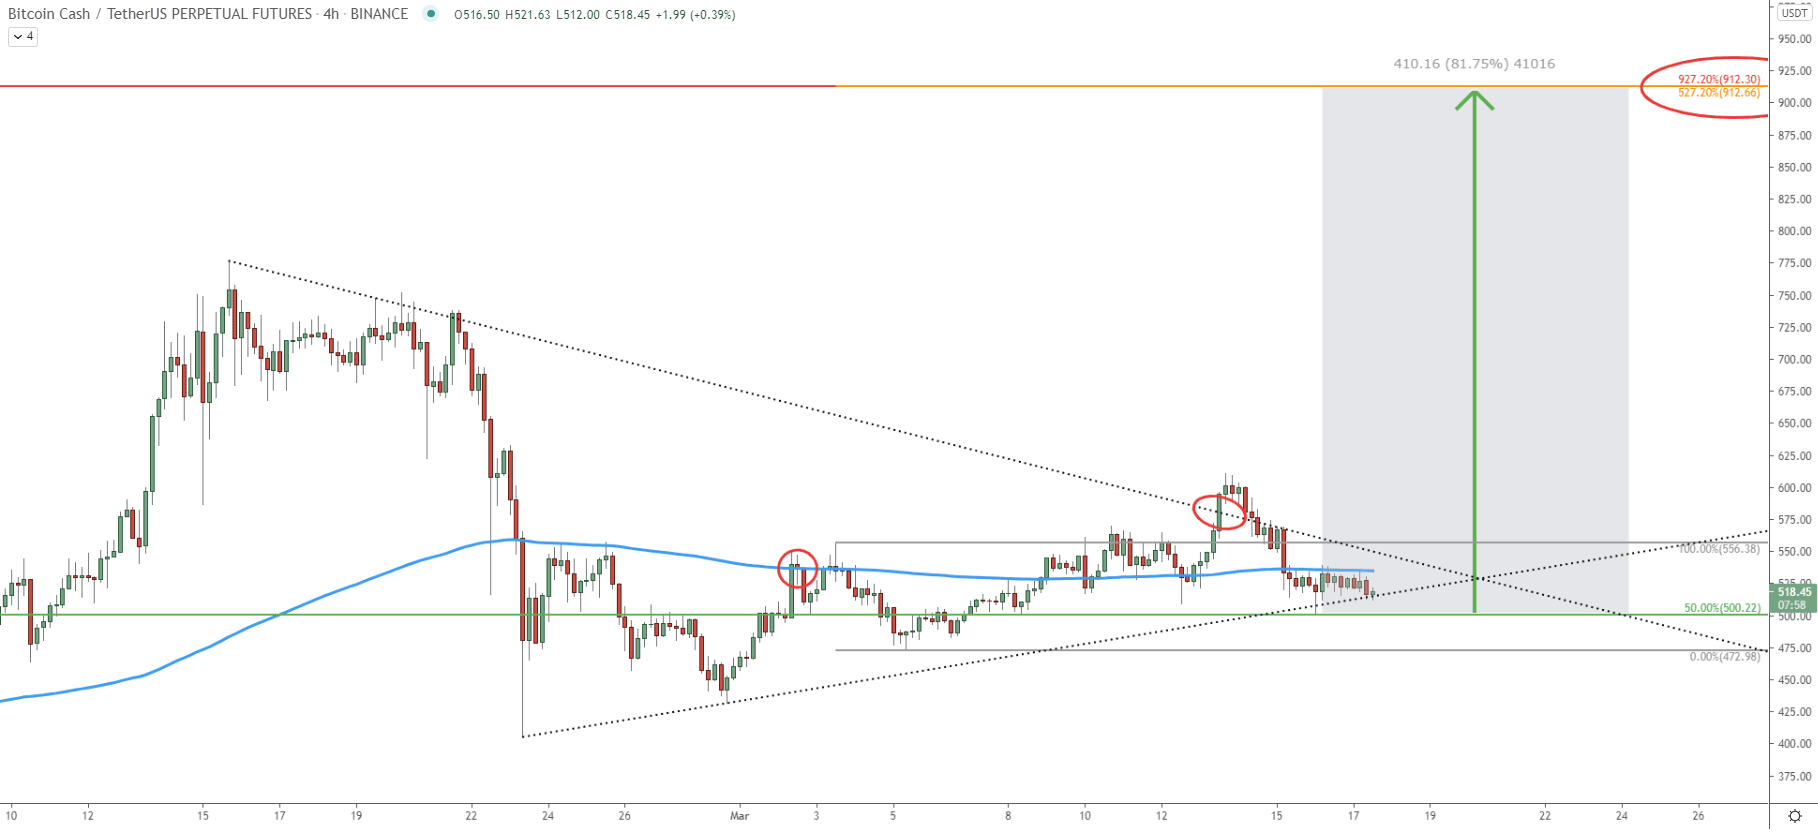
On the 4-hour chart, BCH/USDT price has been stuck within the triangle pattern. However, on March 14, the price finally broke above the downtrend trendline, showing an increasing bullish pressure. But then the price went down, to re-test the uptrend trendline, which is right now being rejected. Truly there is a very strong support near $500 because we already saw a bounce off the 200 EMA, which hasn’t been broken and still acting as the support. There was also a bounce of the Fib support, the bounce of the psychological level as well as the uptrend trendline.
Such price action goes to show that the probability is highly in favor of an uptrend continuation towards the $900 or even $1000 in the coming weeks. And on this chart, we have the 3rd confirmation of the $912 being a strong resistance and the potential supply zone. It is now also confirmed by a 527.2% Fibs applied to the pullback after the price broke above the 200 EMA.
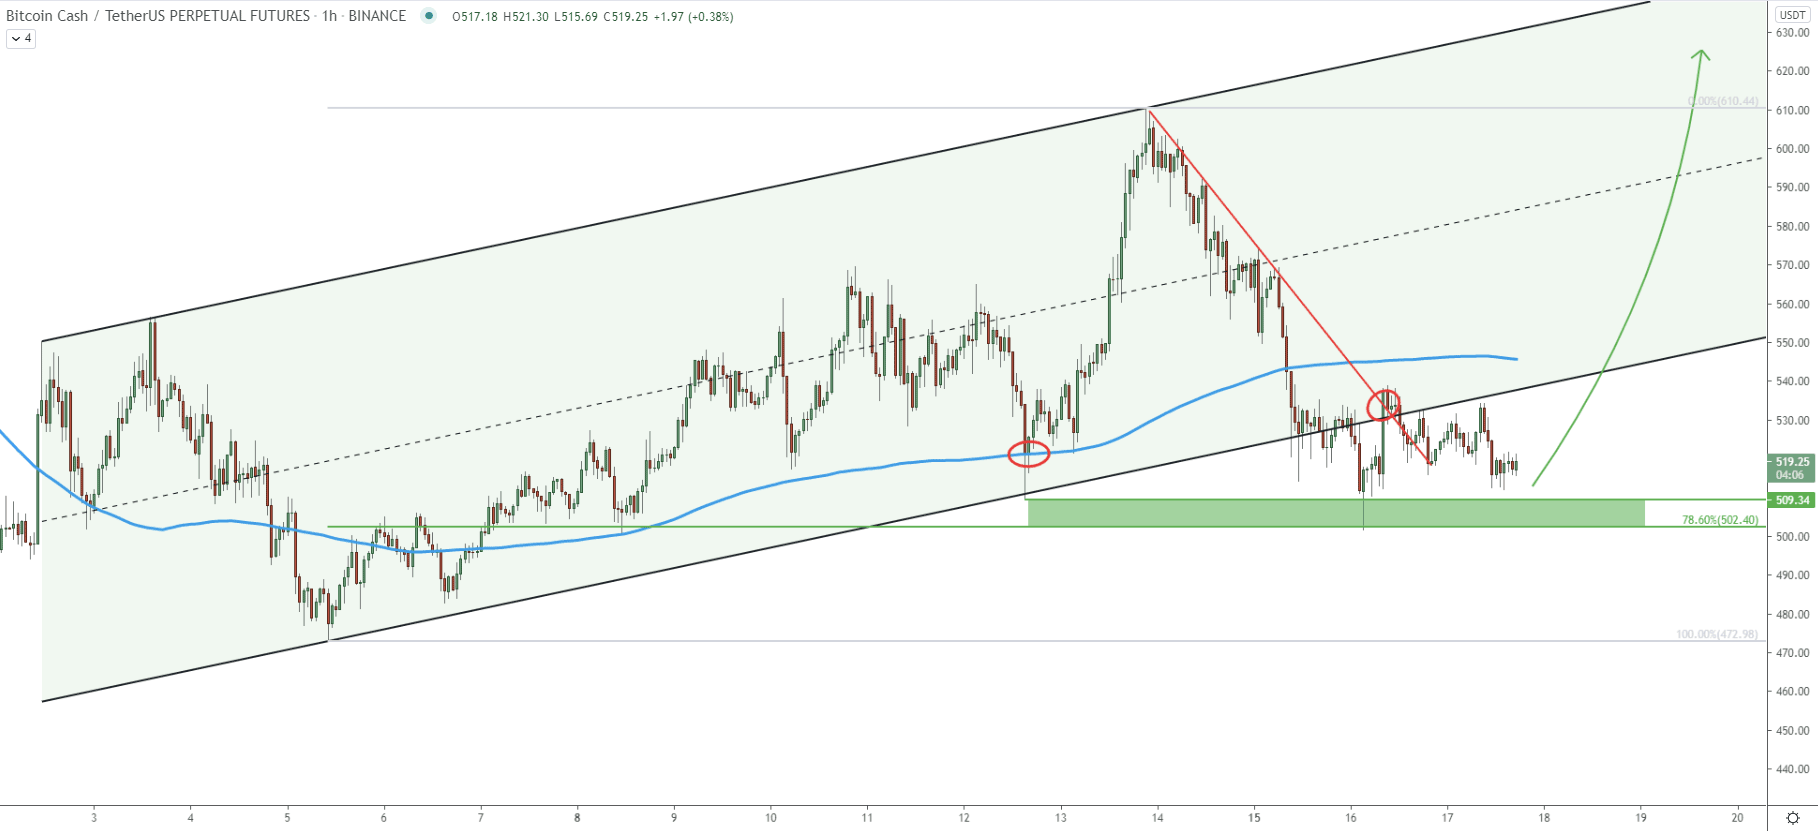
Finally, a 1-hour chart where the price is also moving within the ascending channel. On March 12, the price bounced off the 200 EMA as well as the bottom of the channel at $509. Overall, the support area has been established between $500 and $510 and it is highly likely that buyers will be stepping in while the price remains in this demand area. Besides, the final bullish confirmation could have been the break above the downtrend trendline, which has occurred without any hesitation.
The Bitcoin Cash price has been trading near the key demand area during the past week. While there are multiple confirmations that the trend remains bullish, it should be expected that buyers would be interested to buy BCH while it is near or in the key domain zone between $500 - 510.
As per the weekly, 2-day, and 4-hour chart, the nearest and strongest upside target is located at $912 and is confirmed by 3 different Fibonacci retracement levels.
As per the 16-hour chart, the key support is at $405. Therefore, as long as the $400 psychological level is being respected, the trend will remain bullish. On the other hand, a break below this level will invalidate the bullish outlook and BCH/USD can be expected to move lower, potentially towards the $300 area.
Support: 400, 500
Resistance: 900, 1000


