Published: July 30th, 2024
Bitcoin Cash (BCH) emerged out of a tough fork of the original Bitcoin in 2017 due to arguments about suggested changes within the Bitcoin community. Similar to its forerunner, Bitcoin Cash uses a Proof of Work (PoW) mechanism, has a 21 million coin supply cap and experiences a halving event every four years. The current payout for mining Bitcoin Cash is 6.25 BCH.
The block size is a key difference between Bitcoin and Bitcoin Cash; while Bitcoin allows blocks of up to 1 MB, Bitcoin Cash allows blocks of up to 32 MB. With this bigger block size, Bitcoin Cash can handle more transactions at the same time.
The recent price increase demonstrates how investors, particularly retail traders, are becoming more interested in less expensive alternatives to Bitcoin, which is trading for roughly $70,000 per unit.
Even though Bitcoin is still one of the most expensive crypto assets, Bitcoin Cash and other hard forks offer more affordable investment options, making full ownership difficult for certain investors.
Part of the reason for the recent rise in Bitcoin Cash is Kraken's effective delivery of both Bitcoin and Bitcoin Cash to consumers affected by the 2014 Mt. Gox hack. This distribution, which happened on July 27, 2024, was a big step toward the resolution of the protracted Mt. Gox case.
Let's see the further aspect of this crypto from the BCH/USDT technical analysis:

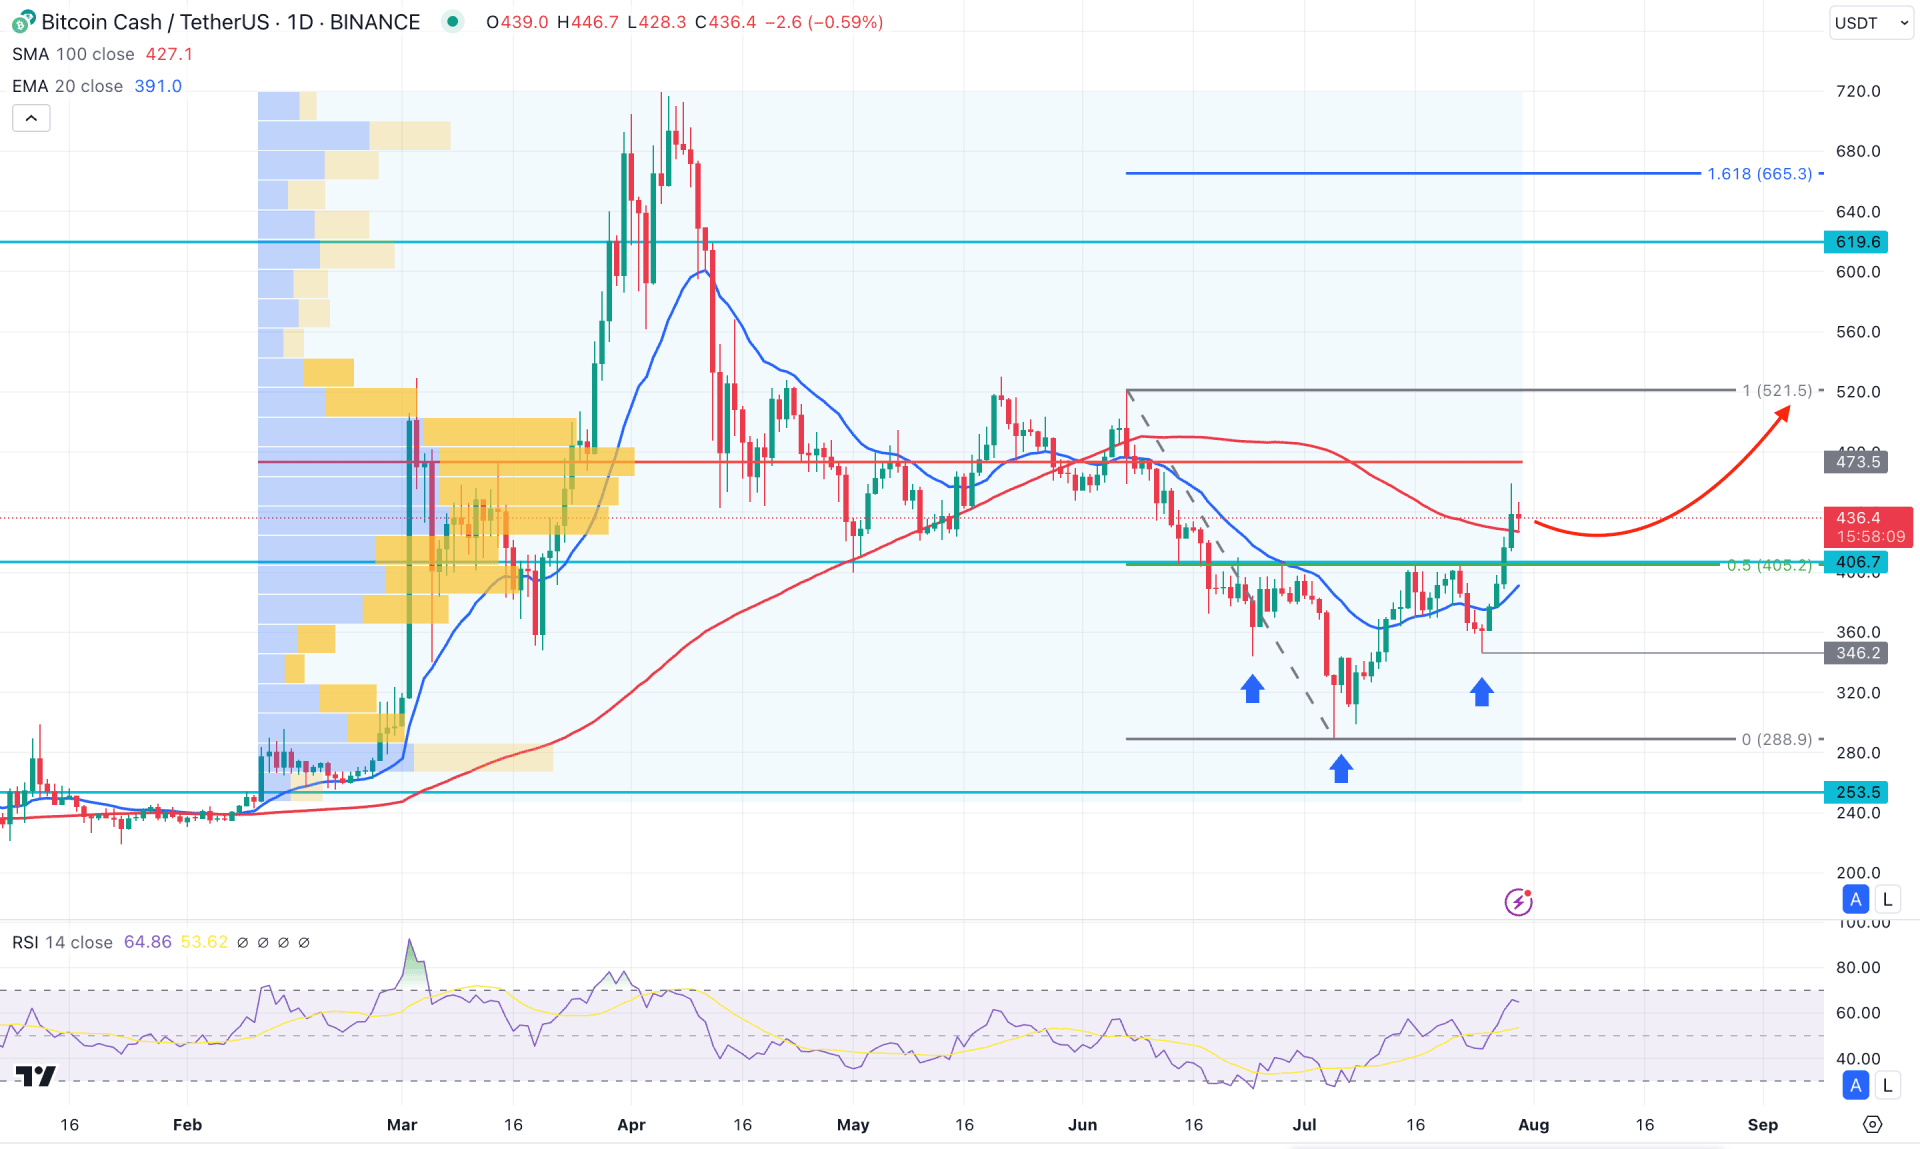
In the daily chart of BCH/USDT, the ongoing market momentum is bullish as an upward pressure is visible from a valid bottom.
In the higher timeframe, the recent price trades sideways, while the current price is still trading within the bullish body created on the March 2024 candle. Moreover, the three inside bar candlestick pattern supports the recent bullish recovery, which might work as a strong bullish continuation signal.
In the volume structure, the most active level since February 2024 is still above the current price. It is a sign that the long-term bulls need more push to overcome the high volume line before validating the long-term bull run.
In the daily chart, the ongoing buying pressure is visible from the valid Inverse Head and Shoulders pattern breakout, where the current neckline of 406.70 is likely to work as an immediate static support. Moreover, the existing swing low of 346.20 would be a major barrier in this structure. As long as the current price trades above the 346.20 low, we may expect a stable bullish continuation.
In the indicator window, the Relative strength index (RSI) rebounded above the 50.00 neutral line, suggesting a stable buying pressure.
Based on the daily market outlook, the ongoing buying pressure is likely to extend towards the 665.30 level, which is a crucial 161.8% Fibonacci Extension level. In that case, a stable market above the 520.00 high volume line could open the room for reaching the 700.00 psychological line.
On the bearish side, an immediate bullish corrective pressure with a strong bearish reversal from the 478.00 to 520.00 zone. In that case, a valid bearish market below the dynamic 20 day EMA could lower the price towards the 253.56 support level.

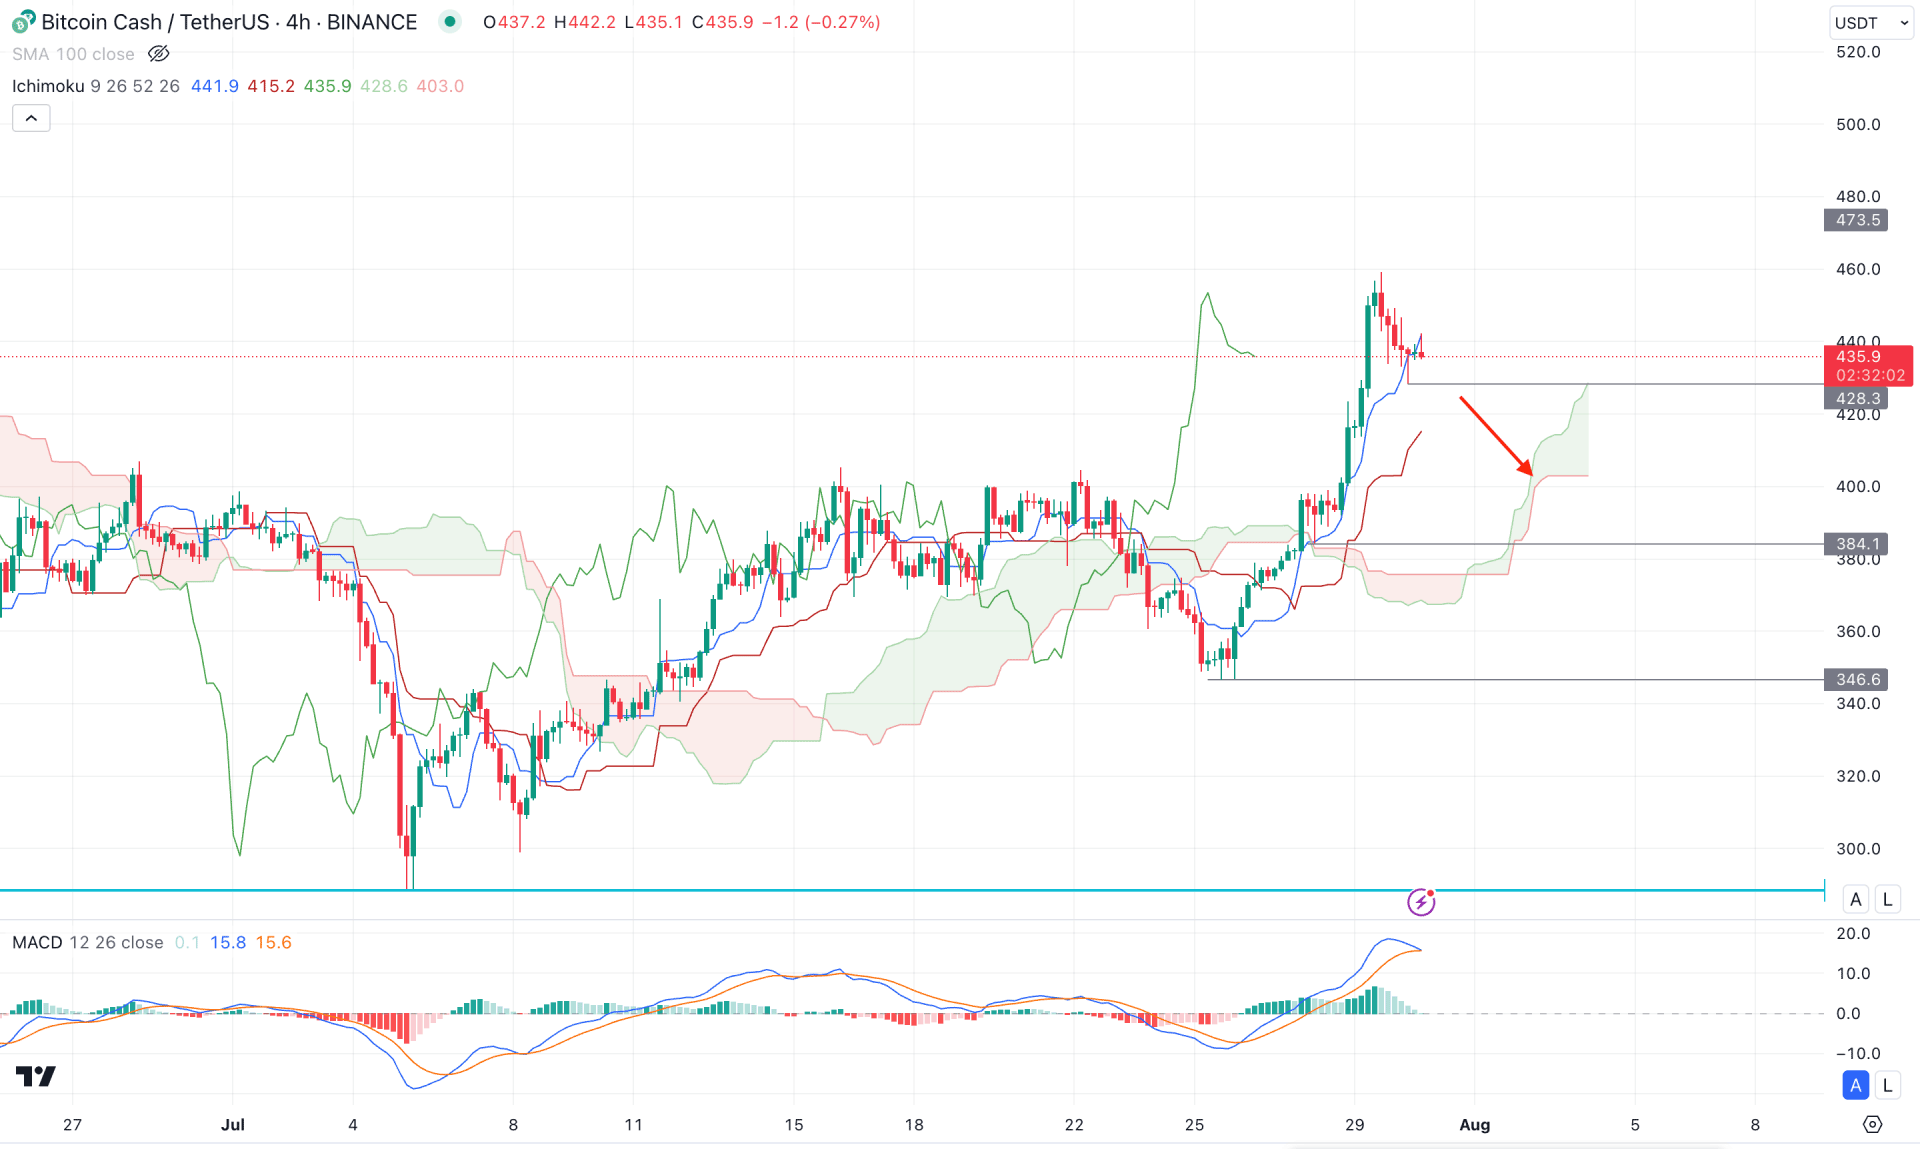
In the H4 chart, the recent price shows a bullish breakout above the cloud zone, suggesting a valid bullish continuation opportunity. In that case, the primary aim of this pair is to look for long trades as long as the cloud zone is working as a support. However, the overextended price from the Kijun Sen level might require a sufficient downside correction, before resuming the existing trend.
In the indicator window, the MACD Histogram aimed lower and reached the neutral point, while a bearish crossover was visible in the signal line. It is a sign that a downside pressure is likely to come, even if the broader market trend is bullish.
Based on the H4 outlook , the primary aim for this pair is to look for a bearish correction, after having a valid H4 candle below the 428.30 support level.
On the other hand, any immediate bullish recovery from the 400.00 to 384.00 zone might resume the existing trend towards the 550.00 area.

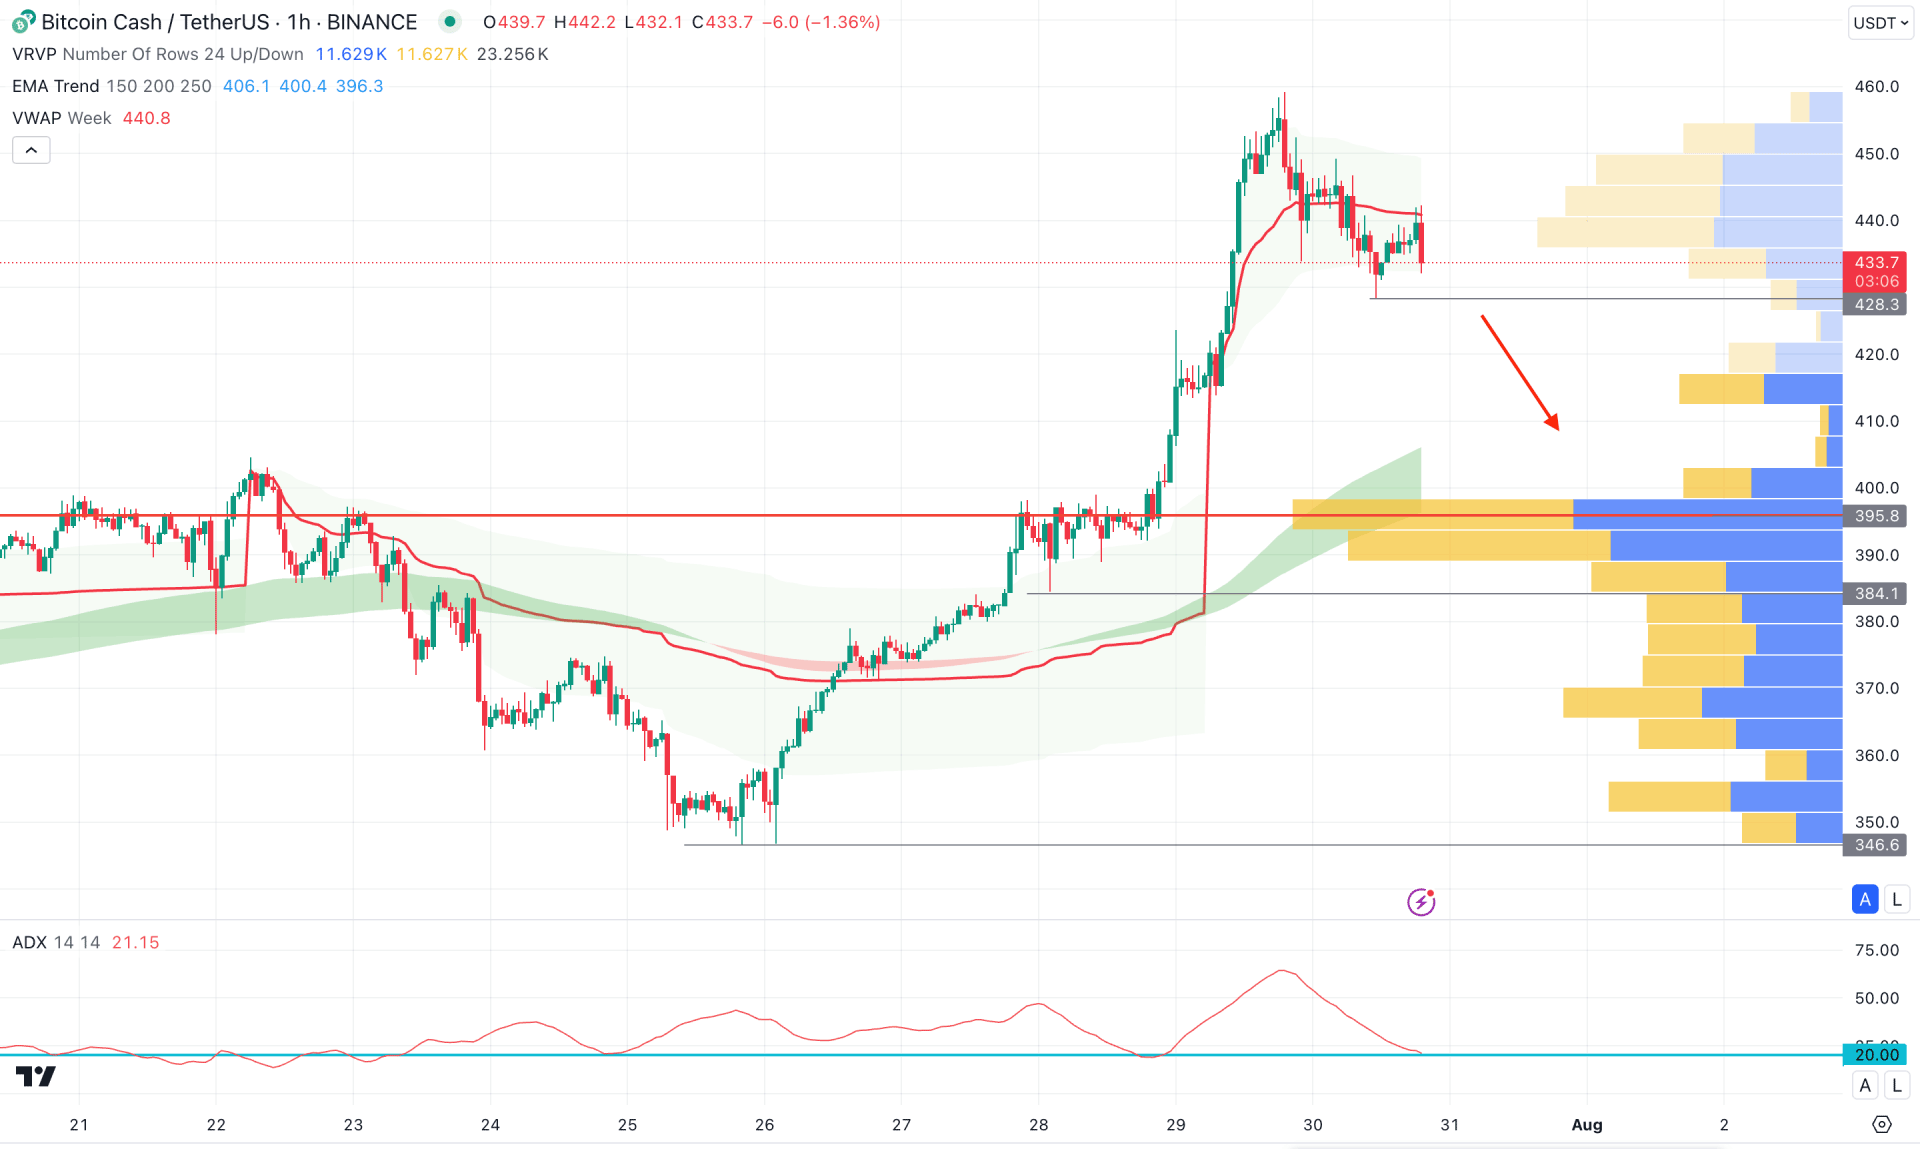
In the hourly chart, the ongoing buying pressure is visible, where the current price is overextended from the previous swing low.
On the other hand, the most recent price moved below the weekly VWAP level, suggesting a profit taking by bulls. In that case, investors should monitor how the profit-taking phase ends before finding a continuation opportunity.
Based on the hourly structure, a downside pressure below the 428.30 support level with an hourly close could lower the price towards the 395.80 static support level. However, a bullish rebound from the 428.00 to 400.00 zone with the ADX above the 30.00 level might open a long opportunity, aiming for the 460.00 level.
Based on the current market outlook, BCH/USDT has a higher possibility of moving higher, following the daily inverse Head and Shoulders breakout. Investors should closely monitor the intraday price, as a valid bullish rebound after the profit taking could resume the existing trend.