
Published: August 30th, 2023
On Tuesday, Bitcoin Cash experienced an upswing following reports of Grayscale, a cryptocurrency firm, winning a legal appeal against the U.S. Securities and Exchange Commission (SEC).
Within the last 24 hours, Bitcoin's value has surged by 7%, while Bitcoin Cash has seen a remarkable 17% increase, reaching a value of approximately $223 level.
Bitcoin Cash originated from a blockchain split from Bitcoin in 2017 and has since maintained its existence as a distinct asset and network. Although currently ranked 18th in market capitalization according to CoinGecko, its price and market cap are significantly smaller than the original Bitcoin.
A significant legal development has arisen as a judge has mandated a reevaluation of the SEC's rejection of Grayscale's application for a Bitcoin ETF (Exchange-Traded Fund). This judgment, as handed down by the U.S. Court of Appeals for the D.C. Circuit on Tuesday, holds notable significance for the cryptocurrency realm. The SEC had been dismissing spot Bitcoin ETF applications, which enable investors to engage with Bitcoin's value without owning the actual coin, for around a decade.
The impetus behind this upward trajectory can be attributed to a significant ruling from the U.S. Court of Appeals for the D.C. Circuit. The court deemed the SEC's rejection of Grayscale's application to convert its Bitcoin Trust (GBTC) into a formal Bitcoin spot exchange-traded fund (ETF) unjustified.
The overall development is positive for Bitcoin Cash, but a proper decision might come after the price analysis.
Let’s see the current price projection of Bitcoin Cash from the BCH/USDT technical analysis:
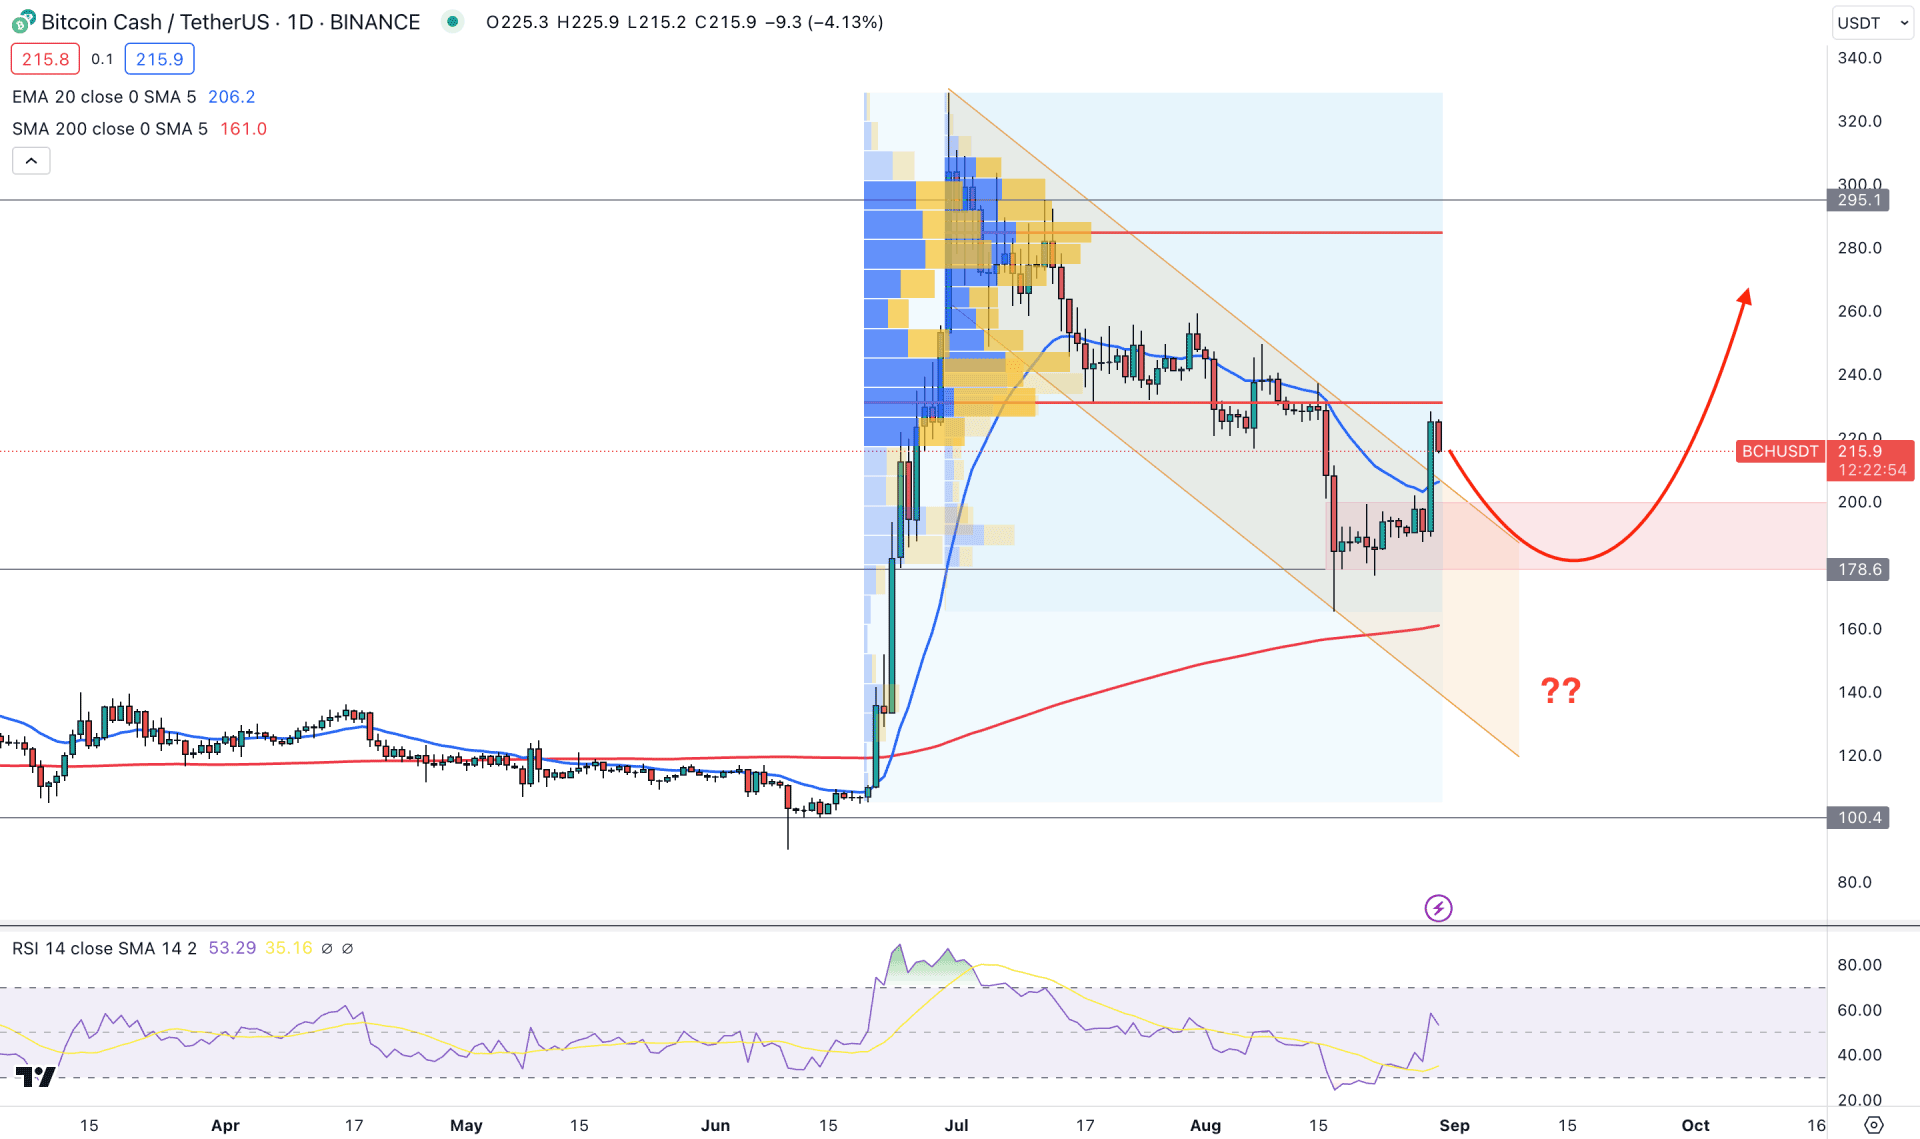
Bitcoin Cash (BCH) trades within a corrective momentum in the daily price. The most recent price is backed by strong support from the 200-day Simple Moving Average, while no significant sign of a bullish continuation is seen.
The higher timeframe price action shows a strong buying possibility as the bearish correction in July and August is still above the 50% Fibonacci Retracement level from the strong bullish candle of June. As bulls hold the price as a bullish inside bar formation, any bullish trend trading could work well in the daily price.
In the current volume structure, the largest activity level since the June 2023 low is at 231.00 level, which is just above the current price. Another high volume level since the 30 June high is at 284.30 level, which is 32% above the current price. As per the volume structure, the existing selling pressure from 328.90 is potent, which may resume the current bearish trend.
The daily chart shows a bullish trend continuation formation from the descending channel breakout, which came with a daily candle close above the channel breakout. The 20 EMA also supports the channel breakout, while the 200-day SMA is major support at the 161.20 level.
Based on the daily price outlook, the 14-period Relative Strength Index (RSI) shows buying pressure by moving above the 50.00 level. In that case, the primary buying pressure may come from the 207.00 to 180.00 zone, but a daily candle above the 231.00 level could be a conservative buying approach. In both cases, the primary target level is the 300.00 level.
On the other hand, the downside pressure with a daily close below the 175.00 level could indicate a strong downside possibility towards the 100.00 key psychological level.
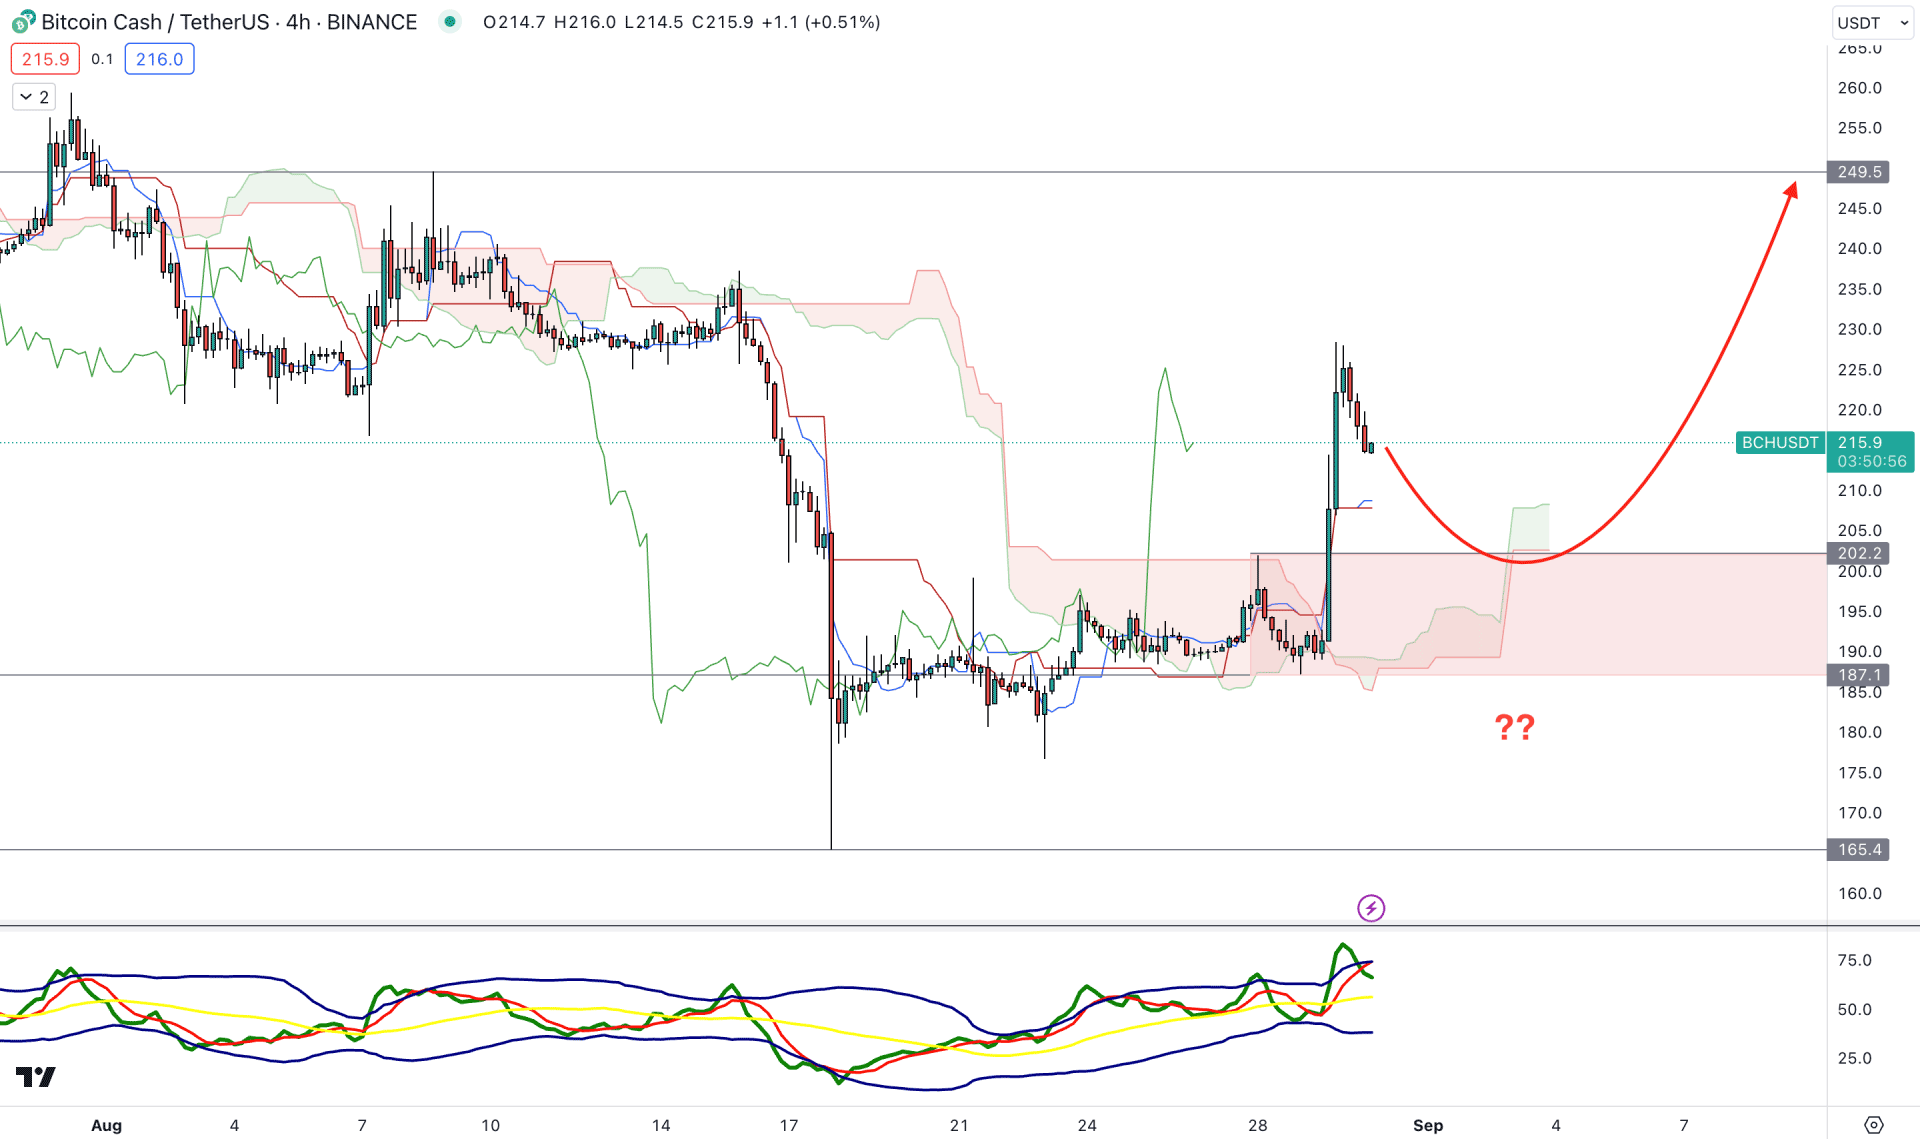
The H4 chart shows a strong bullish breakout above the cloud zone, supported by a bullish flip in the future cloud. Moreover, the dynamic Tenkan Sen and Kijun Sen levels are below the current price, working as support.
The Traders Dynamic Index indicator is a unique tool to show buyers/sellers' activity in the market. As per the current reading, bulls are aggressive, as the current TDI level is above the 50.00 line. However, a bearish rebound is possible, which can lower the TDI level to the 50.00- 40.00 area.
Based on the H4 outlook, a downside correction is possible in this instrument, but any bullish signal from the 202.00 to 187.00 area could increase the price toward the 250.00 level.
The alternative approach is to wait for a strong, bearish H4 candle below the 186.00 level before aiming for the 164.00 area.
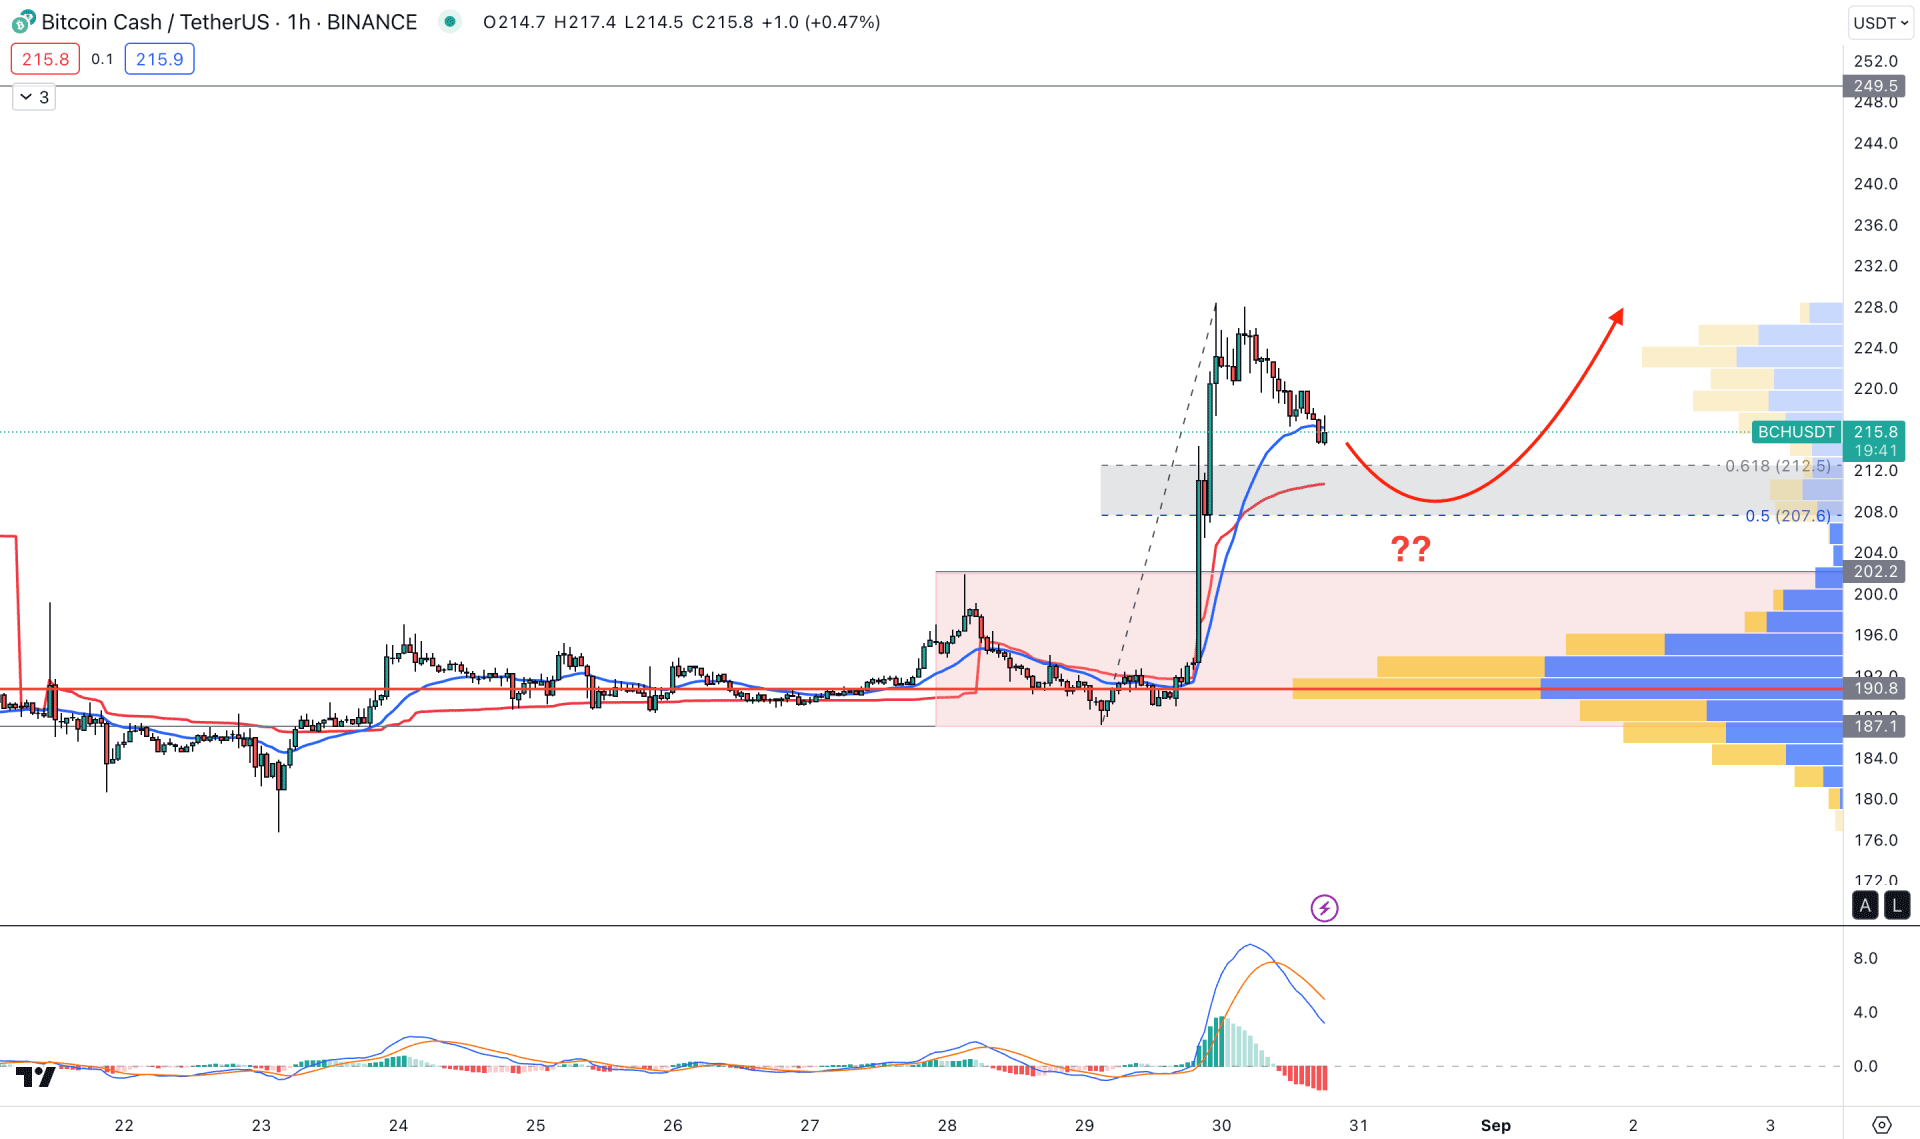
In the H1 chart, a strong bullish breakout is clear, showing the price trading above the visible range high volume level with a bullish impulsive pressure.
The near-term order block with the breaker at the 212.50 to 207.00 area could be the primary target of the bearish correction, from where any strong bullish signal is needed to open a long entry.
The dynamic 20 EMA and weekly VWAP are closer to the OB area, suggesting buyer pressure in the Market. Moreover, the current MACD Histogram reached the oversold zone, which needs a sufficient bullish correction.
A bearish H1 candle below the 207.00 level could extend the downside correction towards the 190.00 high volume zone, but breaking below the 180.00 level could eliminate the buying possibility.
Based on the current market outlook, BCH/USDT will likely increase the upside pressure in the coming days. However, proper validation is needed from the lower timeframe, where any significant bullish rejection from the H1 support could be an early buying opportunity.


