
Published: September 7th, 2021
Bitcoin cash is a peer-to-peer electronic payment system with fast execution and lower fees. It is like the physical money like dollar bills that a person can send directly to another person. Moreover, this system does not require any intervention from the central bank or the third party as it does not rely on any middleman such as banks or payment service providers.
In 2017, the Bitcoin project and its community were divided into two categories from Bitcoin's scalability. As a result, the hard fork created Bitcoin Cash, a new cryptocurrency as peer-to-peer electronic cash. The unique feature of Bitcoin Cash is to meet the demand of a global payment system. Moreover, the larger block can handle more transactions per second with a minimum fee, which is often hard to find in Bitcoin’s BTC Network.
Bitcoin cash positively correlates with the Bitcoin that pushed the price to follow the same direction during the broader crypto market crash. At that time, Bitcoin Cash found a bottom at 384.00 level from where a strong bull run happened.
Let’s see the upcoming price direction from the BCH/USDT technical analysis:
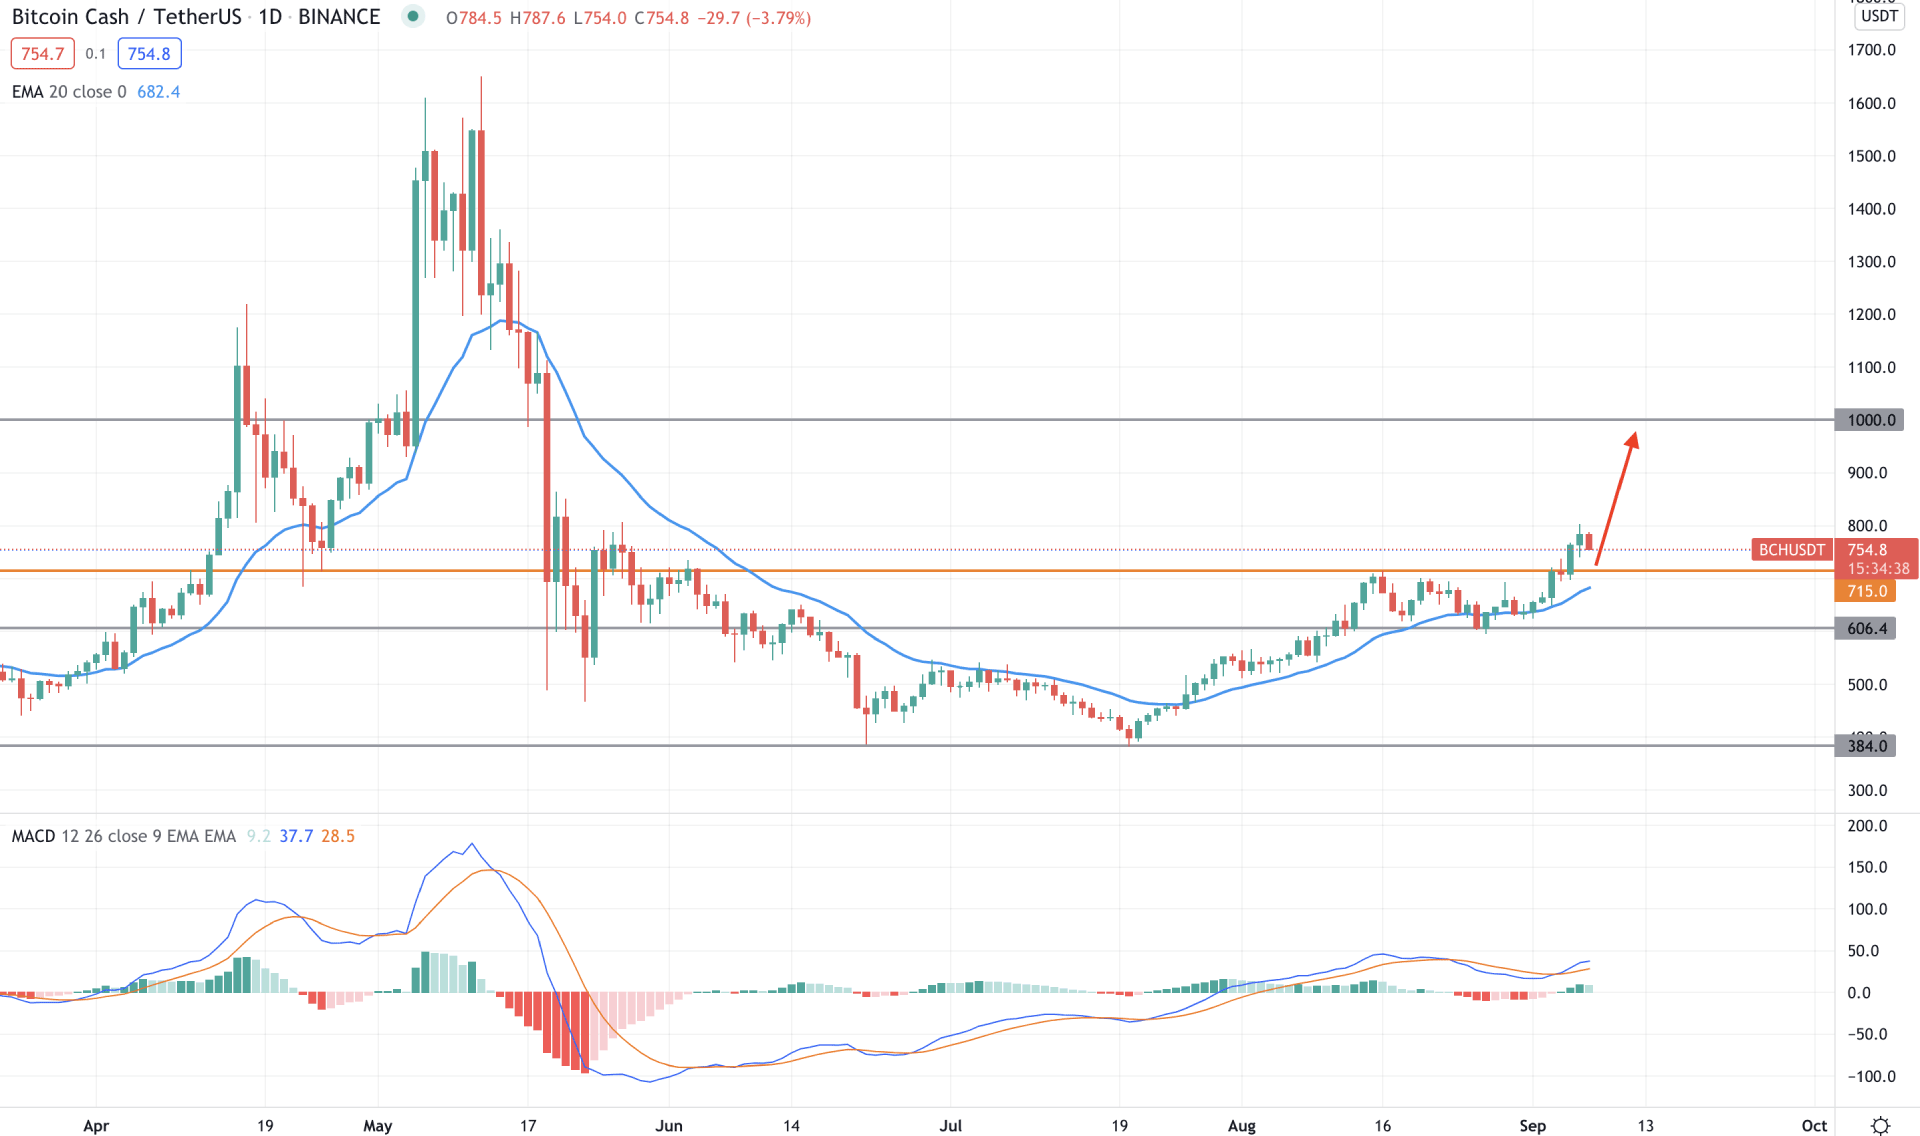
BCH/USDT reached the 1650.00 all-time high during the upside pressure of the broader crypto market during the post-pandemic recovery. After that, however, the price crashed due to China’s crypto ban and concerns about mining electricity usage.
The situation had changed when buyers took the price above the dynamic 20 EMA with a bullish daily close. After that, the price grew and moved above the 715.00 event level with a bullish daily candle. Therefore, as long as the price is trading above the 715.00 event level, it may move higher towards the psychological 1000.00 level.
The above image shows how the price is trading above the 715.00 event level where the gap between the dynamic 20 EMA and the current price has extended with a possibility of a bearish correction. Meanwhile, MACD Histogram is still bullish where the MACD Lines are above the Histogram. Therefore, any bullish rejection from the 715.00 area or dynamic 20 EMA may extend the bullish pressure in the coming days.
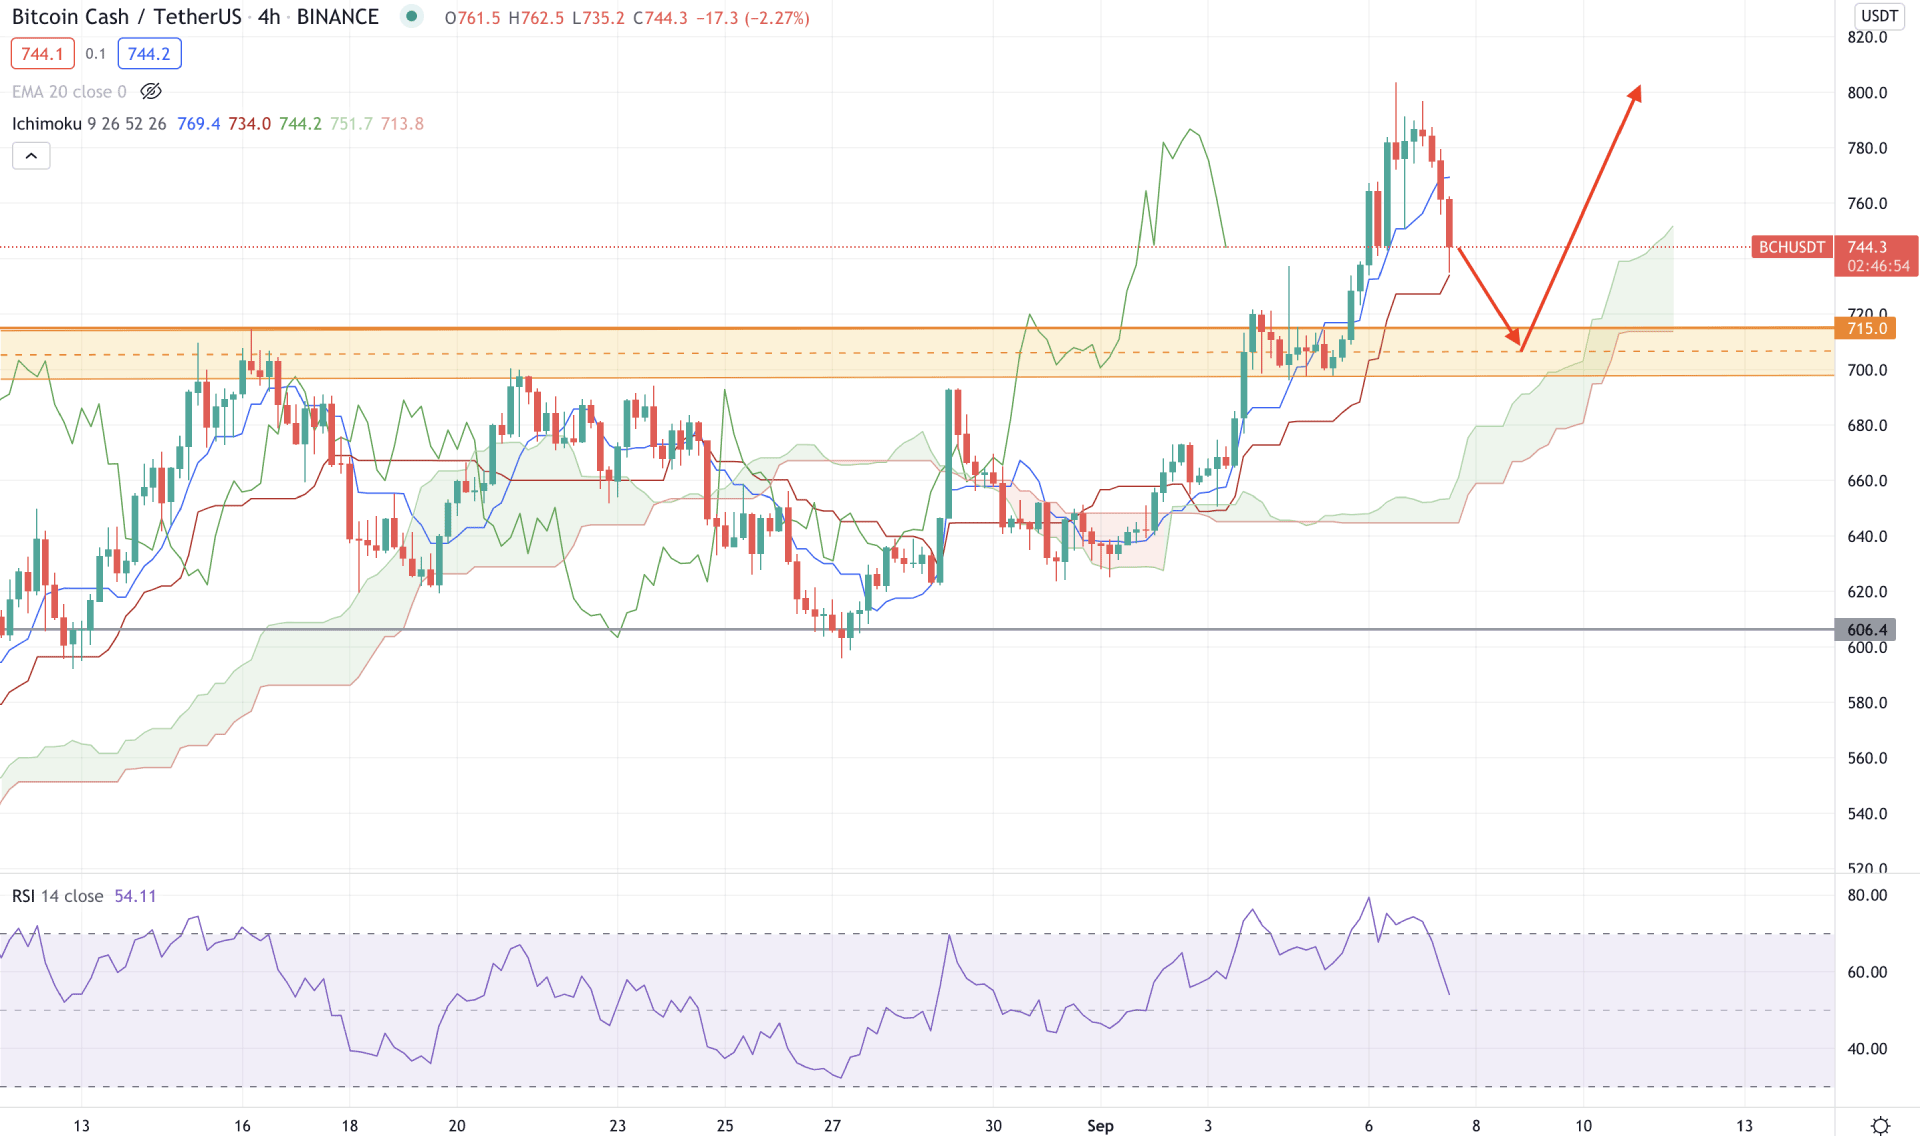
According to the Ichimoku Kinko Hyo, the price became extremely bullish after breaking above the Kumo Cloud. Moreover, the price moved above the 715.00 event level with an impulsive pressure while the future cloud and lagging span are bullish.
In the above image, we can see that the price is trading above the 715.00 level where the dynamic Tenkan Sen and Kijun Sen are working as minor supports. However, the RSI is moving down from the overbought 70 levels that may increase the correction to the price.
Despite the bearish possibilities, buyers should wait for a rejection from the dynamic Kijun Sen or 715.00 to 700.00 demand zone to rely on the possible bullish options. On the other hand, a solid bearish H4 close below the 700.00 level may extend the correction towards the 640.00 support level.
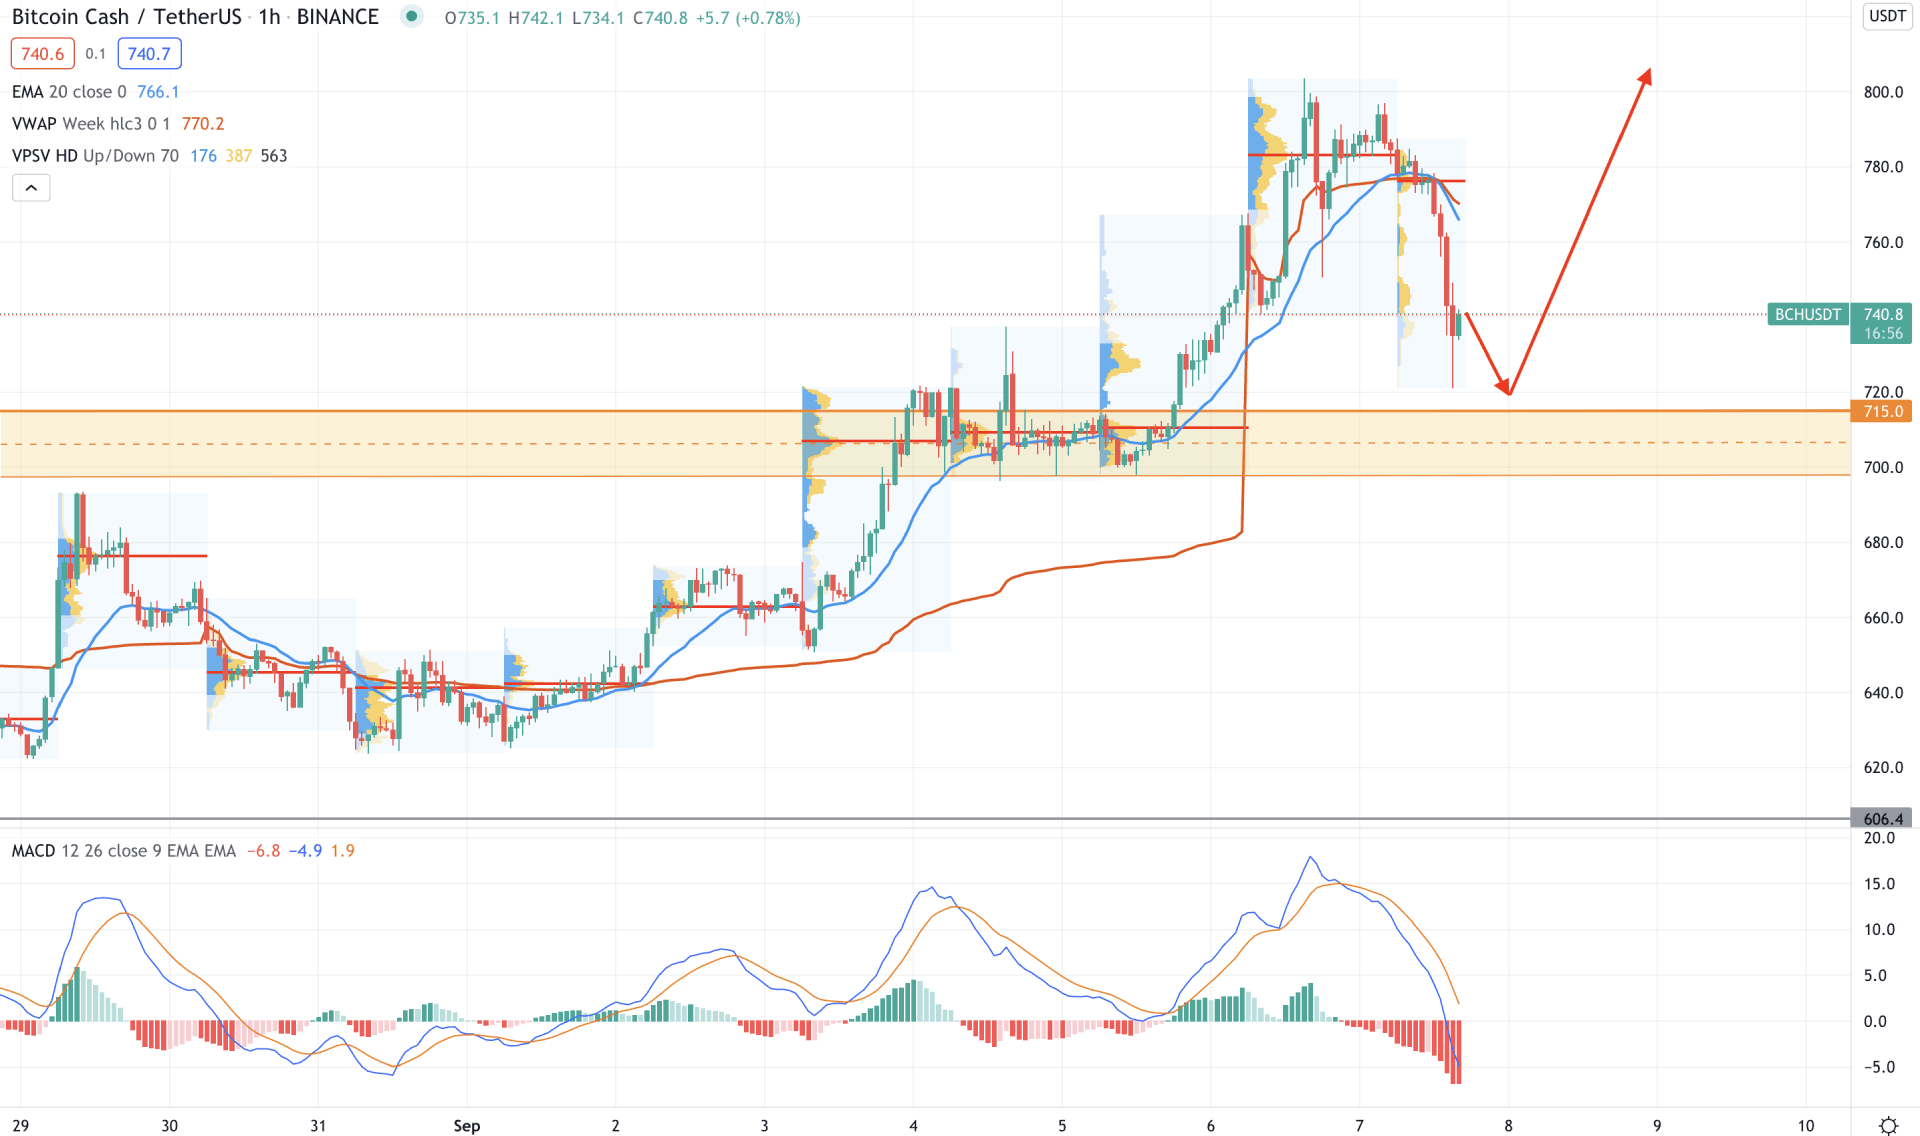
The situation is different in the intraday chart, where the BCH/USDT is trading below the intraday high volume level of 778.00 level with a bearish H1 close. Moreover, the price moved below the dynamic 20 EMA and weekly vwap, increasing the possibility of a bearish correction.
The above image shows how the price moved lower after creating a swing high at the 803.06 level. In the indicator window, MACD Histogram turned bearish and made new lows. Therefore, any failure to make new lows in MACD Histogram with a bullish rejection from 715.00 level may rebound the current momentum to bullish.
However, a bearish H1 close below the 700.00 level may alter the current market structure. In that case, the next support level is at 650.00 level.
As per the above discussion, we can say that the BCH/USDT has a higher possibility of extending bullish pressure until the price is moving down below the 700.00 level with a solid bearish H4 candle. The possible bullish pressure may take the price towards the 1000.00 psychological level, but a solid bearish H4 close below the 700.00 level may initiate a broader bearish correction.


