Published: January 9th, 2025
On Wednesday, Bitcoin (BTC) suddenly fell below $95,000 before rising above it. Except for XRP, which maintained its recent achievements and gained about 2% on the day, altcoins in the leading 5 saw a decline following the crash of Bitcoin, which caused a market-wide drop in the cryptocurrency space.
The investment of institution inflows and adoption of USA-based Spot Exchange Traded Funds (ETFs) drove Bitcoin's 2024 increases. In 2025, the price path of Bitcoin will be influenced by macroeconomic variables and the potency of the US dollar, even though institutional interest is gradually increasing again.
Traders are worried about the ecosystem's health and what to anticipate from altcoins in 2025, as the market value of cryptocurrencies dropped to $3.49 trillion on Wednesday. On a monthly and daily basis, Bitcoin's dominance decreased, remaining at roughly 57%.
Except for Bitcoin, the market capitalization of all digital currencies is still well below the all-time high of $1.71 trillion during the 2021 bull rally. The destiny of the 2025 Bitcoin bull wave is probably still up in the air until this indicator improves.
According to a report released on Tuesday by K33 Research, the average amount of Bitcoin traded on spot markets decreased by 15% per week. Bitcoin and the leading altcoins on derivative platforms are expected to see liquidations in both directions while traders wait for need and buyer urgency to recover.
Let's see the further outlook of this instrument from the BTC/USD technical analysis:

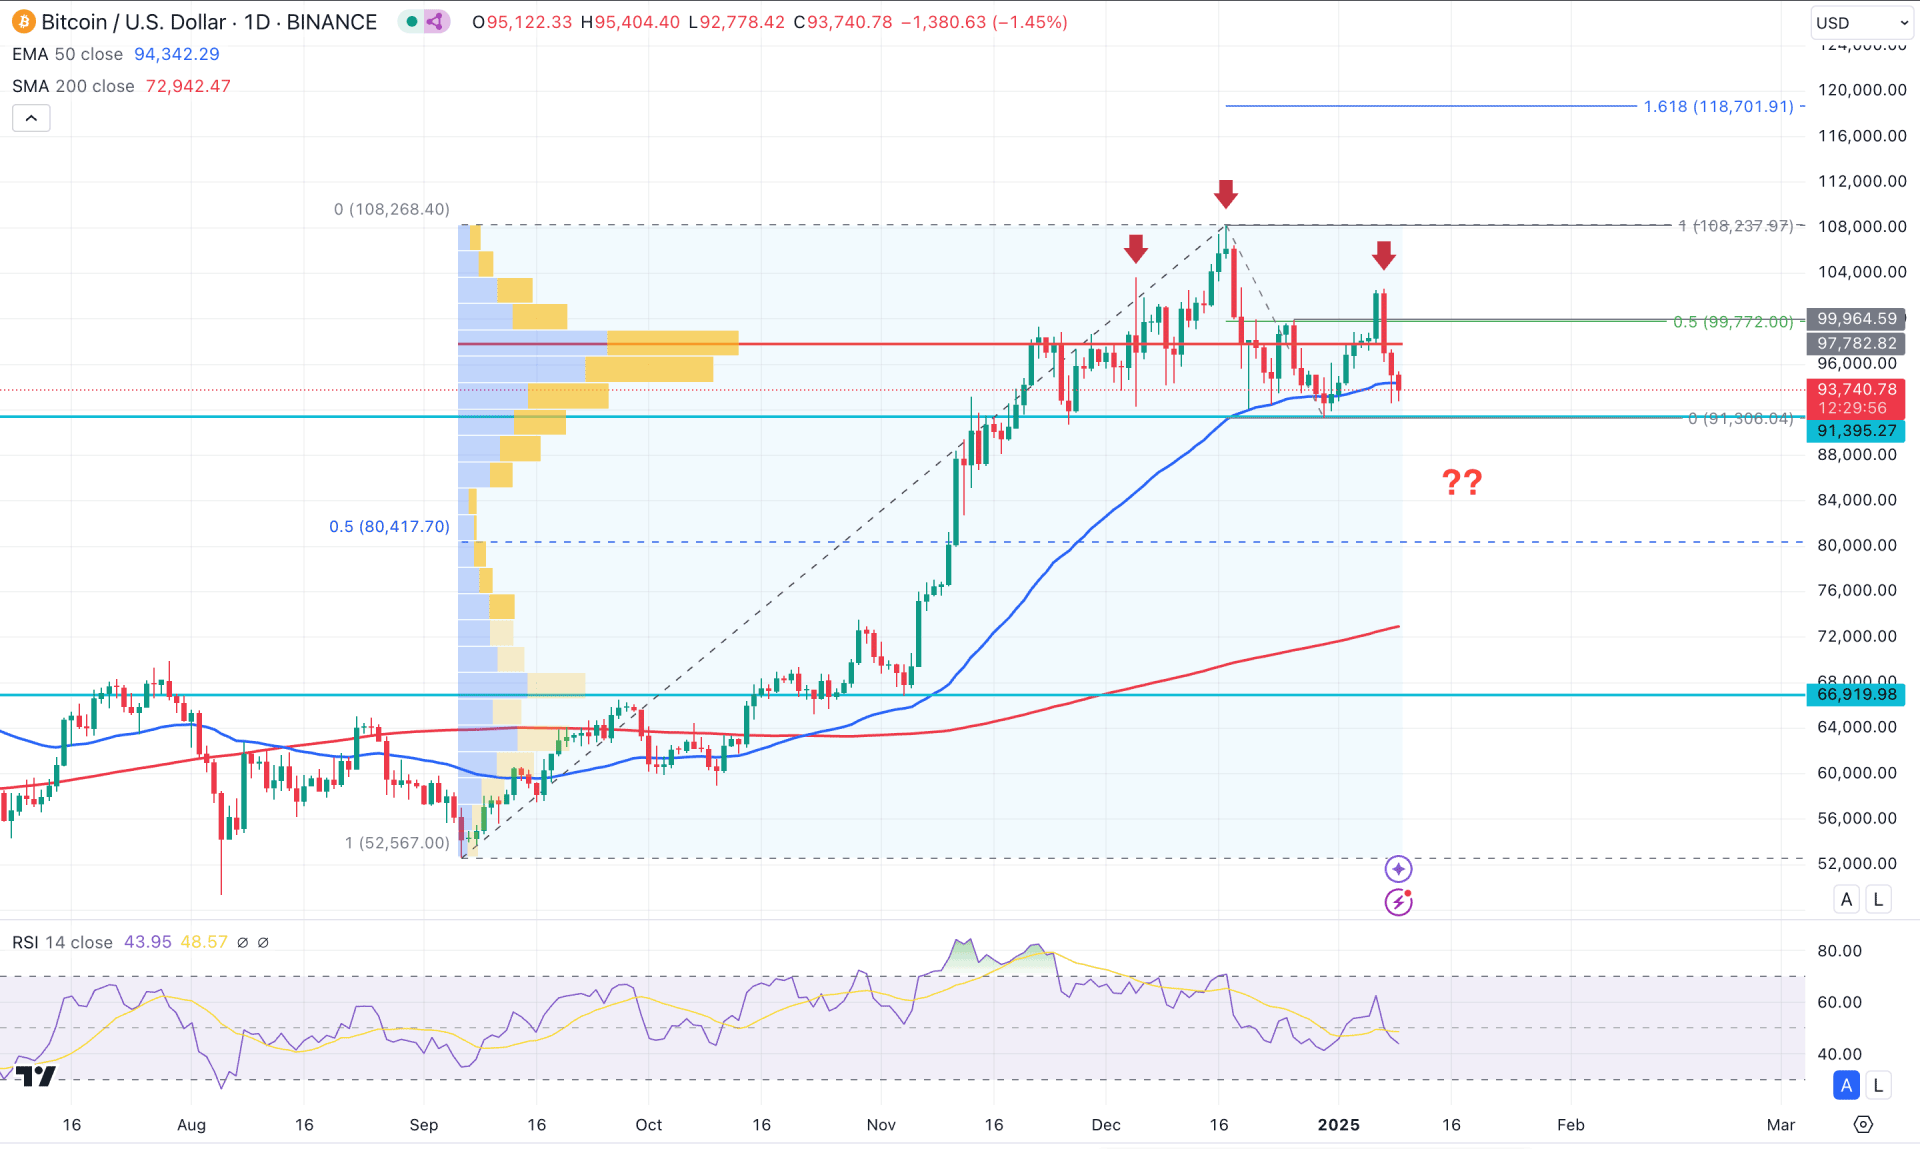
In the daily chart of BTC/USD, the current price is teasing with the $100K line, signaling a possible volatility in the market. Investors should remain cautious about the price as a considerable downside correction could initiate a massive size of liquidation.
In the higher timeframe, December 2024 was closed as an Inverted Hammer candlestick, which provides an early bearish signal. However, investors should wait for a valid price action from the near-term support area before anticipating a valid bearish pressure.
In the volume structure, the ongoing volatility at the top signals an order building from where a valid range breakout could appear. The highest activity level since September 2024 is primarily above the current price, working as immediate resistance. A bearish continuation is likely to appear as long as the current price hovers below the high volume level.
In the technical chart, the 200-day Simple Moving Average is 22% below the current price, which signals a pending downside correction. Moreover, the 50-day Exponential Moving Average is closer to the current price, working as an immediate barrier to bulls.
Based on the daily outlook of BTC/USD, the recent volatility with a high volume line above the current price signals a possible downside pressure in the coming days.
Primarily, a bearish pressure below the 91395.27 support level could validate the Head and Shoulders pattern, which could be a highly probable bearish opportunity. On the downside, overcoming the 50-day EMA could open the room for reaching the 200-day SMA as immediate support.
On the other hand, the near-term support of 91300.00 is a crucial price to look at, as a bearish break could attract a lot of breakout traders in the market. In that case, a selling pressure below this line with an immediate recovery could signal a sell-side liquidity grab. In that case, a bullish continuation with a daily close above the 99964.59 level could invalidate the Head & Shoulders pattern and extend the gain above the current all-time high.

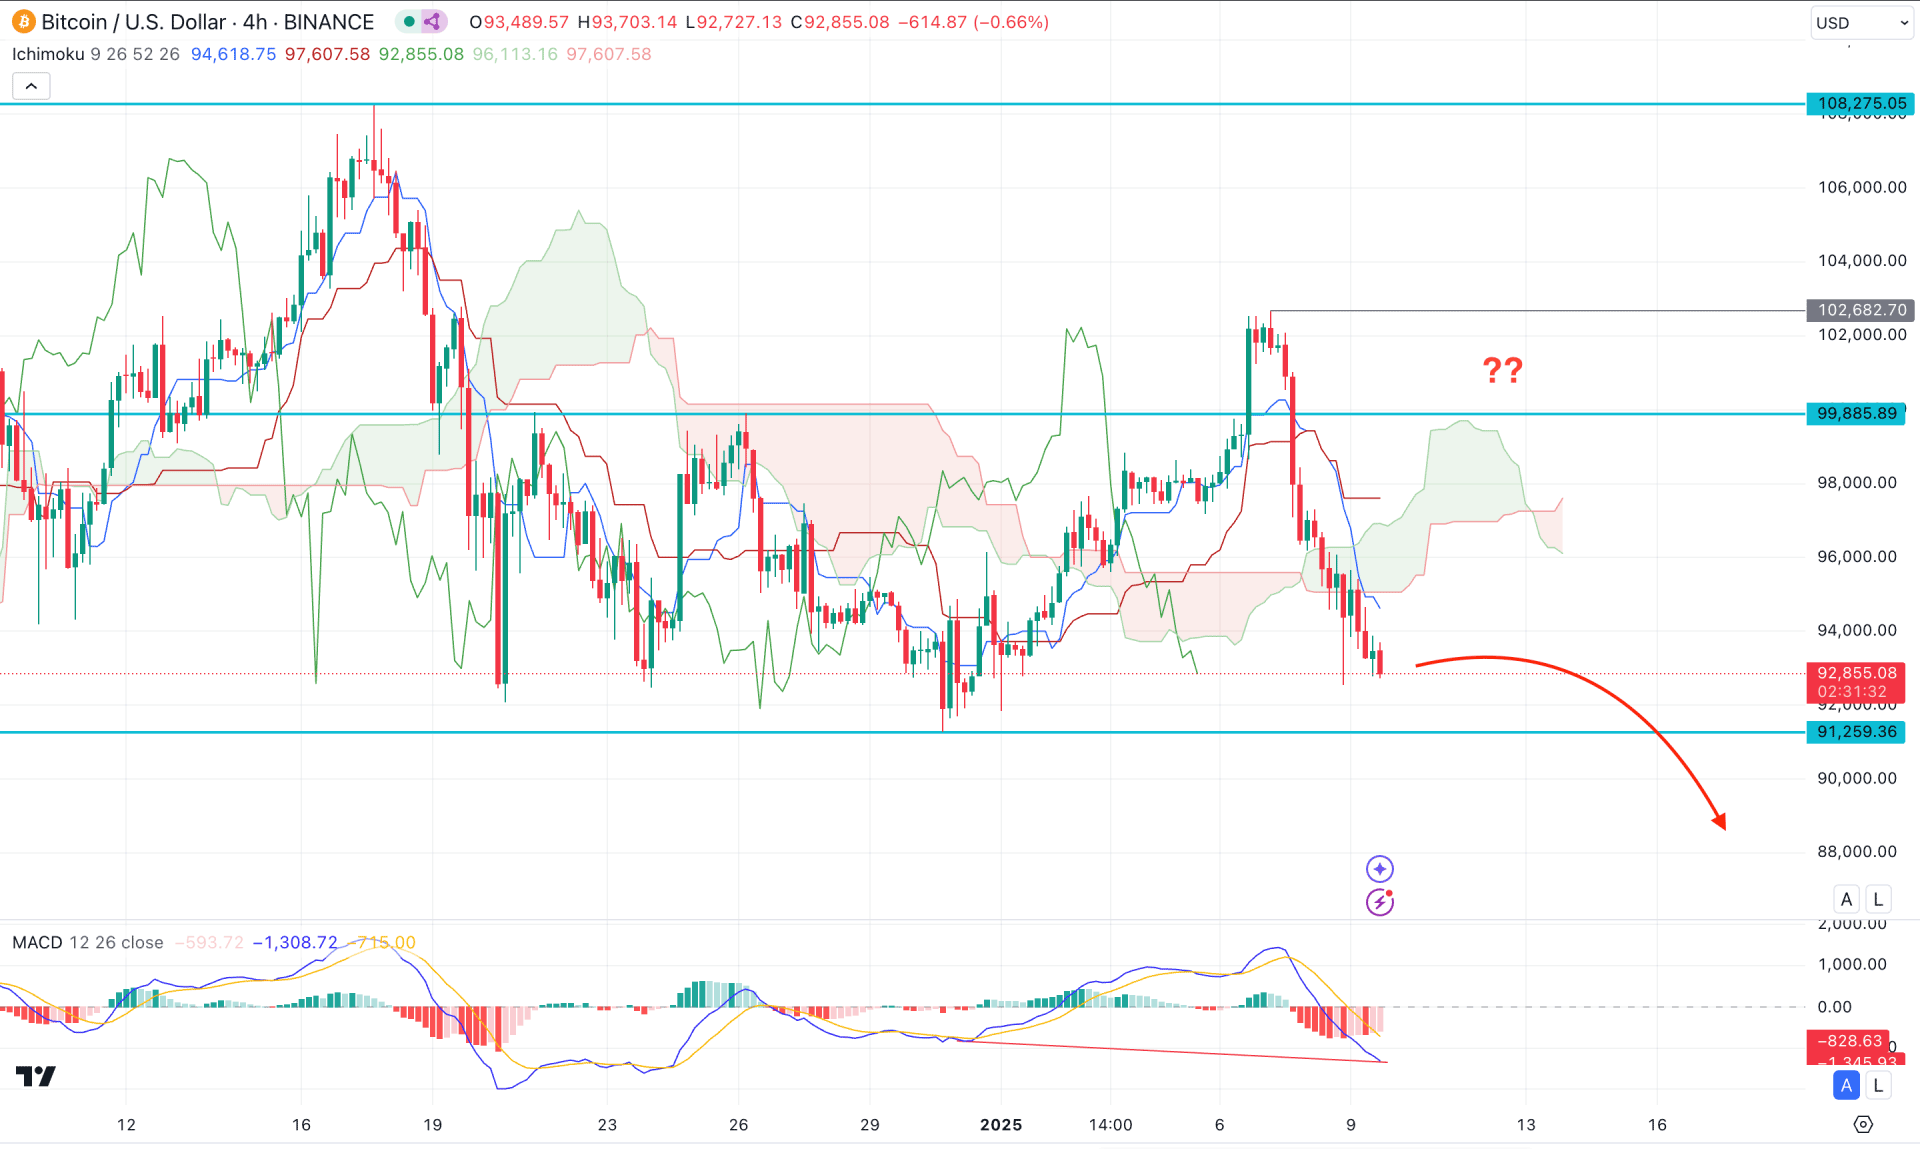
In the H4 timeframe, the recent price showed a strong bullish recovery above the 99885.89 double top pattern with an immediate selling pressure. As a result, bulls from the $100K level were wiped out, invalidating the long anticipation. Primarily, the downside continuation is potent in this pair as long as the price hovers above the crucial high of $100K.
Looking at the Ichimoku Cloud zone, the Future Cloud looks sideways as no valid trend is visible from Senkou Span A and B. Moreover, the ongoing selling pressure below the Cloud low needs more clues about the continuation possibility.
The secondary indicator window shows a divergence with the main price chart where the MACD Signal line extended the loss by creating a new swing low.
Based on this outlook, investors should monitor how the price shows a bullish correction from the current price zone. However, an extended bullish recovery with an H4 candle above the 99885.59 level could validate the long opportunity, aiming for the 106000.00 level.

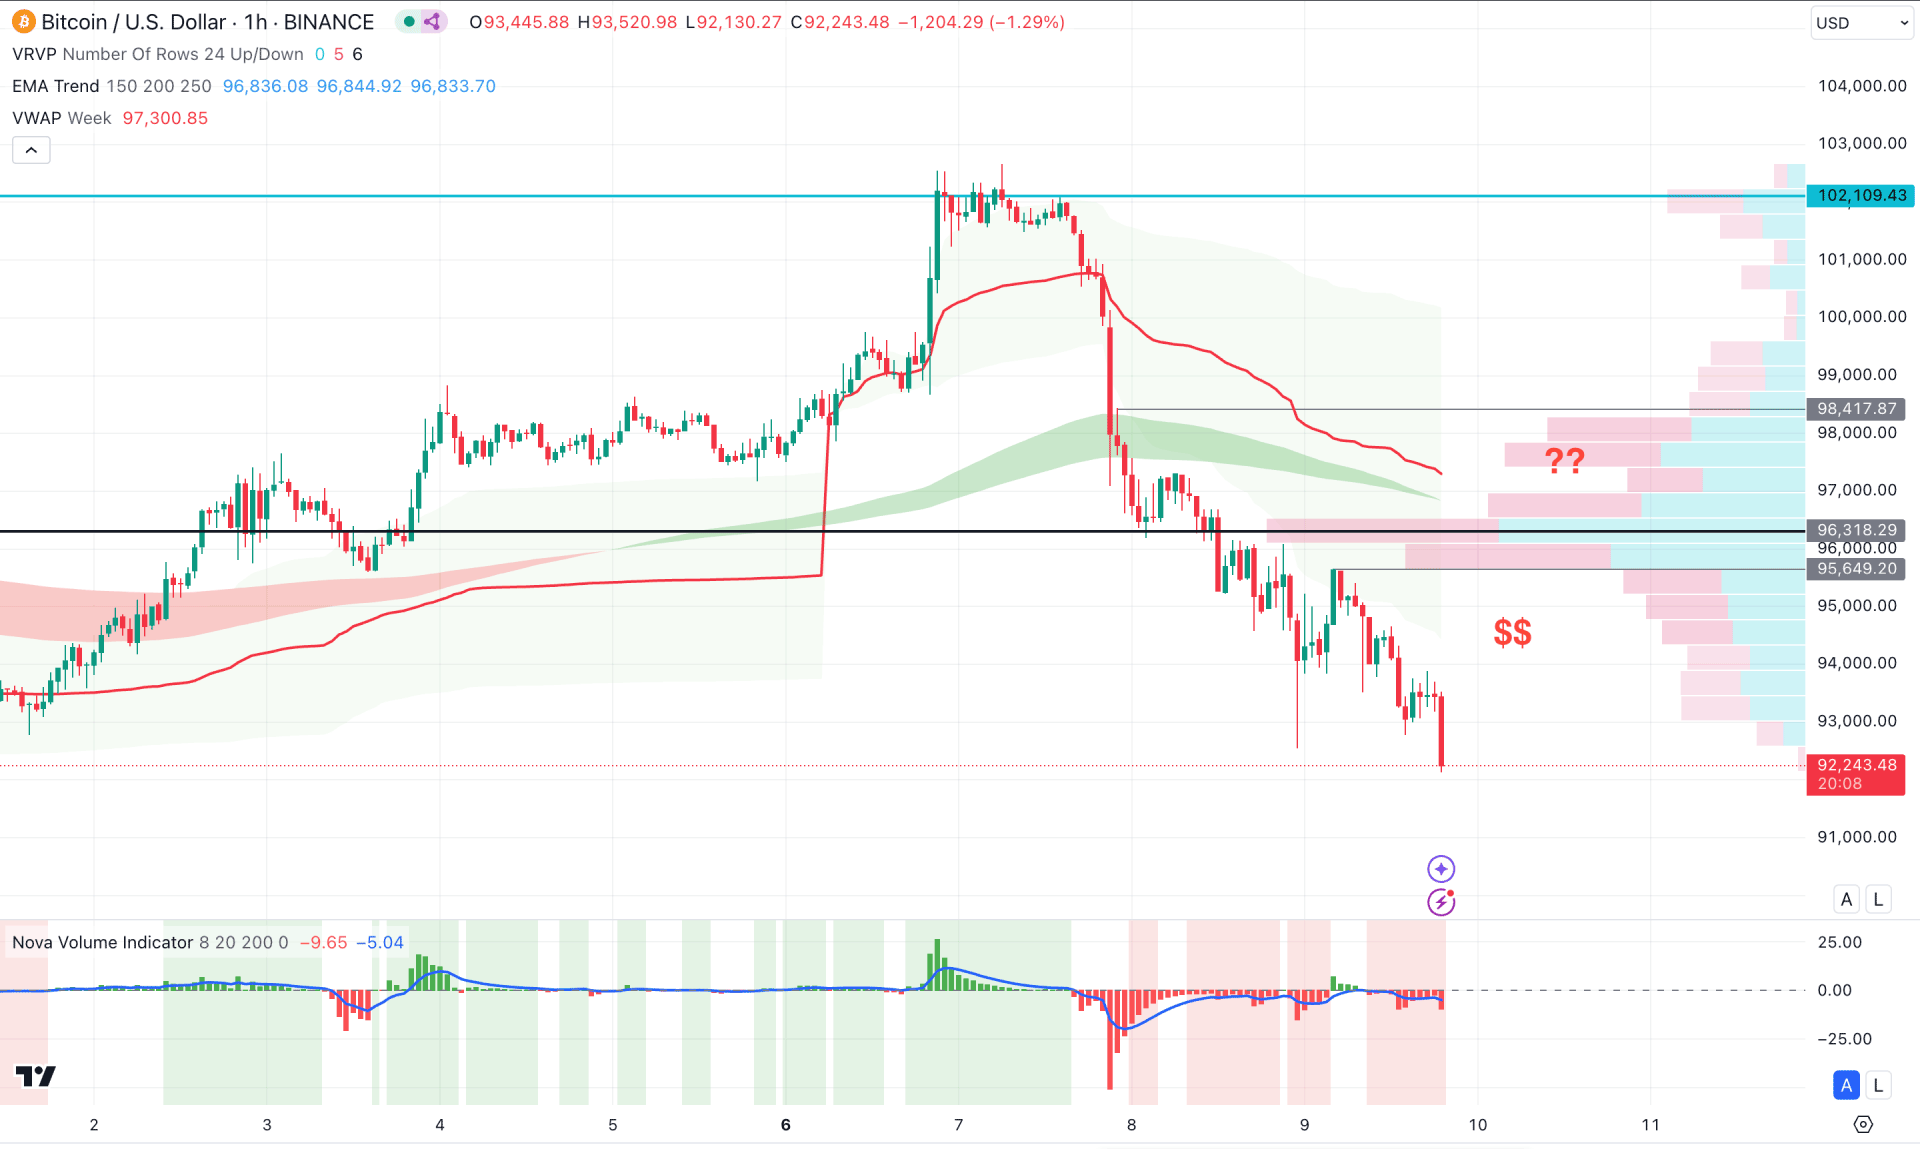
In the hourly time frame, the visible range high volume line signals a bearish continuation momentum, supported by the Moving Average wave.
Moreover, the weekly VWAP is also above the current price, working as a confluence resistance to the ongoing bearish pressure.
Based on the hourly outlook, the ongoing selling pressure needs a minor upward recovery as the near-term trendline resistance signals sufficient buy-side liquidity. However, the ongoing downside pressure could extend as long as the high volume line is above the current price.
However, bearish exhaustion from the 92000.00 to 90000.00 zone with an upward pressure above the high volume line could eliminate the bearish opportunity at any time.
Based on the current market outlook, BTC/USD selling pressure is likely to validate from a valid Head and Shoulders breakout pattern. As the volume is supported by sellers, a proper correction with a valid price pattern could be a decent short opportunity.