
Published: August 4th, 2022
Bitcoin (BTC) price showed the last notable swing high on 31 March 2022 at 32,375.00 level and dropped 45% in the next two weeks. The selling pressure pushed the instrument creating a yearly low at 17592.00 by providing bulls to buy it at a discounted price.
According to IntoTheBlock’s Global In/Out of the Money (GIOM) model, almost 1.97 million addresses have purchased roughly 1.16 million Bitcoin at the average price of 29259.00. Moreover, the buying activity happened between 24100.00 to 31400.00 area. Based on this on-chain metric, Bitcoin will likely show an 18% price surge as the price falls to the technical level of 28656.00.
The recent buying pressure in BTC/USDT price relieved investors, but the potential double bottom formation at the 19239.00 support level left some sell-side liquidity below it. As a result, any breakdown below the 200-week SMA at the 22710.00 level would be the first sign of upcoming selling pressure. Moreover, the current price trades within an ascending channel, showing sellers' interest in the market.
Let’s see the future price direction from BTC/USDT Technical analysis:
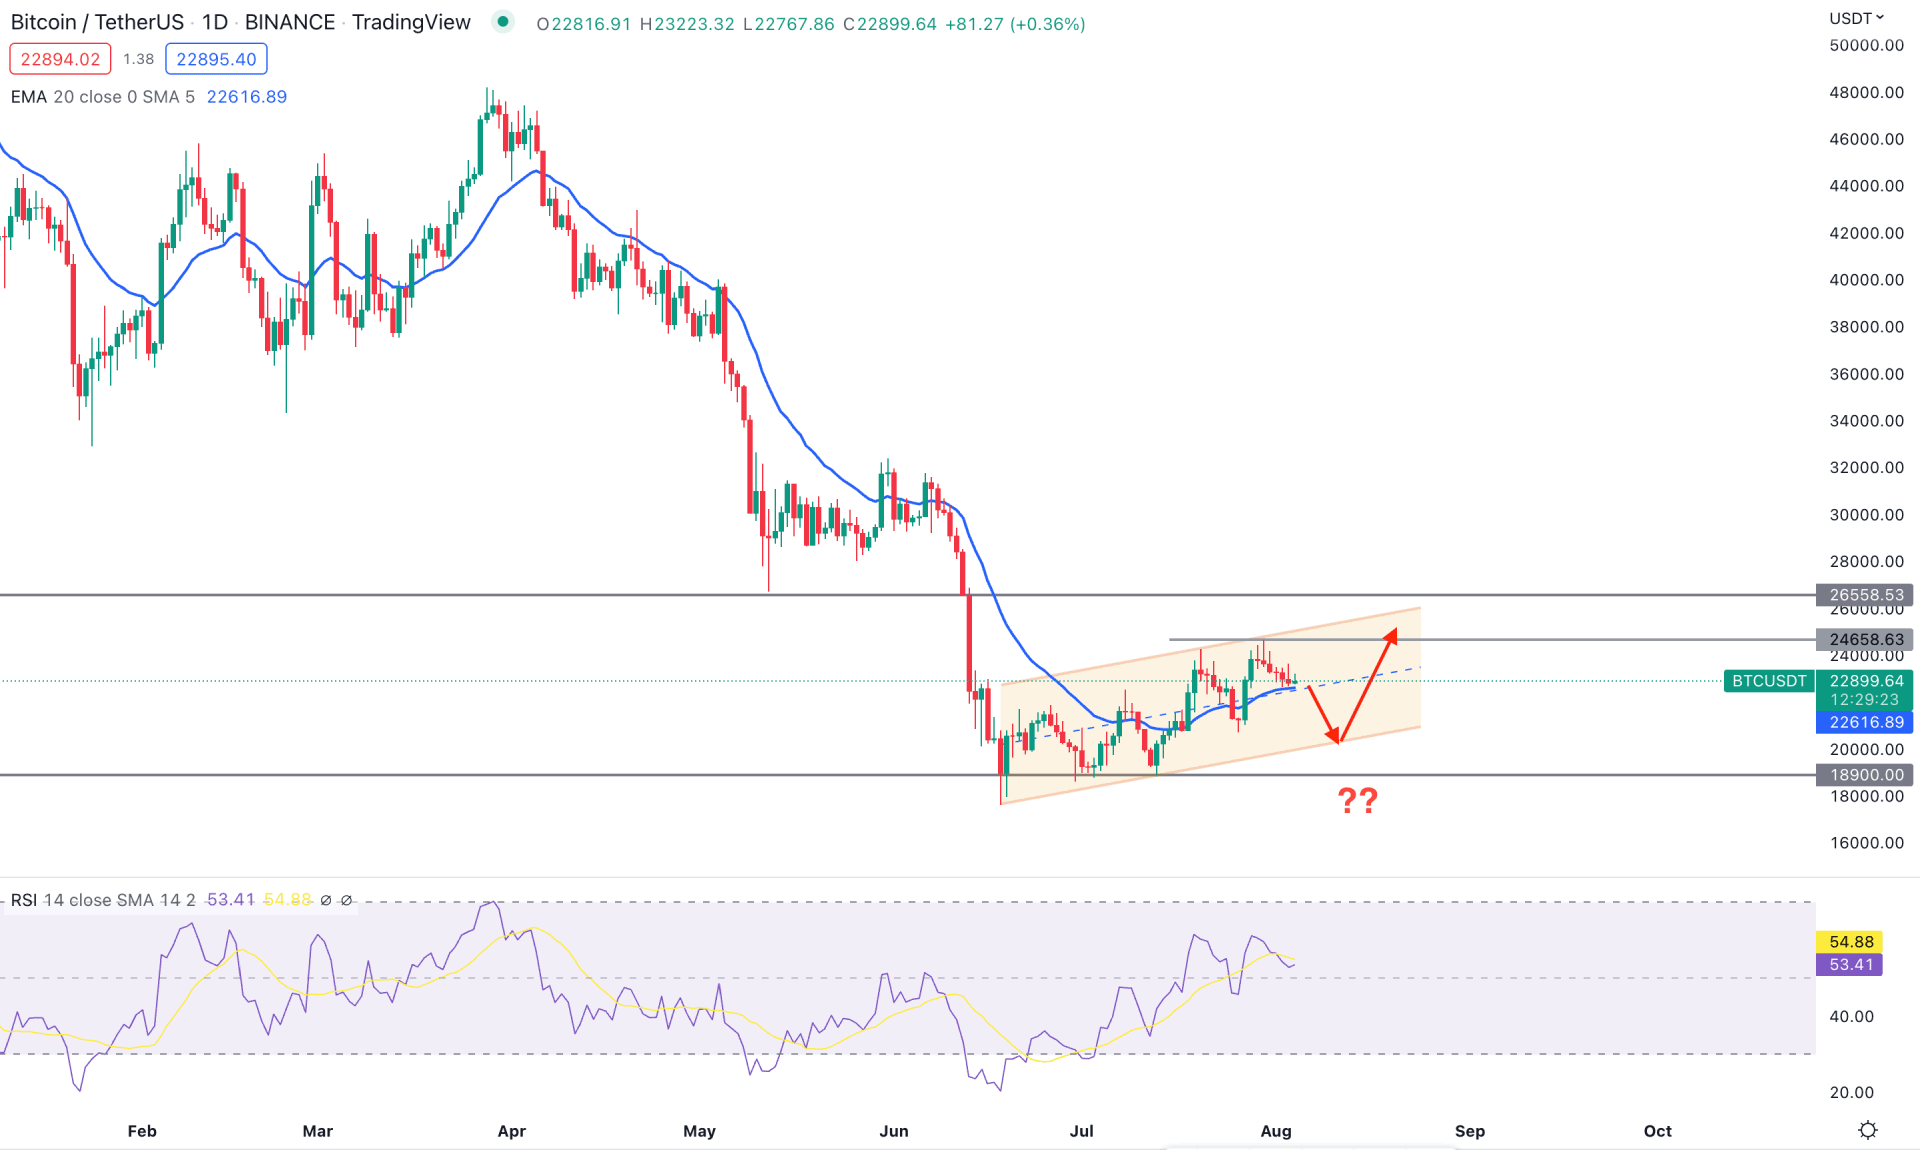
According to the daily price action, bitcoin is trading in a long-term bearish trend where the current bullish correction could provide a bearish opportunity after the channel breakout. The selling pressure from 34,000.00 to 18,000.00 area was so impulsive that it took only 10 trading days to eliminate 40% of the value.
The current corrective momentum is visible from the 20-day moving average, where multiple violations of the dynamic level are seen. Moreover, the recent price reached the channel resistance from where any bearish daily candle below the 20 EMA could decrease the price towards the 20,000.00 channel support.
In the indicator window, the buying momentum is still valid, as shown by the Relative Strength Index. The RSI level rebounded from the oversold 30 zone and remained stable above the 50% level. Therefore, until the RSI breaks below the 50 level, we can expect it to reach the 70 overbought zone.
Based on the current price action, any bullish rejection from the 20-EMA could increase the buying pressure towards the 24,658.63 level in the coming days. On the other hand, the broader approach is to wait for the price to break below the 20,000.00 psychological level and test the 16,000.00 level.
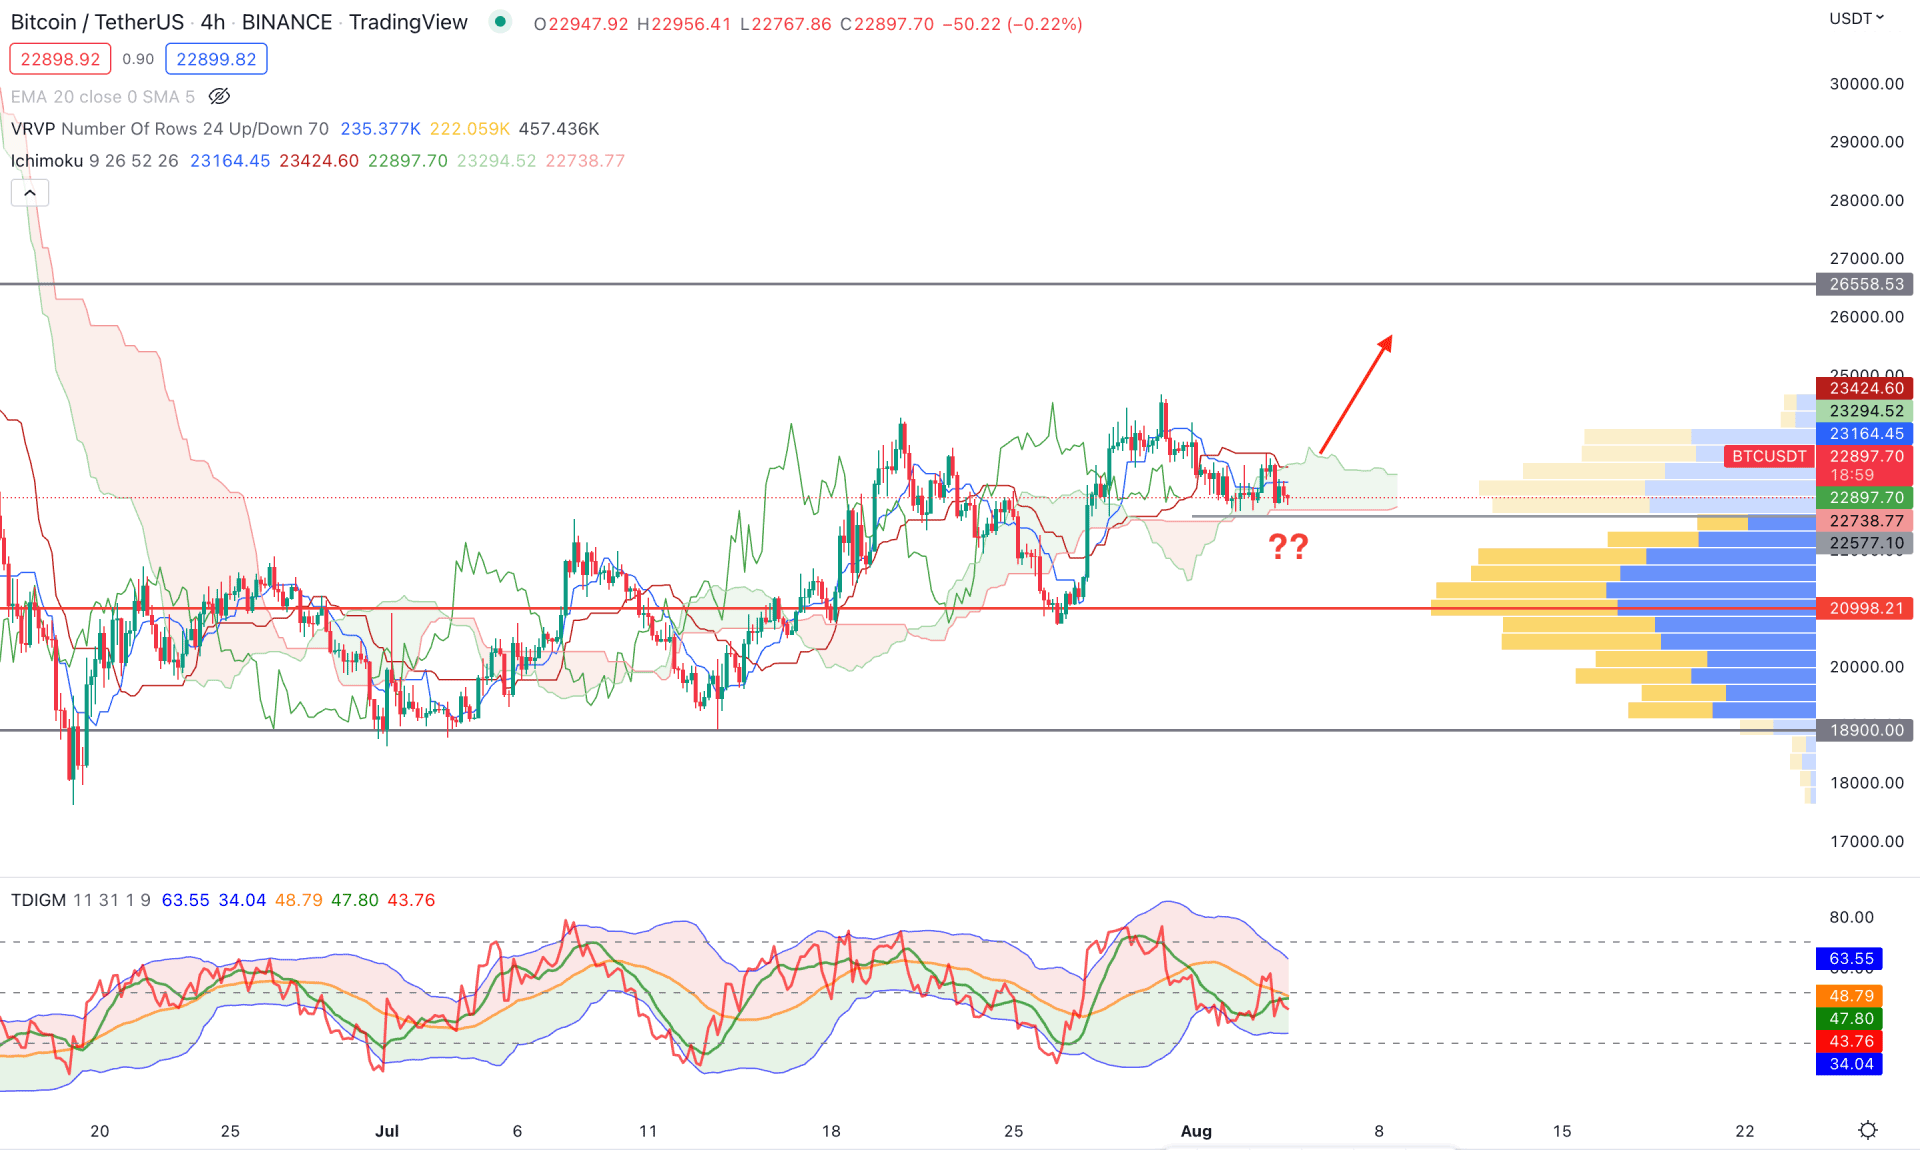
In the H4 chart, BTC/USDT shows buyers' interest as the current price is above the Kumo Cloud while the Future cloud is supportive to bulls. After making a new swing high above the Kumo Cloud, the current price trades within the cloud, from where any buying pressure above the dynamic level could resume the buying momentum.
The visible range volume indicator shows the biggest trading volume from the visible range is t 20998.31, which is below the immediate static level of 22,577.10. As a result, if bulls fail to hold the price above the current Kumo Cloud, it will increase the possibility of testing the 20998.31 support level.
The TDI remains at the 50% neutral level on the indicator window, indicating a possible breakout. In that case, a bullish pressure and H4 candle above the dynamic Kijun Sen could resume the buying pressure. On the other hand, a breakdown below the 22,577.10 support level could extend the daily channel towards the 20,000.00 level.
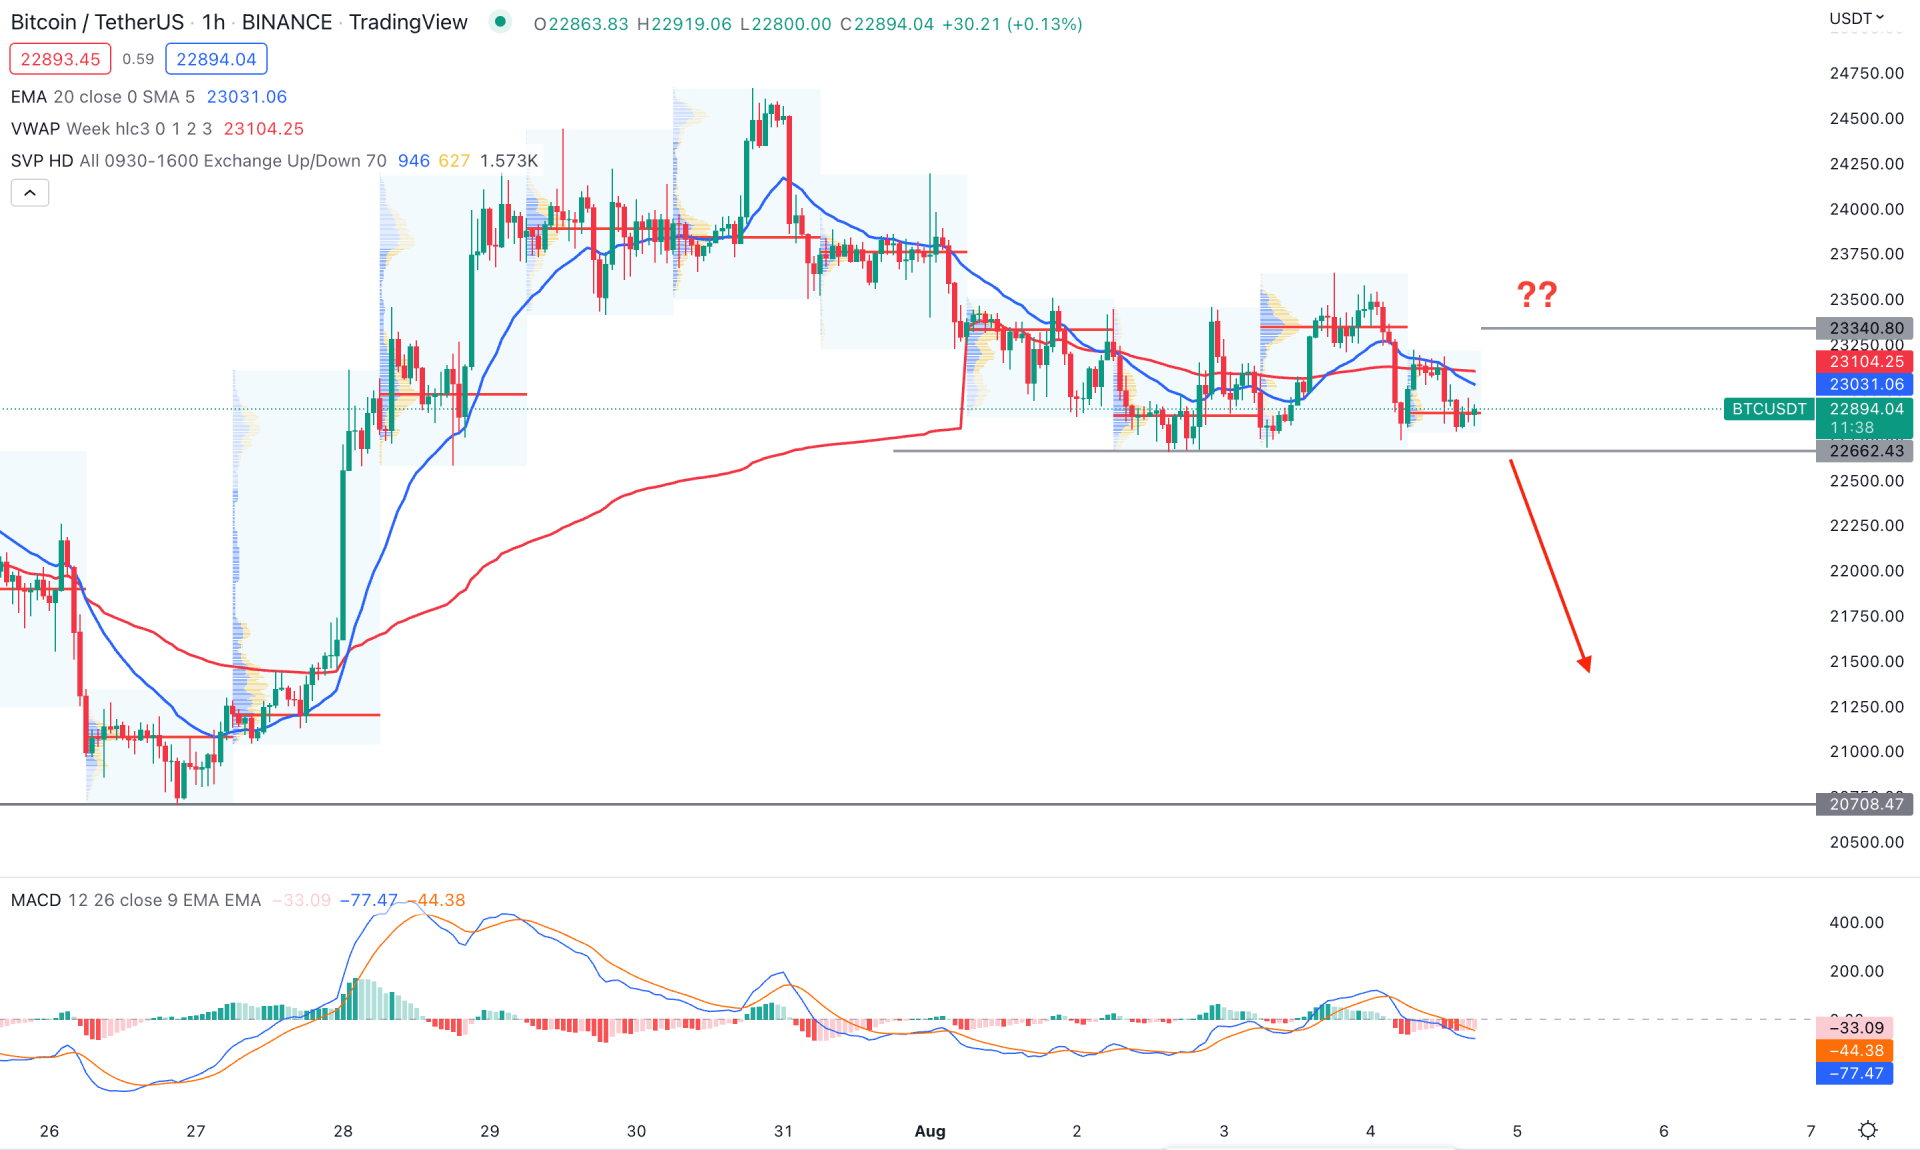
In the H1 timeframe, BTC/USDT trades with a substantial downside possibility as the current price left sell-side liquidities below the 22,662.43 support level. Moreover, the dynamic 20 EMA and weekly VWAP are above the current price, working as minor resistances.
The current intraday high volume level is within the current price, down from the previous level at 22,340.80. The MACD Histogram is also on the sellers’ side, where any bearish breakdown below the 22662.43 level would be a sell signal.
Based on the current findings, the buying pressure may resume if the price shows a strong bullish H1 candle above the 22340.80 high volume level. On the other hand, the break below the 22,500.00 level could open a bearish opportunity where the primary target would be towards the 20,708.47 level.
Based on the current multi-timeframe analysis, BTC/USDT buying pressure needs more confirmations, where a stable price above 30,000.00 is needed. Based on the current price action, any bearish opportunity from the channel resistance would provide a profitable trading opportunity.


