
Published: May 12th, 2022
Bitcoin showed a brutal fall this week by moving below the $30K level for the first time since July 2021. As a result, the world's largest cryptocurrency lost 58% of its value from the all-time high of $69K. Following Bitcoin, other cryptocurrencies like Ethereum, Solana, Luna, Cardano, Link, etc., moved down with an impulsive pressure.
Crypto enthusiasts hoped that the independent nature of cryptocurrency would work as a resistance to inflation and economic crisis. Moreover, as Bitcoin is issued without any central exchange, there is no authority to regulate it. As a result, many people argued that the BTC would hold its value during economic dips, wars and massive policy changes. However, the BTC/USDT price action for the last couple of years has proven wrong. During the COVID-19 pandemic, the global stock market crashed, and so did Bitcoin, falling by 57%. Although the recovery has happened due to stimulus-driven money, the current situation is entirely different.
The US inflation is at a record high while the Federal Reserve and other central banks increase the interest rate. As a result, the stock valuation has become a matter of tension for investors, which is also applicable to Bitcoin. Besides, the cheaper price and strong future is the main aim for investing in assets like cryptocurrencies. Let’s see the future price direction from the BTC/USDT technical analysis.
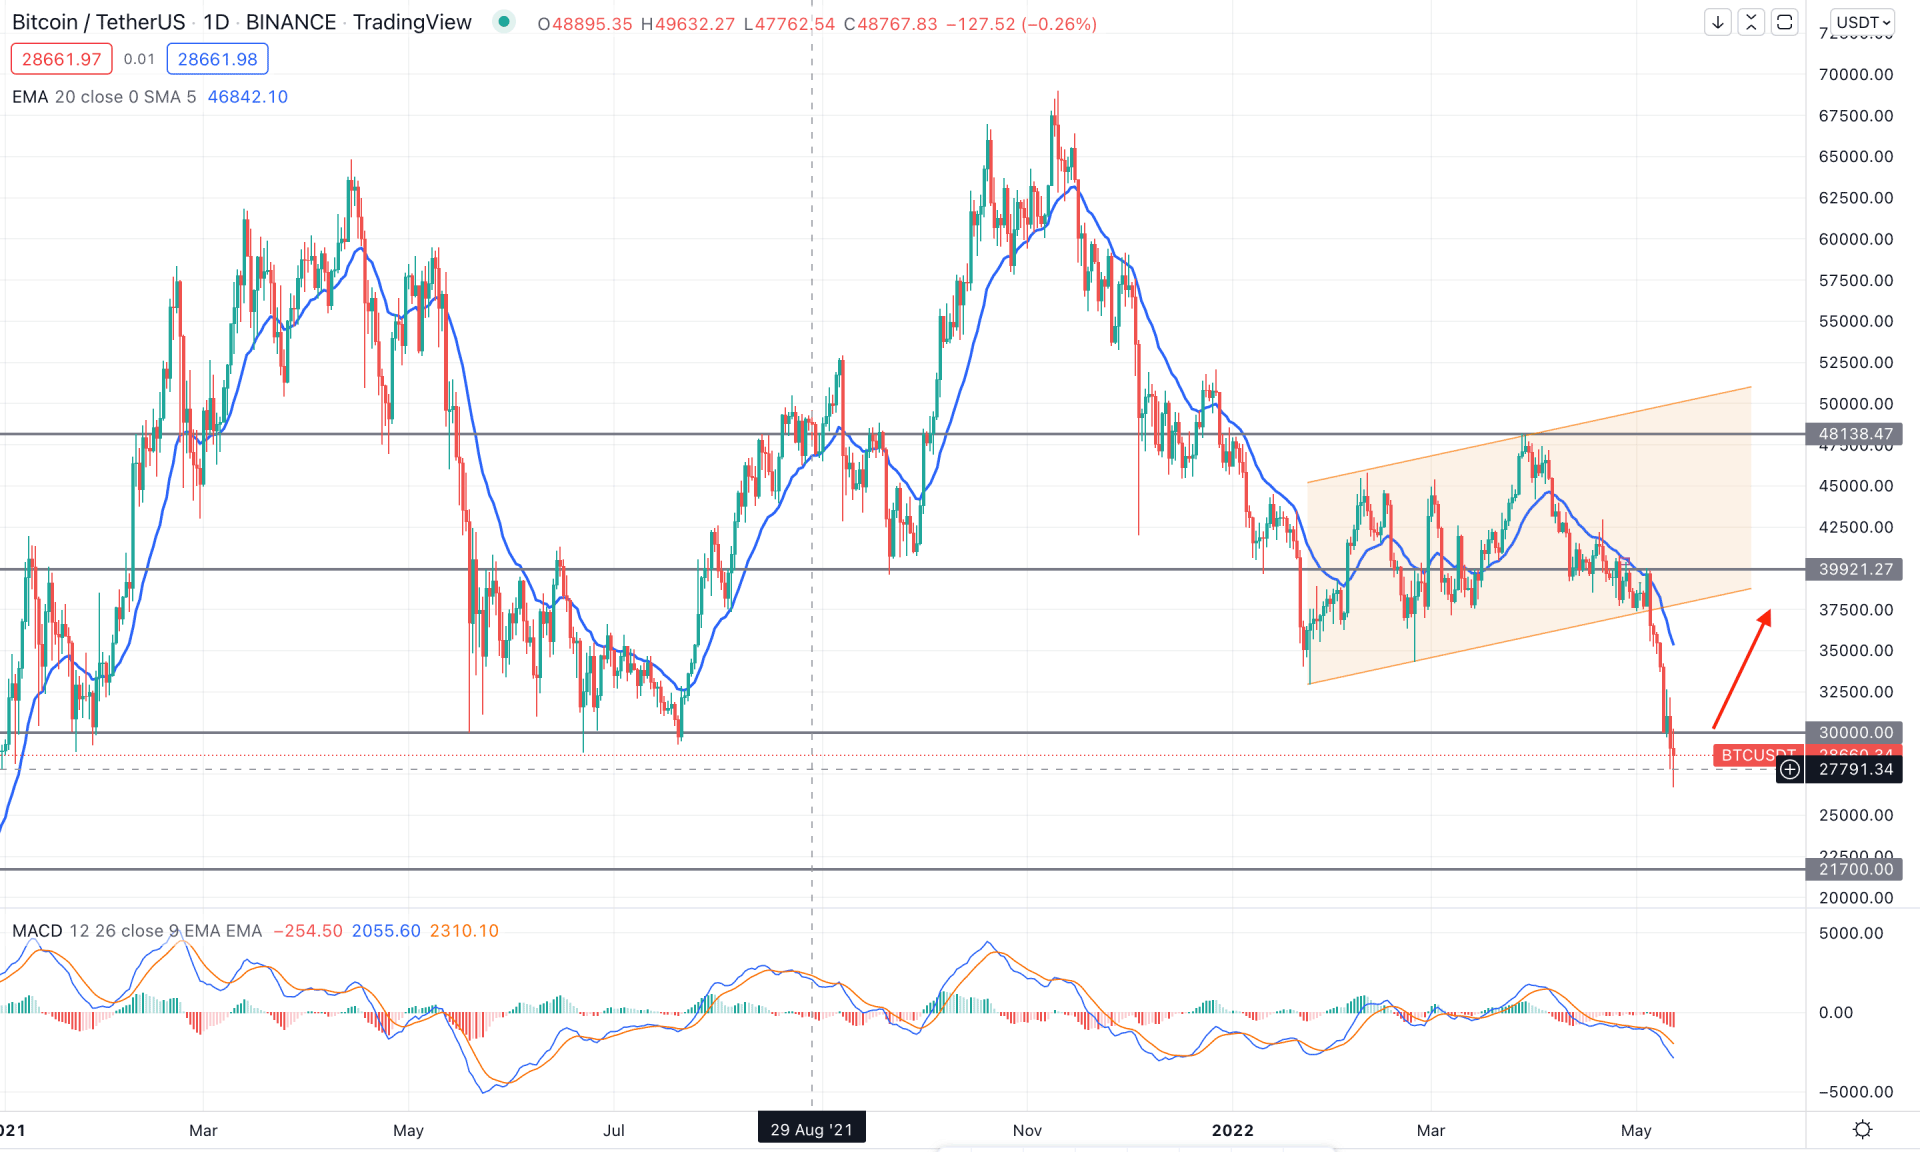
In the daily chart, BTC/USDT trades extremely bearish after the bullish channel breakout that made an impulsive pressure below the 30,000.00 key support level. Therefore, it is a sign of a perfect trending movement that came from the 69,000.00 all-time high level. In the previous chart, Bitcoin tested the 30,000.00 level multiple times in 2020 and 2021, indicating a massive retail buyers’ presence in that area. In that case, after grabbing the sell-side liquidity below the $30K to $24K area, the further upside pressure has a higher possibility of showing a decent bullish pressure in the coming days.
The above image shows the daily chart of BTC/USDT, where the current price is very impulsive, below the 30K level. Moreover, the MACD Histogram made consecutive lows below the neutral level while the MACD line moved further down. Meanwhile, the gap between the dynamic 20 EMA and price has expanded, increasing the possibility of a bullish correction.
Based on the daily structure, the current selling pressure with strong bullish exhaustion would be a potential buying sign in this pair. On the other hand, if the selling pressure remains stable below the $30K level, it may move more down towards the $17500.00 support level.
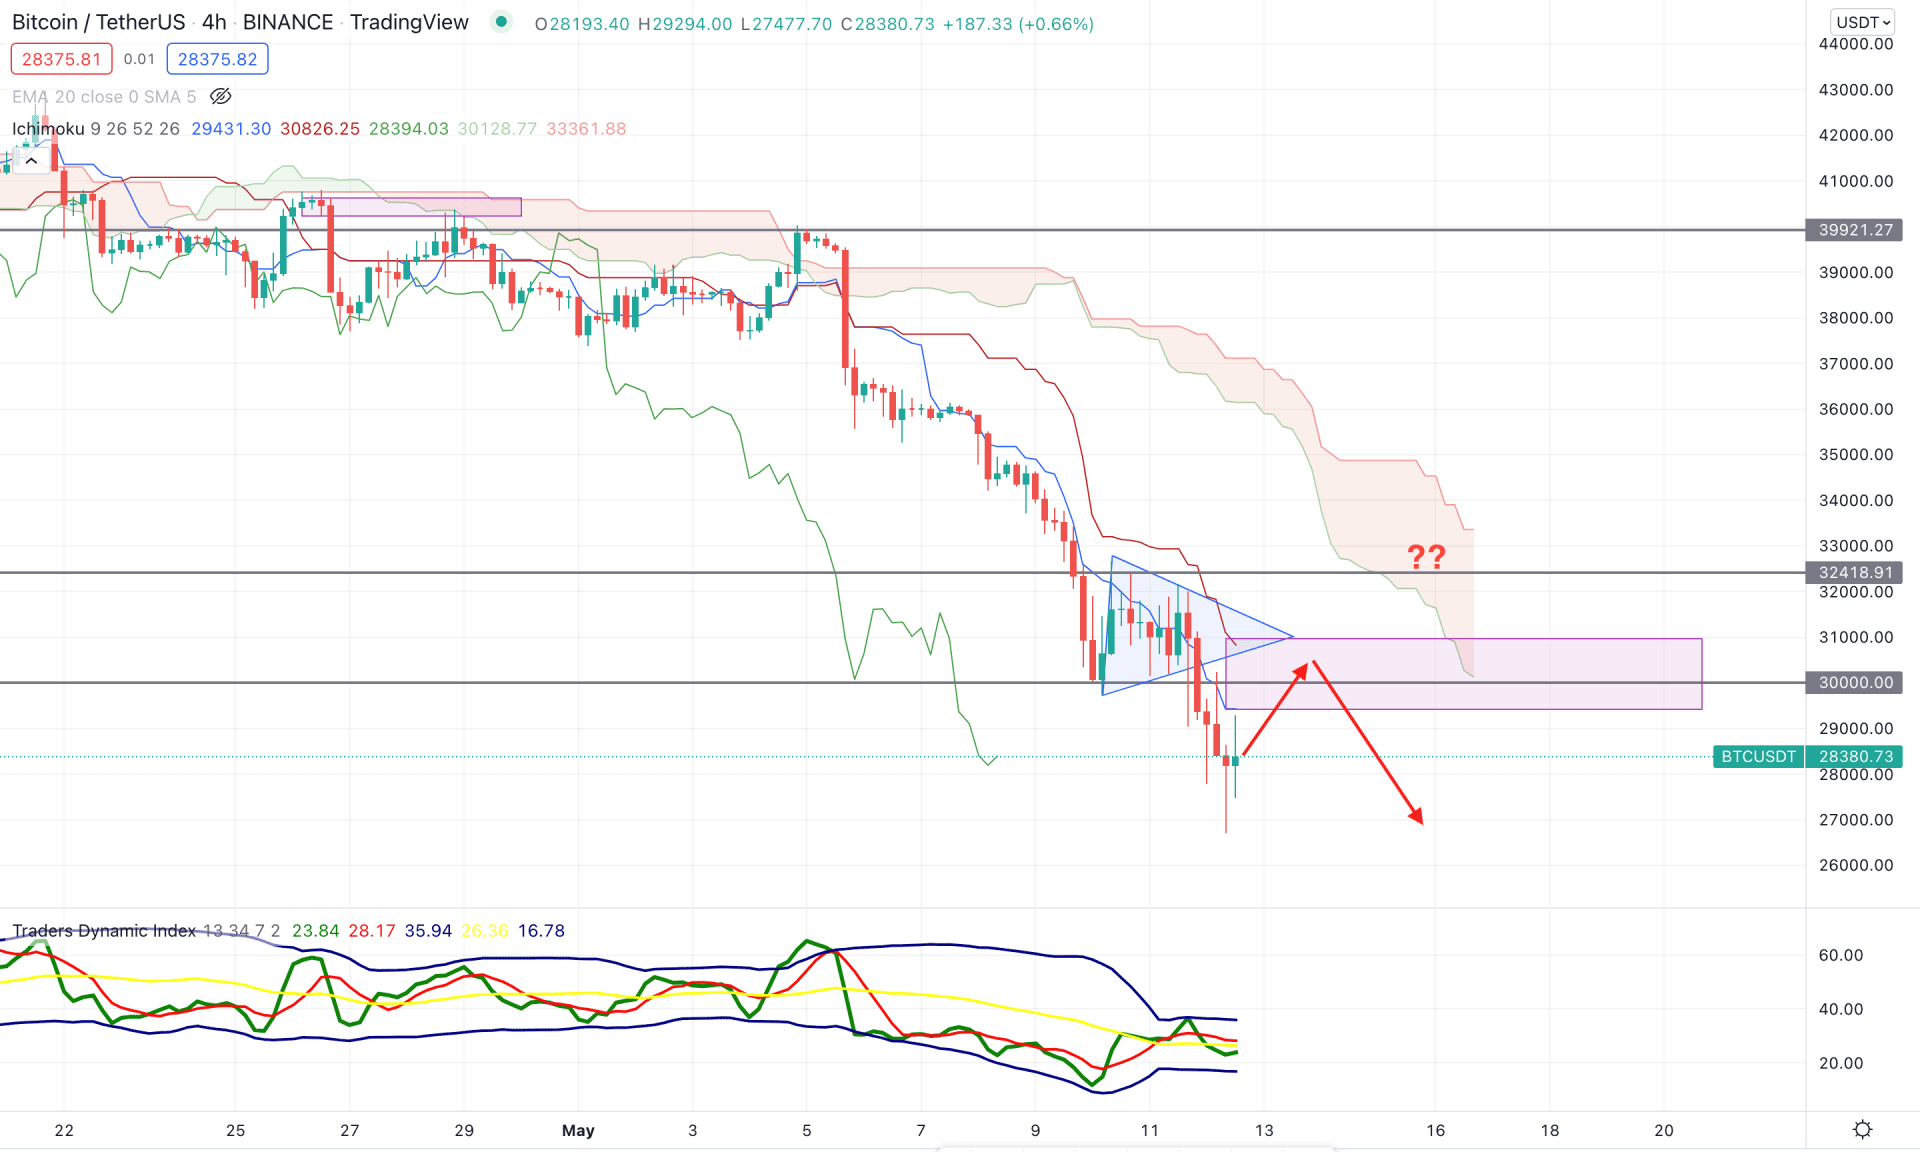
According to the Ichimoku Cloud, the H4 chart of BTC/USDT trades under intense selling pressure. The price remained strongly bearish below the Kumo Cloud while the Lagging Span was below the price. Moreover, the Senkou Span A is below the Senkou Span B with a substantial gap in the future cloud. On the other hand, the price reached below the critical 30,000.00 support level and became very volatile. Investors should closely monitor how the price trades at the 30,000.00 to 24,000.00 area from where bulls may appear.
The above image shows the H4 chart of BTC/USDT, where the trader's dynamic index became corrective, signifying that bears are losing their momentum. However, the price is still below the dynamic Kijun Sen and Static 30,000.00 resistance that needs to be recovered before aiming for long setups.
Based on the current market context, a bullish correction is pending in this pair, but further selling pressure from 29000.00 to 31,000.00 would decrease the price towards the 24,000.00 area. On the other hand, the violation of the dynamic Kijun Sen with an H4 close above the 32,418.00 level would be a sign of reversals.
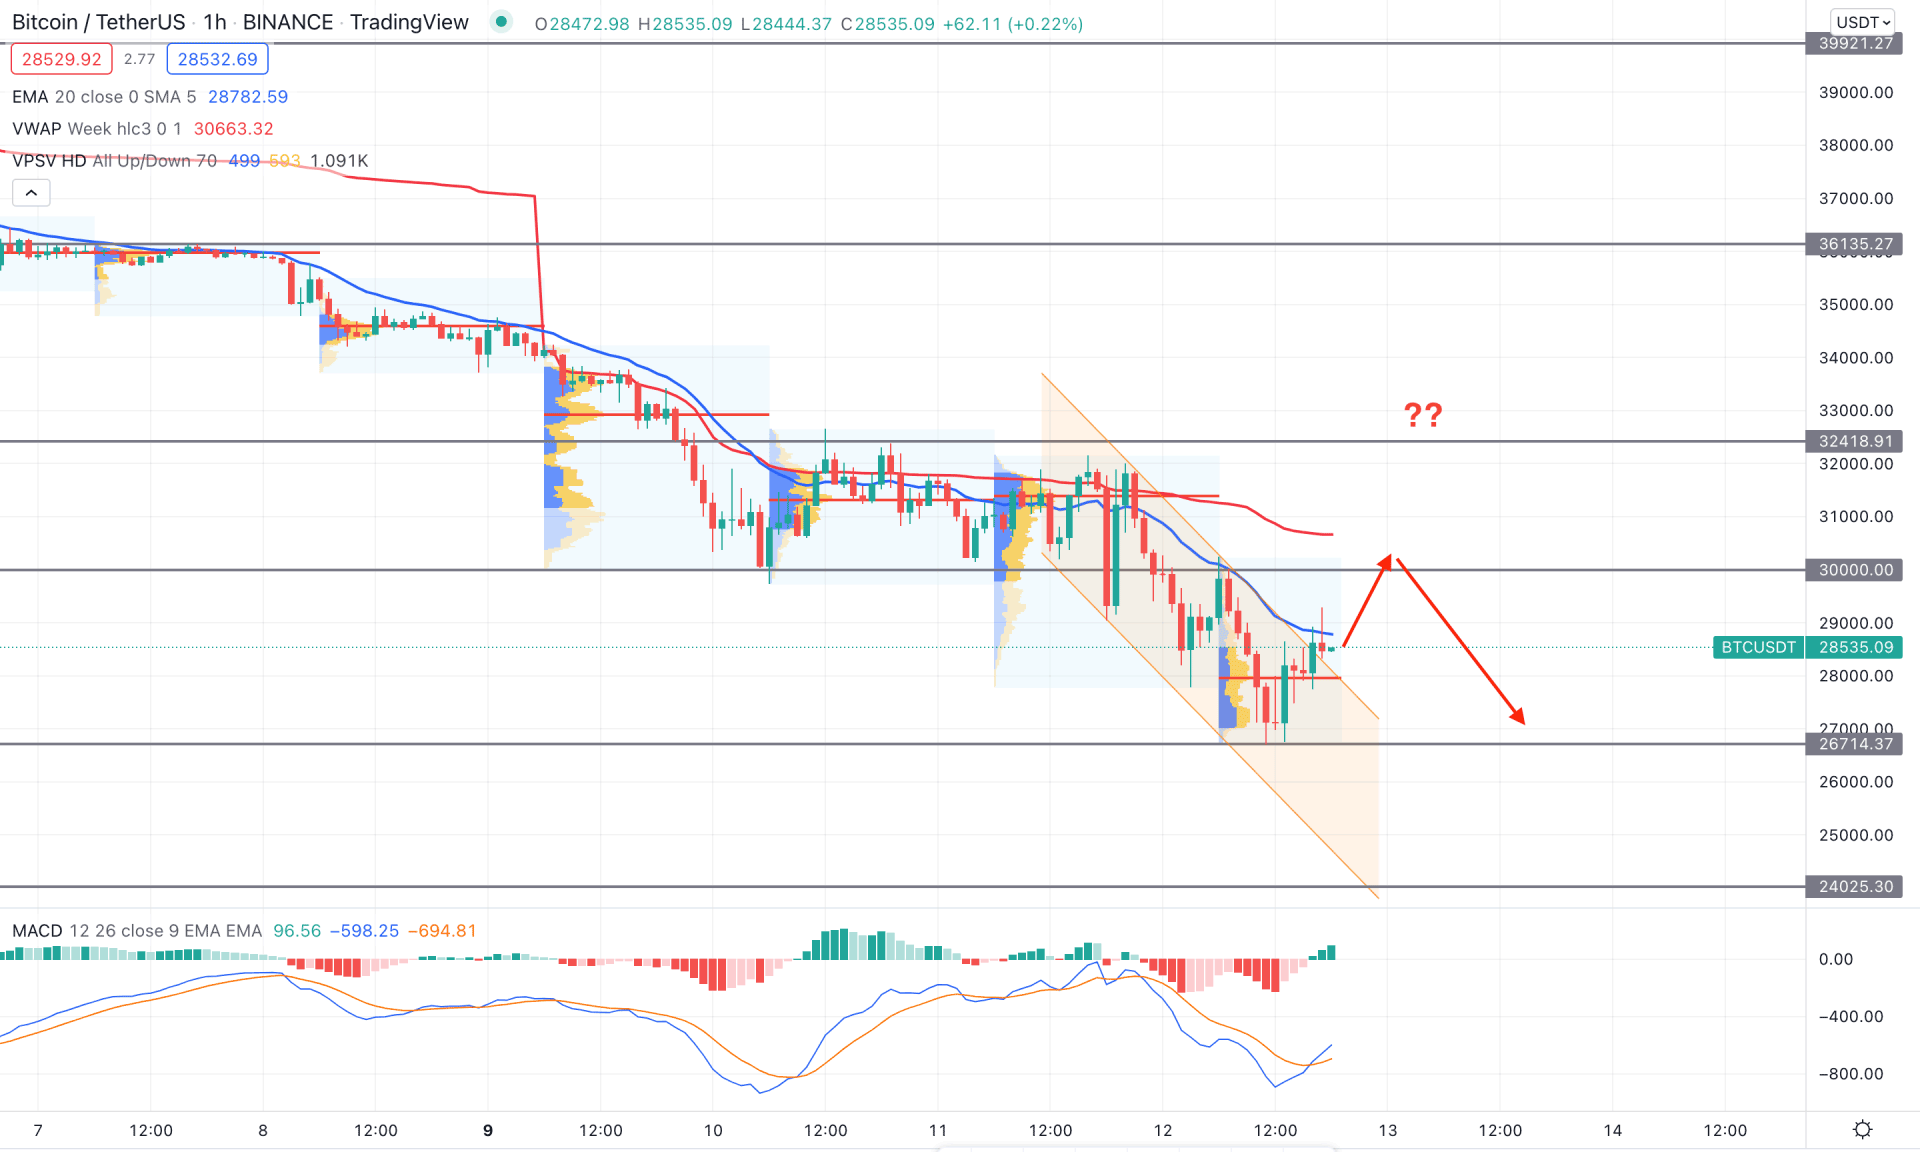
In the intraday chart, the current price trades below the dynamic 20 EMA while the most recent high volume level is below the price. However, the price still trades below the 30,000.00 near-term resistance level, which is the primary barrier for bulls.
The above image shows the H1 chart of BTC/USDT, where the recent swing low of 26,714.37 created a divergence with the MACD line before forming a bearish channel breakout. However, the dynamic weekly VWAP is above the price that may work as immediate resistance. Based on the H1 chart, the price may correct higher towards the dynamic VWAP area from where any bearish rejection would be a selling opportunity. On the other hand, any buying pressure above the 32418.91 level with an H1 close would be a bullish opportunity.
As per the current market context, BTC/USDT trades below the 30,000.00 level from where the sell-side liquidity is present. Therefore, investors should monitor how the price trades at 30,000.00 to 24,000.00 area before aiming for a long trade. The best approach is to wait for strong exhaustion with a stable price above the 31,000.00 area before taking any bullish trade.


