
Published: July 23rd, 2025
As of Wednesday, Bitcoin (BTC) is trading marginally lower after previously reaching the upper limit of a building at around $120,000. The drop coincides with the second straight day of withdrawals from the US-listed spot Bitcoin ETFs this week, indicating that institutional investors are becoming more cautious. Given the signs of fatigue in momentum indicators, the technical perspective also suggests a short-term adjustment.
According to SoSoValue statistics, American spot Bitcoin ETFs experienced withdrawals for the second consecutive day this week, with $67.93 million leaving the market. The price of Bitcoin may experience an adjustment if this trend persists and gets stronger.
Additionally, CryptoQuant data revealed a spike in Binance's Short-Term Holder (STH) activity, suggesting that retail investors may be taking profits.
Some whales continue to hoard Bitcoin despite a slight decline in institutional interest and selling by regular investors.
The Kraken exchange experienced one of the most significant single-day transfers in recent months on Tuesday, with nearly 9,600 BTC withdrawn, according to data from CryptoQuant. As a result, there is less immediate sell-side cash available to absorb retail selling pressure.
Large investors, sometimes referred to as "smart money," typically capitalize on bull markets by building up and holding positions through fluctuations to achieve higher gains. In contrast, retail investors have historically sold out of their positions too soon.
When looking at the bull runs in 2017 and 2021, the metric displayed a spike that suggested selling activity from big wallets, which caused the price of Bitcoin to plummet. The "Smart Money" flow indicator is currently consolidating. It is a sign that there are few flows to trades and that big investors are sticking into the market.
Let's see the complete outlook from the BTC/USDT technical analysis:
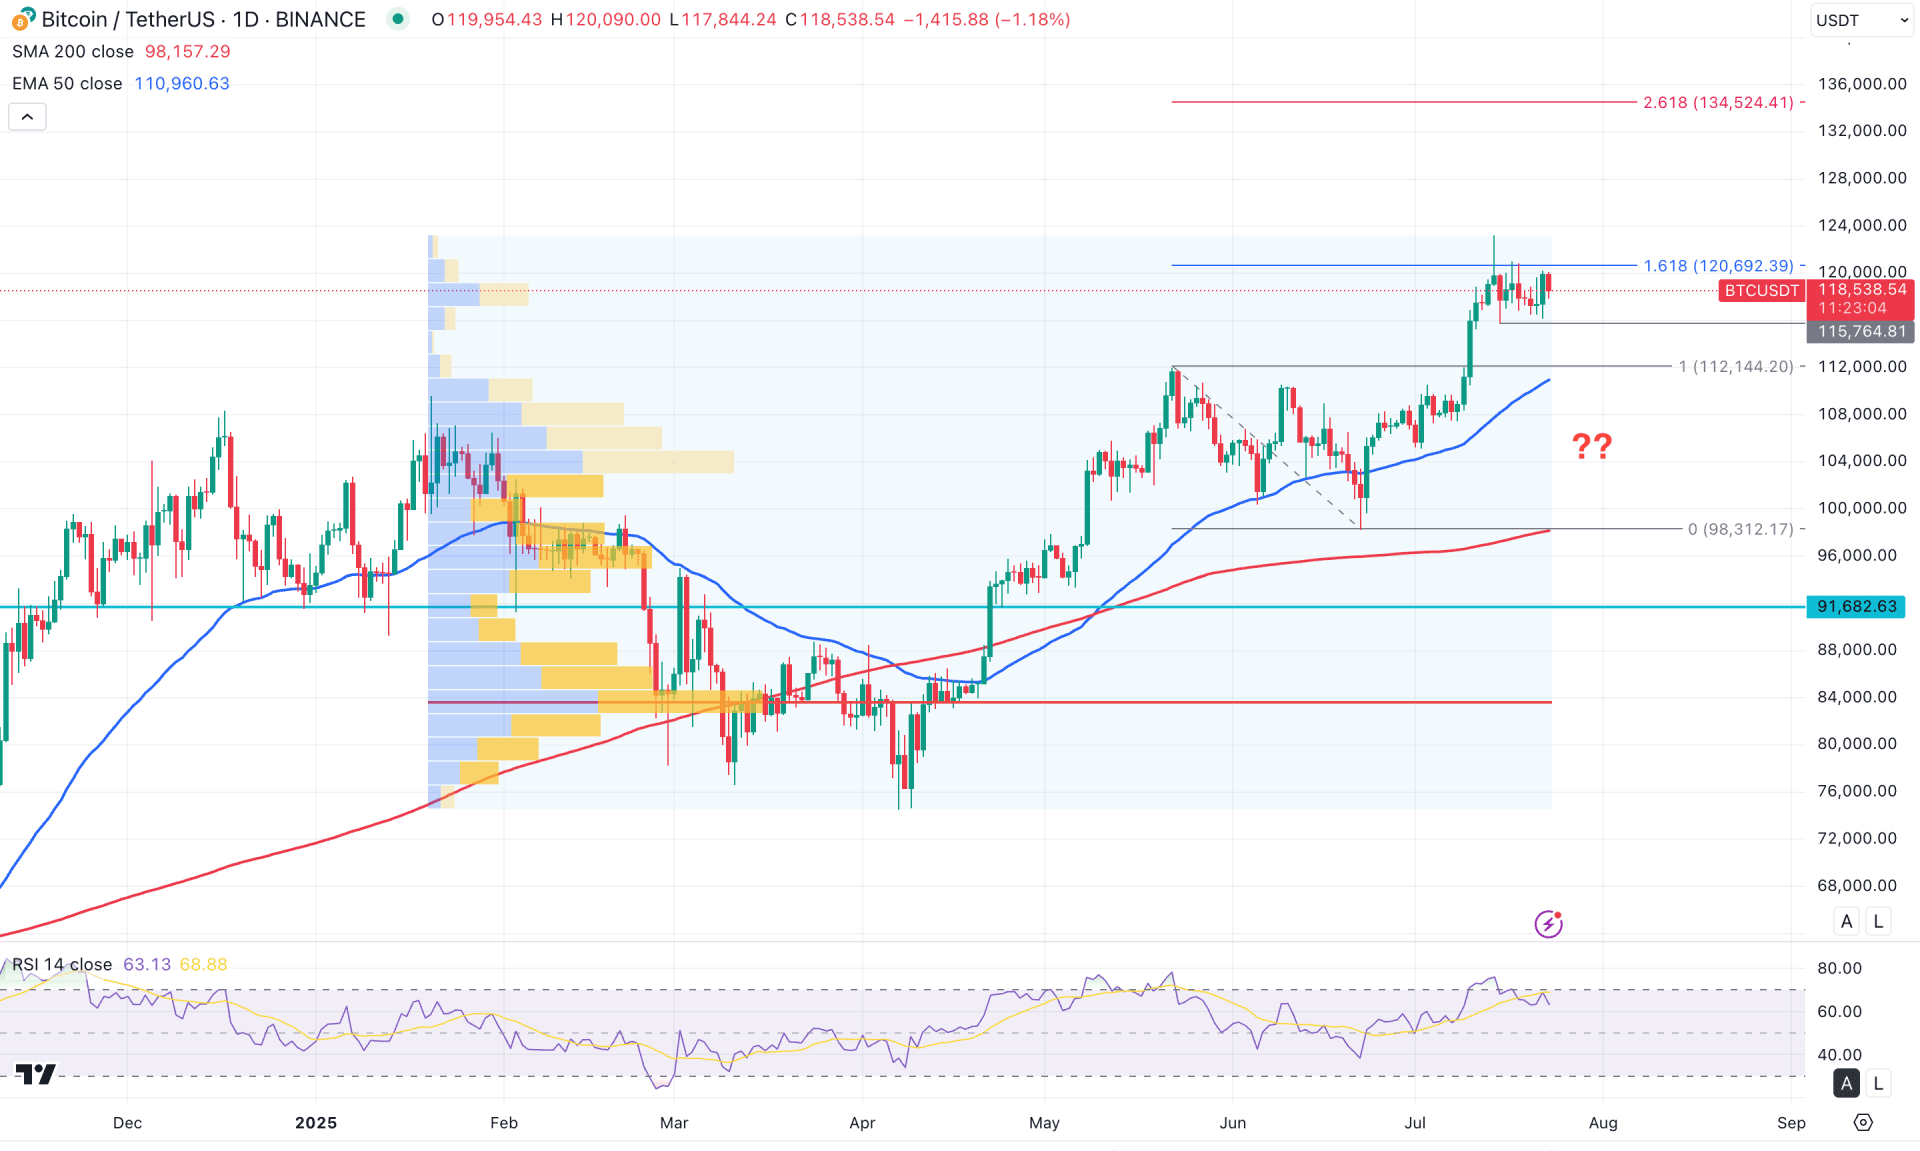
In the daily chart of Bitcoin, the ongoing bullish trend is clear as the current price is trending near the all-time high. However, some minor correction is observed at the higher price levels, which might signal a potential mean reversion correction.
The long-term market momentum remains bullish, as the monthly candle has shown consecutive bullish closes from the 74,704.20 swing low. Furthermore, the weekly price action is forming higher highs. The latest candle has closed as a bullish inside bar, which is considered a continuation pattern.
In the volume structure, bullish pressure is also valid, as the largest activity level since January 2025 is at 83,591.45. As long as the price trades above this high-volume level, the bullish pressure may extend. However, the gap between the current price and the high-volume line has expanded, which signals a possible downside correction.
A similar pattern is visible with the dynamic lines, as the gap between the current price and the 200-day simple moving average has widened. Although the broader market sentiment remains bullish, some downside correction is likely as part of a mean reversion. In this structure, the 50-day exponential moving average could act as immediate support, currently heading upward below the 112,144.20 swing level.
In the secondary indicator window, the Relative Strength Index (RSI) has pulled back from the 70.00 overbought level and is heading downward. This indicates a possible top formation. Although no divergence is visible, the overall market strength appears promising, with the recent ADX level hovering around 29.30, which is well above the 20.00 threshold for trend strength.
As the price is trading within an ongoing bullish trend, a major continuation is possible after sufficient liquidity is collected. In this context, selling pressure may appear below the 115,764.81 support level before the bullish pressure resumes. The immediate 50-day exponential moving average support is marked at 110,967.79, which is above the key psychological level of 100,000.00. Since the price has reached the 161.8% Fibonacci extension level from the May–June swing, the upside possibility remains strong.
However, any immediate selling pressure below the 50-day exponential moving average could offer a short-term bearish opportunity, with the main target being the 98,312.17 level.
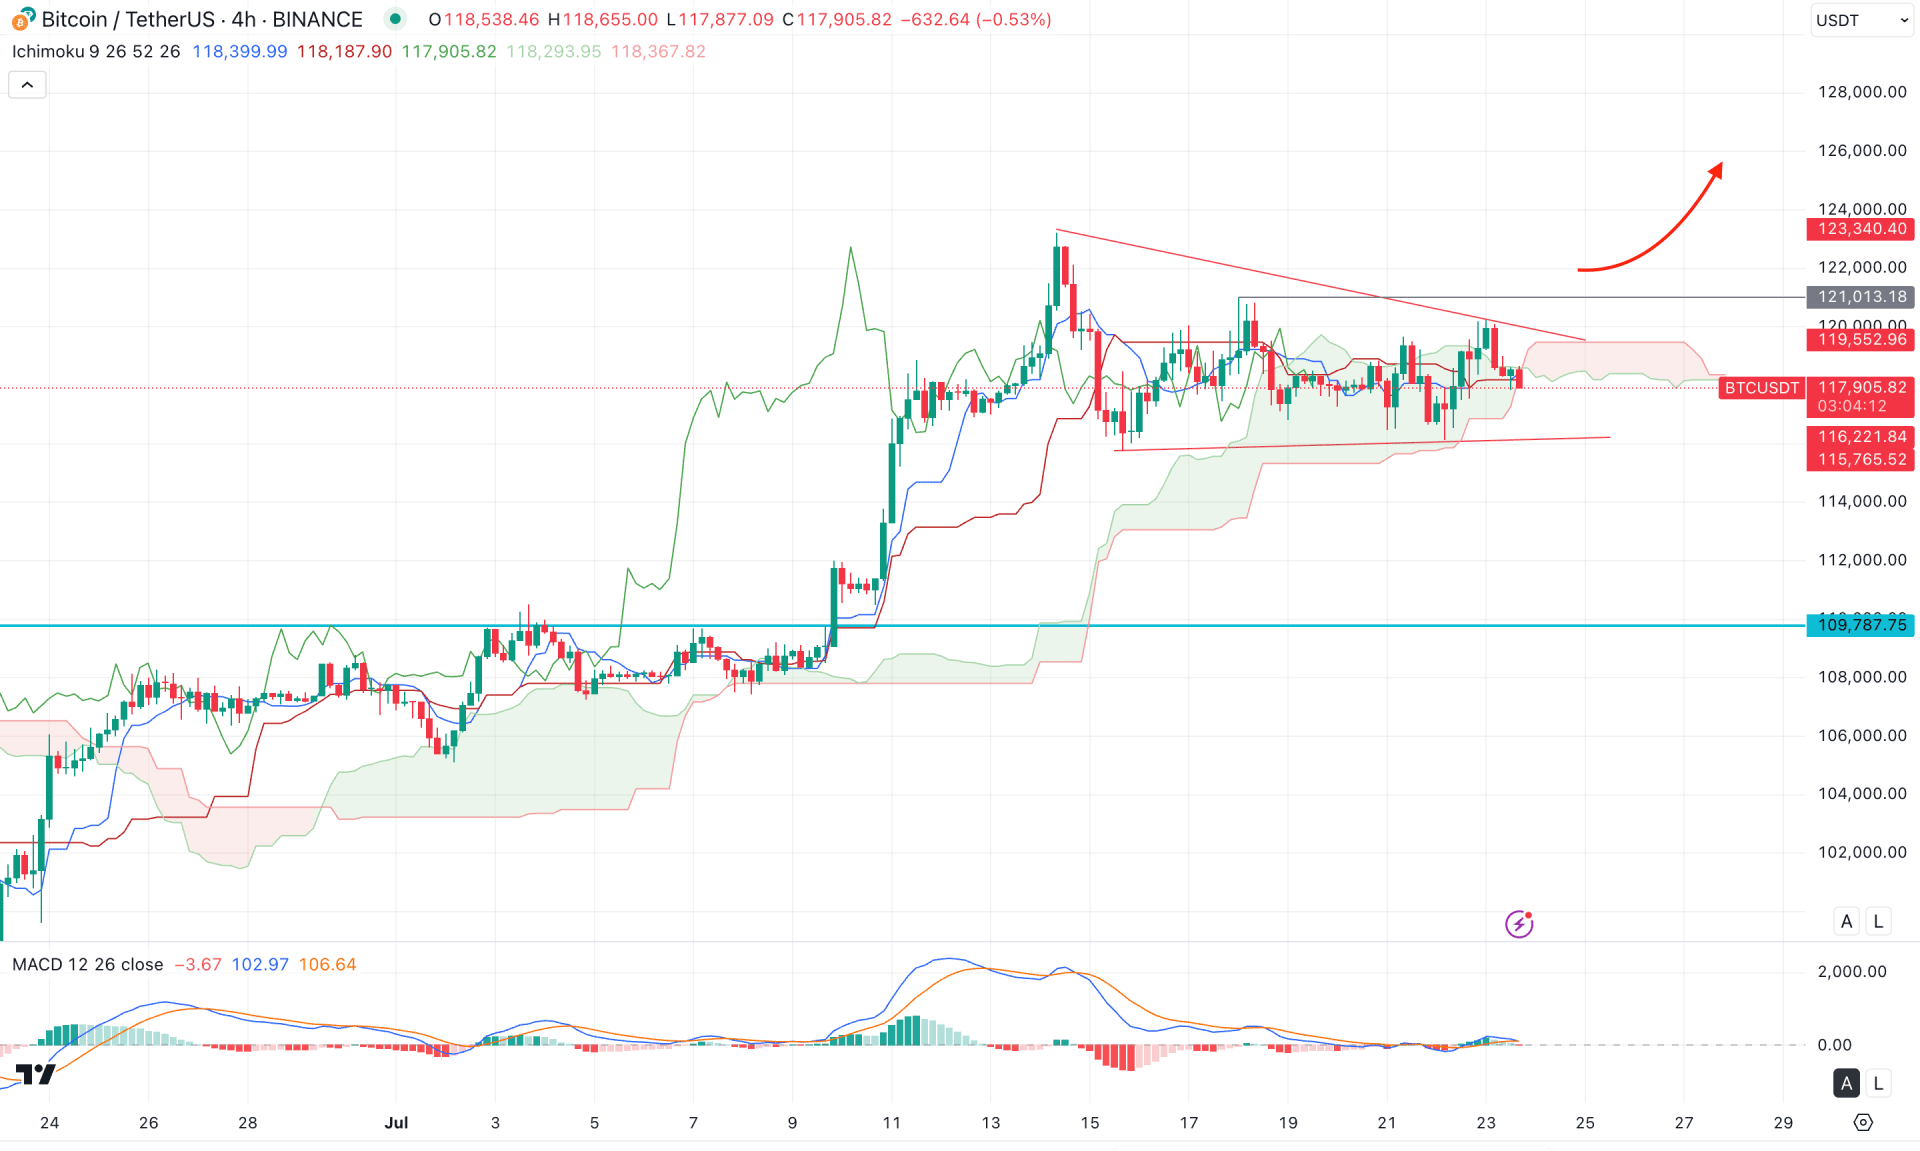
In the four-hour timeframe, the recent bullish price action has flattened above the Kumo cloud level. Moreover, the future cloud has flipped its position, but its thickness is not strong enough to anticipate a bullish continuation.
In the secondary indicator window, a sign of indecision is also visible, as the MACD histogram remains close to the neutral line with no clear direction. Additionally, the signal line is hovering near the neutral point, indicating that a breakout could occur soon.
Based on the four-hour outlook, a bullish continuation with a strong bullish candle above the triangle resistance could present a potential long opportunity, targeting the 124.00 level. However, a failure to hold the price above the 116,191.00 level could pose a challenge. In that case, the downside pressure might extend, and the price could revisit the 109,787.75 level, which is a crucial imbalance zone.
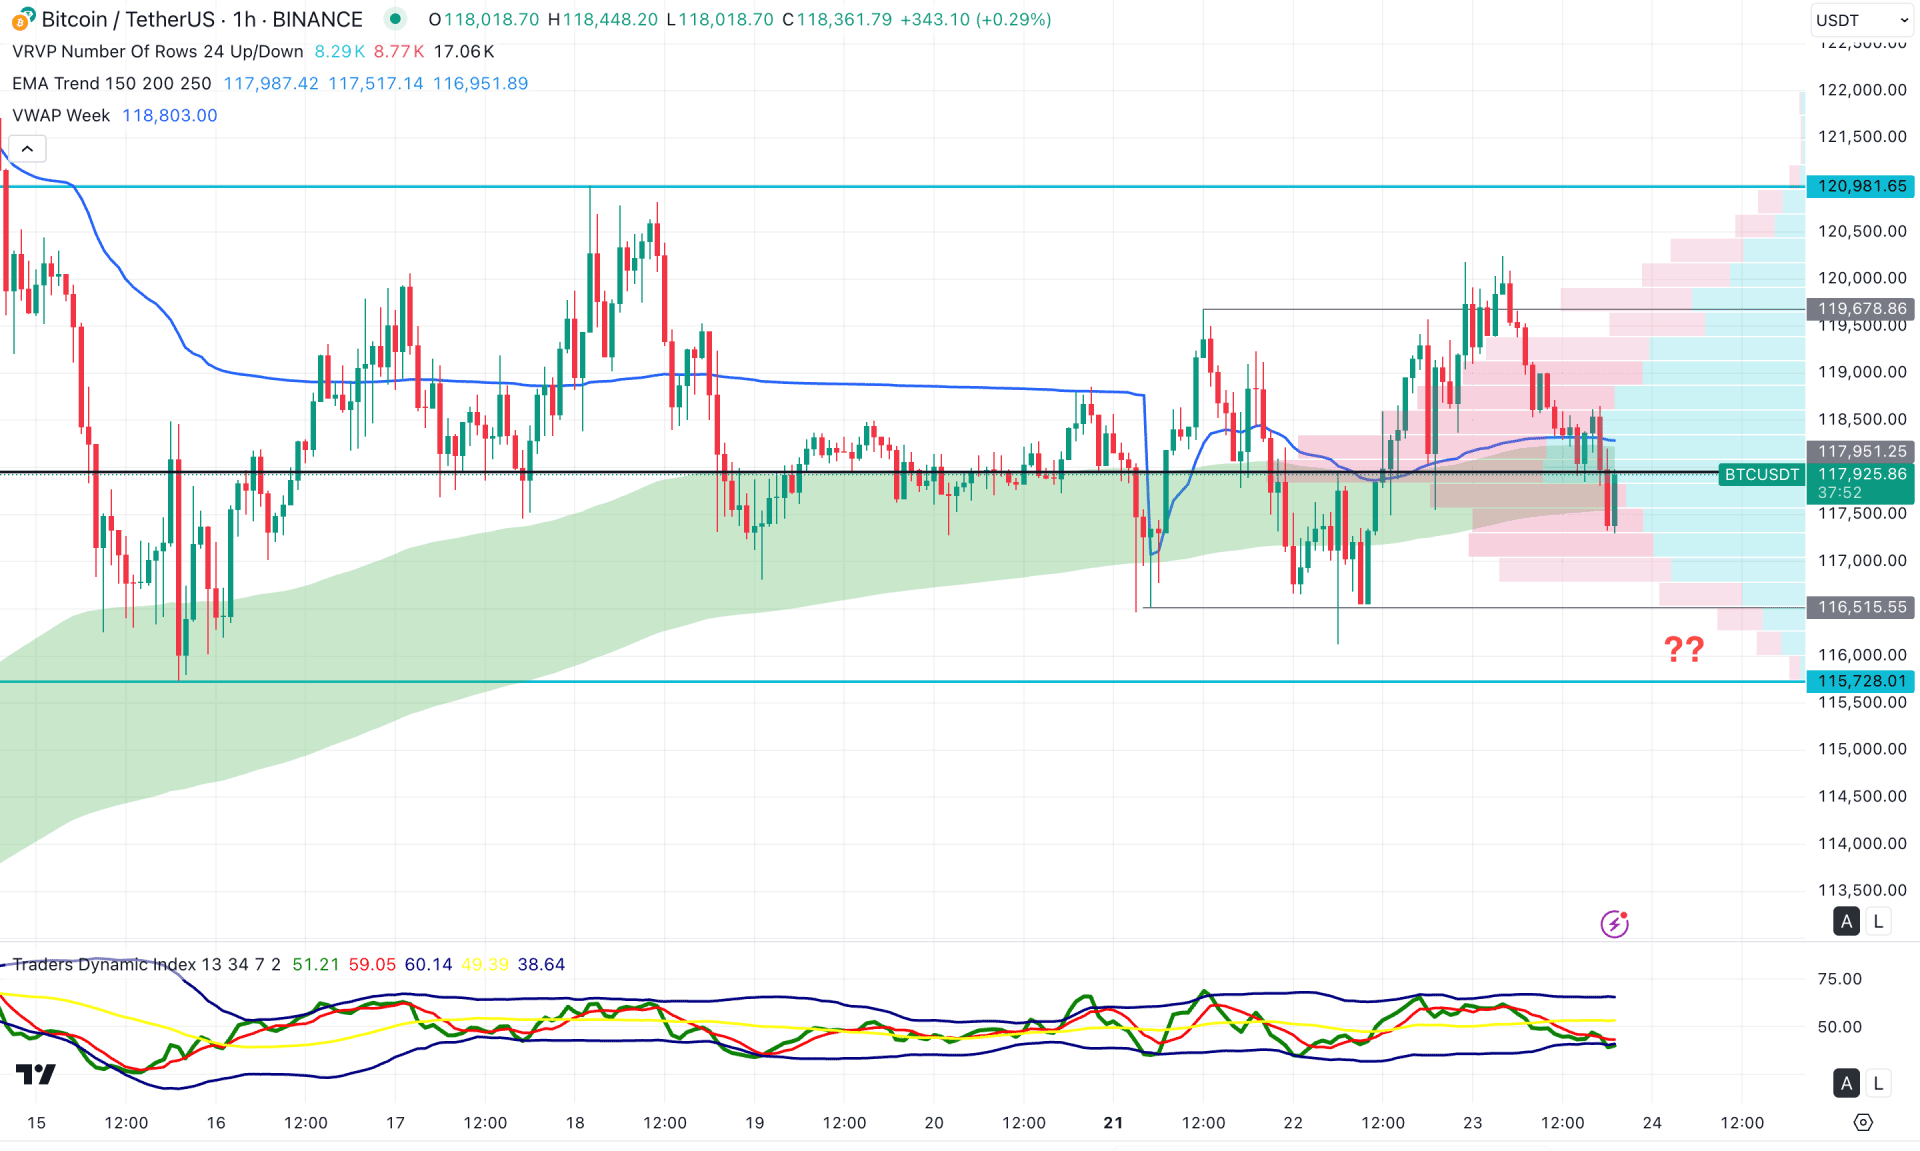
In the hourly timeframe, the recent price is trading sideways, with the largest high-volume level located at 1,07951.25. Additionally, the price is moving within the exponential moving average wave, where multiple violations are visible from the weekly VWAP line.
Based on this outlook, the primary approach is to wait for a confirmed breakout before anticipating future price direction. As the Traders Dynamic Index is positioned below the 50.00 line, downside pressure may extend, where the 115,728.01 level could act as the ultimate bottom. A break below this level could validate a short-term opportunity, targeting the 110,000.00 level.
On the other hand, any bullish extension may find resistance near the 119,678.86 level. A bullish continuation above the 120,981.65 level would validate a long-term bullish trend.
Based on the current market outlook, BTC/USDT has shown signs of weakness near the top, which may signal extended downward pressure. However, the price action remains solid on the buyers' side. A valid bearish break below the 115,728.01 level is required before considering any short opportunity.


