
Published: January 10th, 2024
On Tuesday, a tweet purporting to be from the US Securities and Exchange Commission (SEC) on X (previously Twitter) announcing approval of all Spot Bitcoin ETF applications caused a fuss in the cryptocurrency market. Chairman Gary Gensler exposed the falsehood of the tweet, indicating that the regulator's social media account had been compromised.
The SEC breach had a significant repercussion, leading to liquidations totalling more than $220 million within 24 hours. This event ranks as the second most substantial of its kind in 2024. According to data from CoinGlass, over 70,000 traders were adversely affected by this upheaval.
Liquidations disproportionately affected long traders, who incurred 60.47% of the overall $220 million in losses. Significantly, among the overall exchange liquidations of $36.66 million, the ByBit exchange witnessed the most substantial individual liquidation, amounting to $6 million in value.
Discussions have ensued concerning whether the market had already accounted for the consequences of the approval of a Spot Bitcoin ETF. A prominent cryptocurrency analyst predicted that candidates would compete for a portion of the $10 billion to $20 billion in anticipated fees, which would increase marketing efforts.
Peter Schiff, an economist, argued that a spot ETF might not be advantageous for the asset, speculating that it might induce a "sell the news" scenario.
Let’s see the upcoming price direction from the BTC/USDT technical analysis:
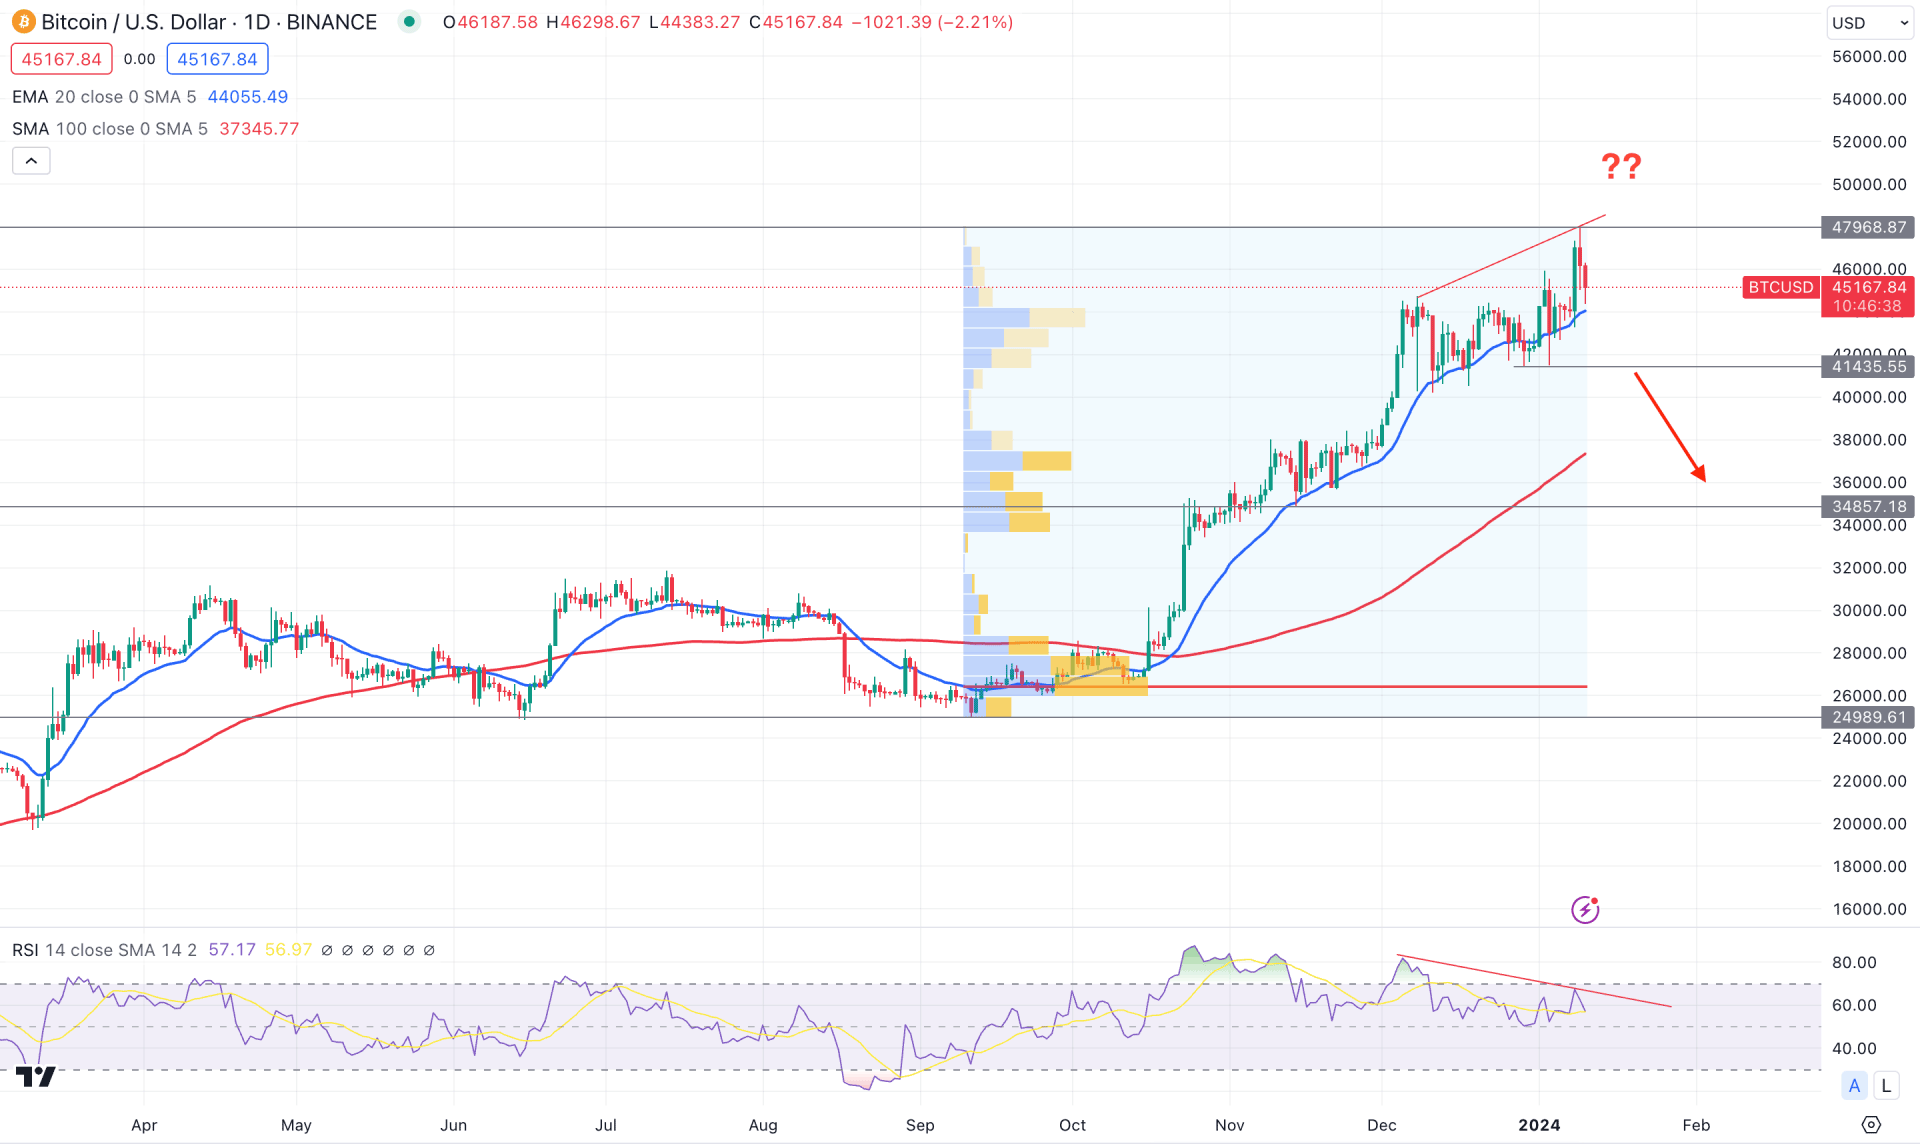
In the daily chart, the broader market direction is bullish, which is supported by fundamental factors like war and ETF approval.
The monthly chart shows a bullish continuation, forming consecutive higher highs after the 2nd quarter of 2023. Moreover, the weekly chart shows corrective pressure, while the current price faces resistance from RSI Divergence.
In the volume structure, the most active level since the September 2023 low is at 26,390.87, which is way below the current price. It is a sign that bulls have overextended the price in the last 5 months, and a downside rebound could come at any time.
The bullish trend continues in the daily price, with a strong daily candle above the dynamic 20-day EMA. Moreover, the 100-day SMA is below the current price, working as a strong support level.
In the secondary window, the bullish possibility is still potent as the 14-day Relative Strength Index (RSI) is above the 70.00 line. Moreover, an RSI divergence is visible, which needs confluence support from the near-term price action.
Based on the daily price outlook, BTC/USDT could face a considerable downside correction after coming below the 41,435.55 level.
On the bullish side, any failure to break below the 42,000.00 to 40,000.00 psychological area with an immediate recovery could be a long opportunity. In that case, bulls may extend the momentum towards the 55,000.00 to 60,000.00 zone.
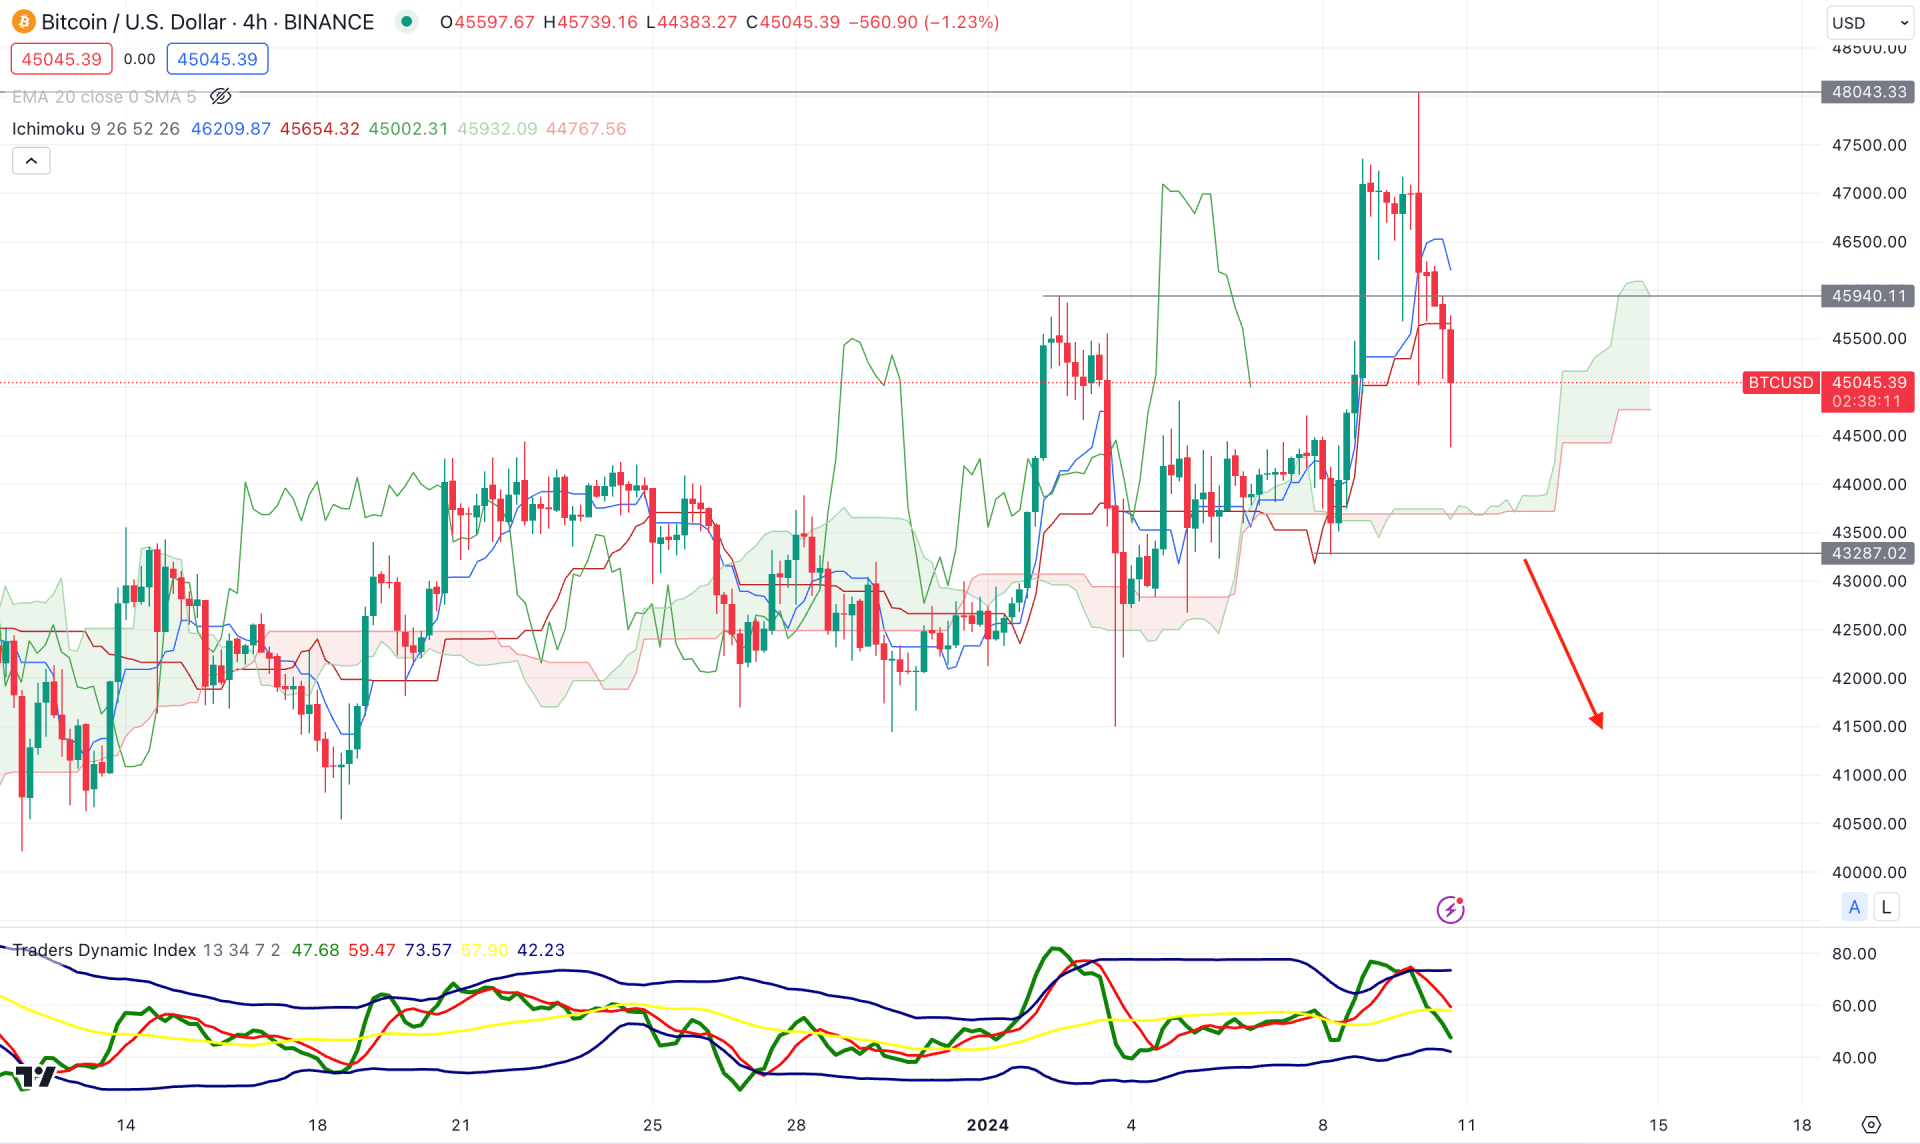
In the H4 timeframe, a bullish trend is visible as the current price formed a new swing high above the Ichimoku Cloud zone. However, a sufficient downside correction is pending as there is a CHoCH formation at the dynamic Kijun Sen level. Therefore, investors should monitor how the price reacts at the 43,287.02 swing low, as a bearish H4 candle below this level could be a short opportunity towards the 40,000.00 psychological support.
On the other hand, bullish may resume gaining momentum after reaching the 50,000.00 to 55,000.00 zone with a valid bullish rejection candlestick above the dynamic Kijun Sen level.
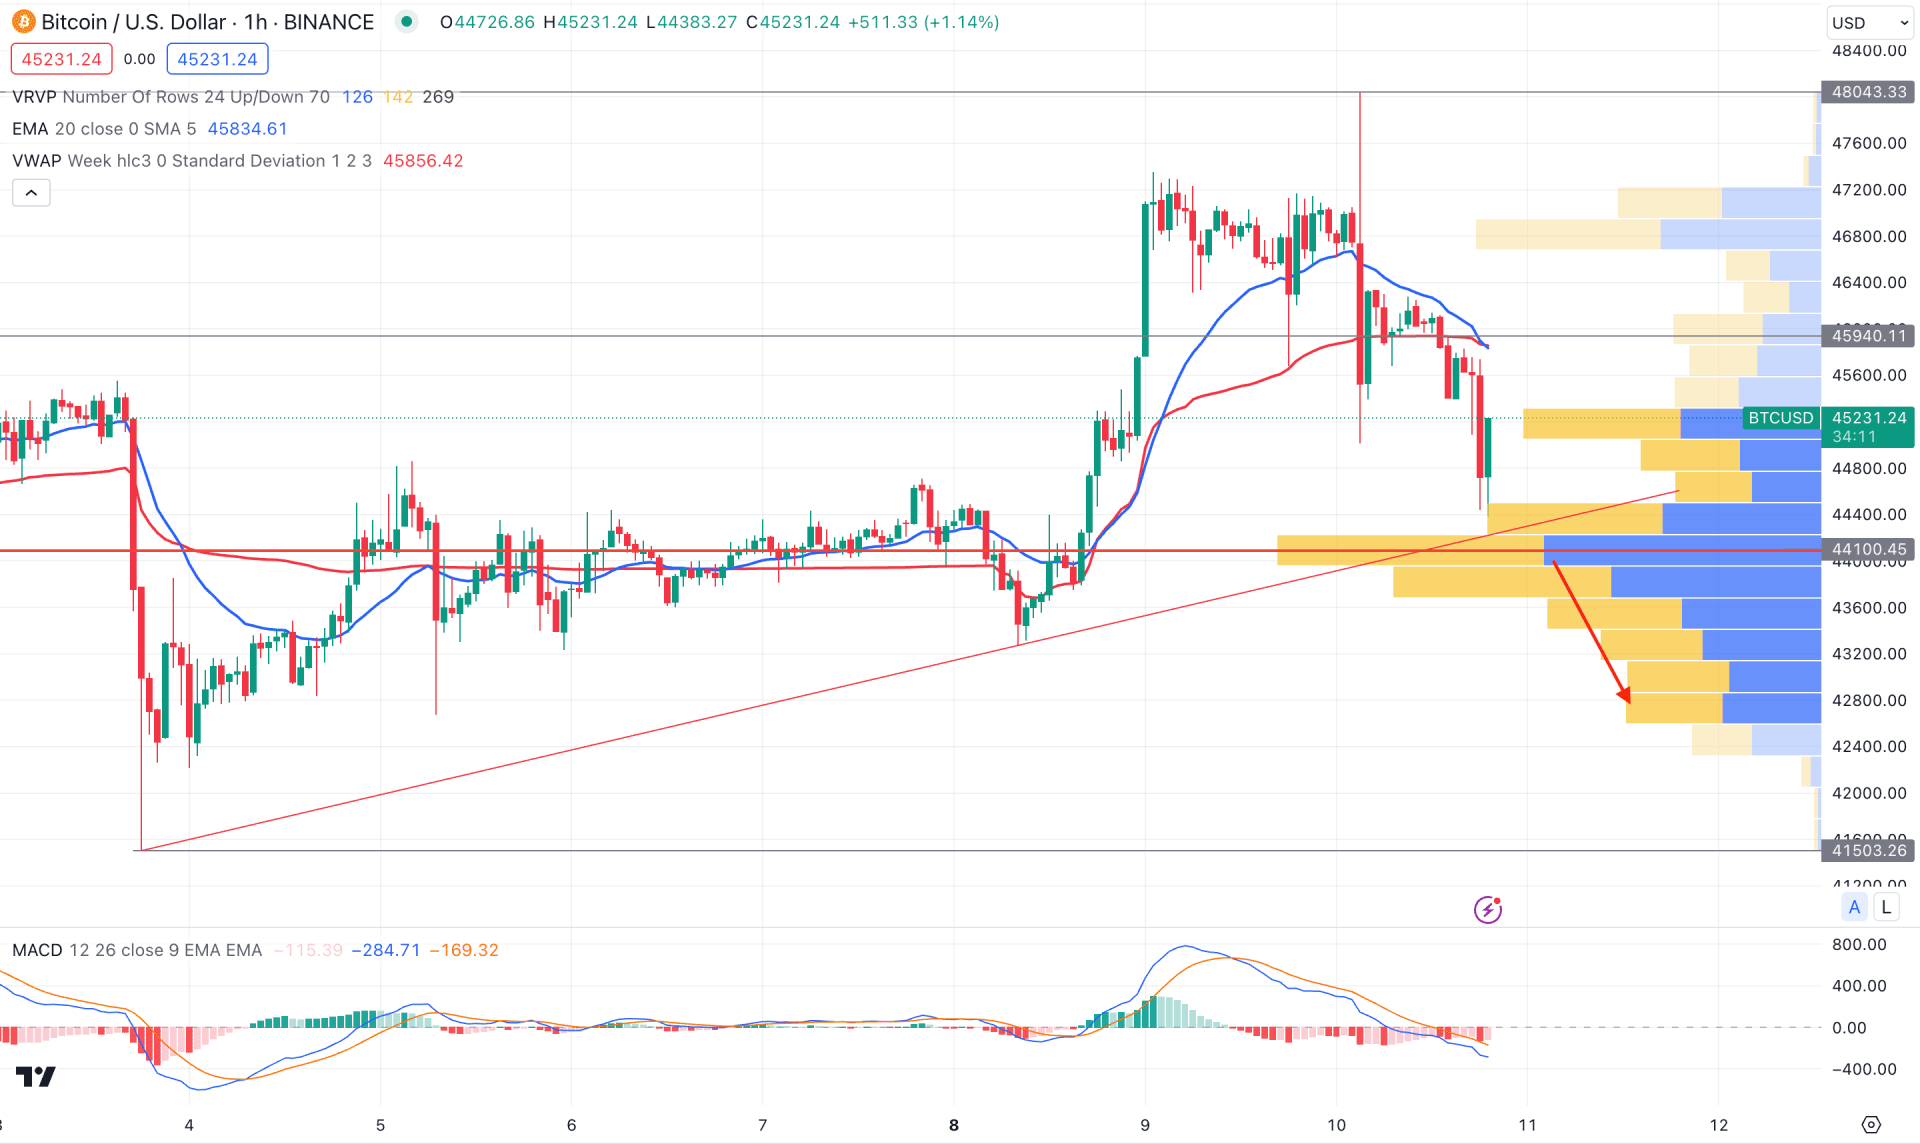
The overall market structure in the hourly chart is bullish, but the recent divergence with the MACD signal line indicates buyers’ weakness. Moreover, the visible range high volume level is at 44,100.00 level, which is just below the current price.
The main chart shows downside pressure as the recent price moved below the dynamic 20 EMA and weekly VWAP with a bearish H1 close. In that case, a new low formation below the 44,000.00 level could be a way to grab sell-side liquidity before providing a long opportunity.
However, a strong selling pressure below the 41,500.00 level could eliminate the current bullish structure at any time.
Based on the overall market momentum, the upcoming price direction of BTC/USDT depends on how the ETF's approval comes. A downside correction might come after forming a valid price action in the H4 timeframe because the price is already priced before the event.


