
Published: August 10th, 2023
As per the recent finding, bitcoin mining difficulty rises by 0.12%. The index reached 52.39T. The average hash rate since the previous change was 374.85 EH/s.
On the other hand, the US Federal Reserve has increased its supervision of regulated banks involved in crypto and stablecoin transactions. Financial institutions must now obtain written authorization from the agency before issuing, retaining, or transacting crypto assets.
The stablecoin market could grow from $125 billion today to $2.8 trillion in the next five years, Bernstein predicts.
Futures tied to Wall Street's tech-heavy index Nasdaq rose 0.67%, recovering part of Wednesday's 1.10% decline that perhaps capped Bitcoin's upside above $30,000. Unconfirmed rumors of an early leak of weak CPI data influenced the action on Wednesday.
The U.S. consumer price index (CPI) is scheduled for release today, which is anticipated that the headline inflation rose 3.3% year-on-year in July following June's 3% reading. The core rate strips out the volatile food and energy component and will likely fall to 4.7% from 4.8%.
Let’s see the upcoming price direction of Bitcoin from the BTC/USDT technical analysis:
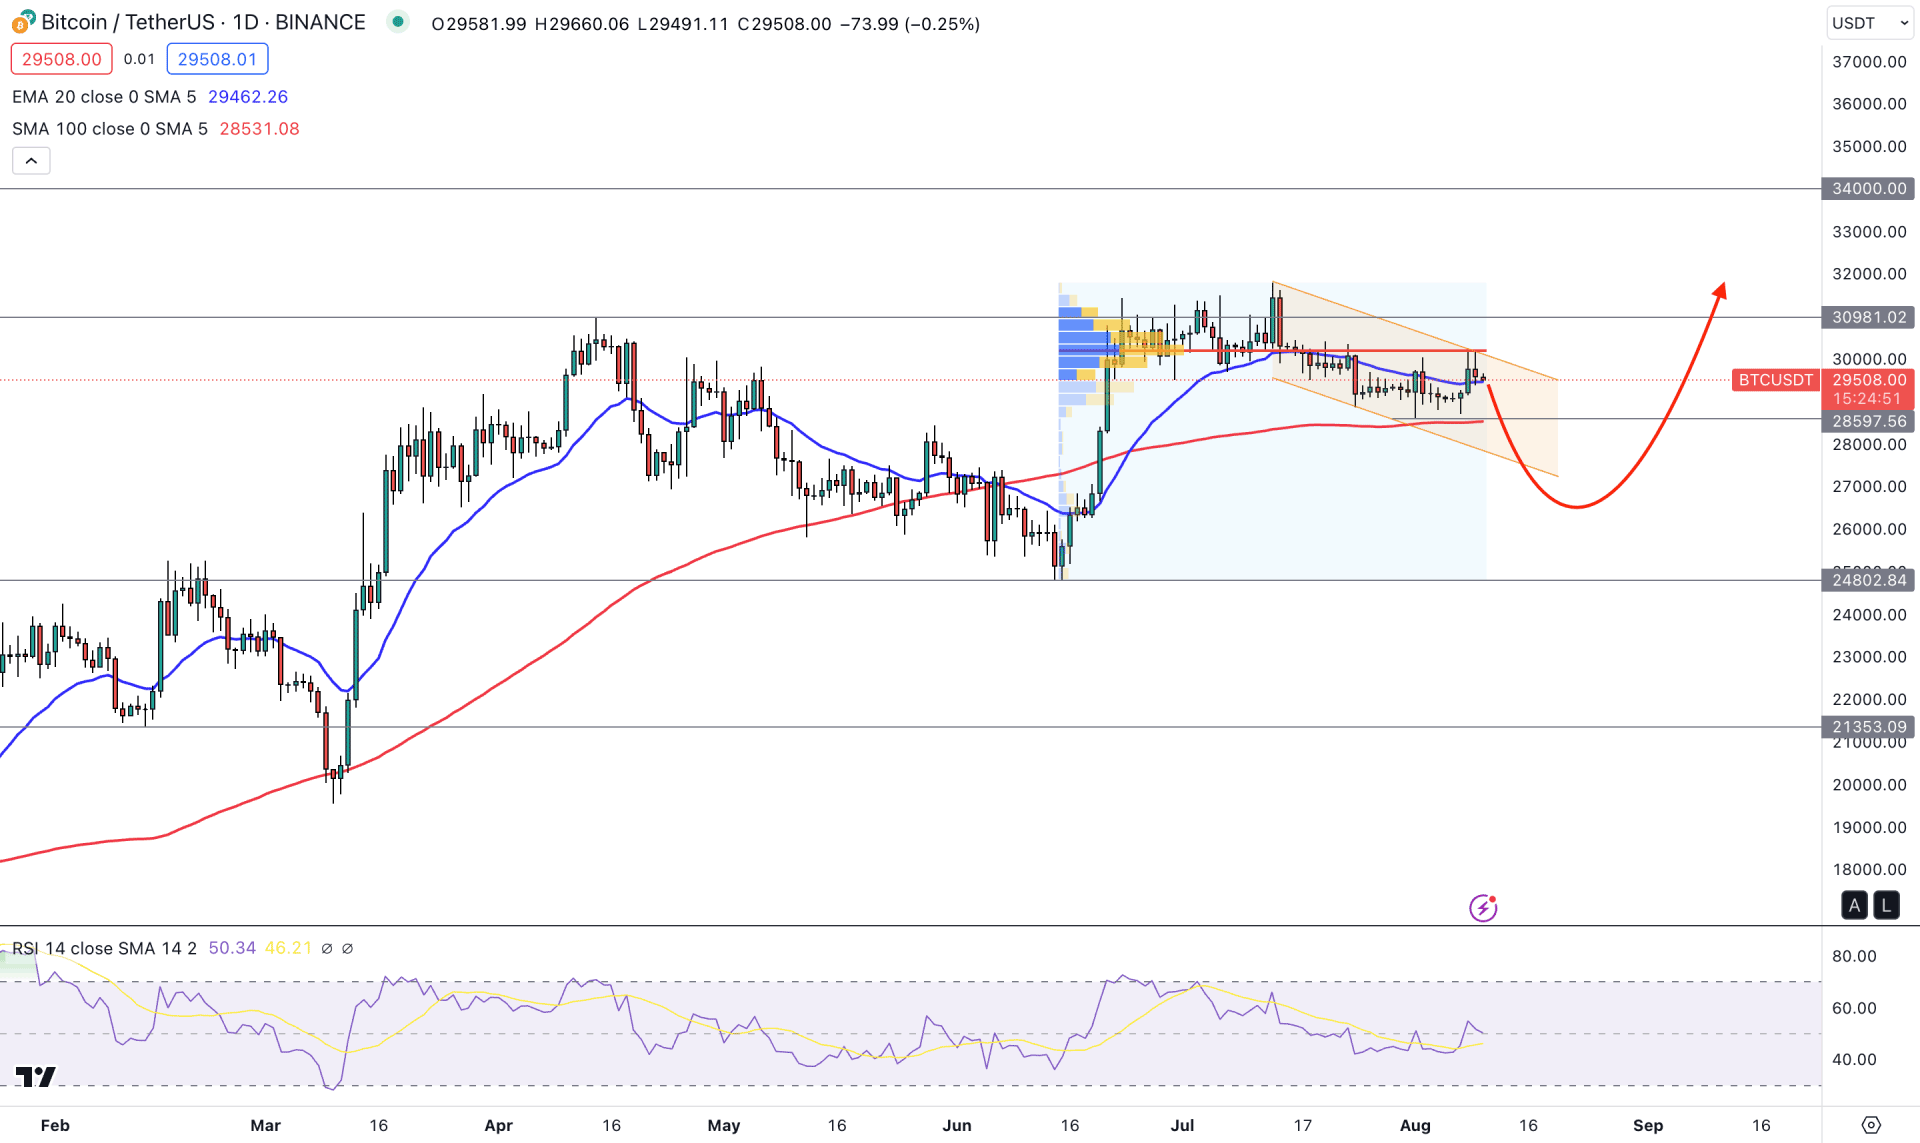
In the daily price of BTC/USDT, the broader market direction is bullish as there have been several higher high formations since the beginning of 2023. Moreover, the latest upside pressure and a new swing high formation above the April 2023 high strongly sign a bullish trend continuation.
In the higher timeframe price action, a bullish inside bar formation is visible in the monthly timeframe, which signals a trend continuation opportunity towards the buyers’ side. Also, the weekly candlesticks show a downside correction, backed by an impulsive bullish trend, which may result in upward momentum.
In the daily price, the existing buying pressure from the 24,802.84 support level is working as a strong bullish factor. Still, the current price holds this level as strong support, which may continue the bullish trend in the coming days.
The 100-day Simple Moving Average level remains flat below the current range, while the current 20-day Exponential Moving Average level works as a major intraday support. However, the current descending channel formation could see an extension, which may lower the price below the 28,597.56 support level.
The current RSI is above the 50.00 line in the indicator window, which signals active buying pressure in the market.
Based on the D1 outlook, a downside momentum below the 28,597.56 support level could fill the price inefficiency at the 28100.00 to 27029.30 area before showing a bullish trend continuation pattern. However, an immediate bullish recovery from the current channel could work a pre-breakout structure, aiming for hte 40,000.00 level.
On the other hand, breaking below the 26,000.00 level with a bearish D1 candle could increase the downside pressure in the coming days.
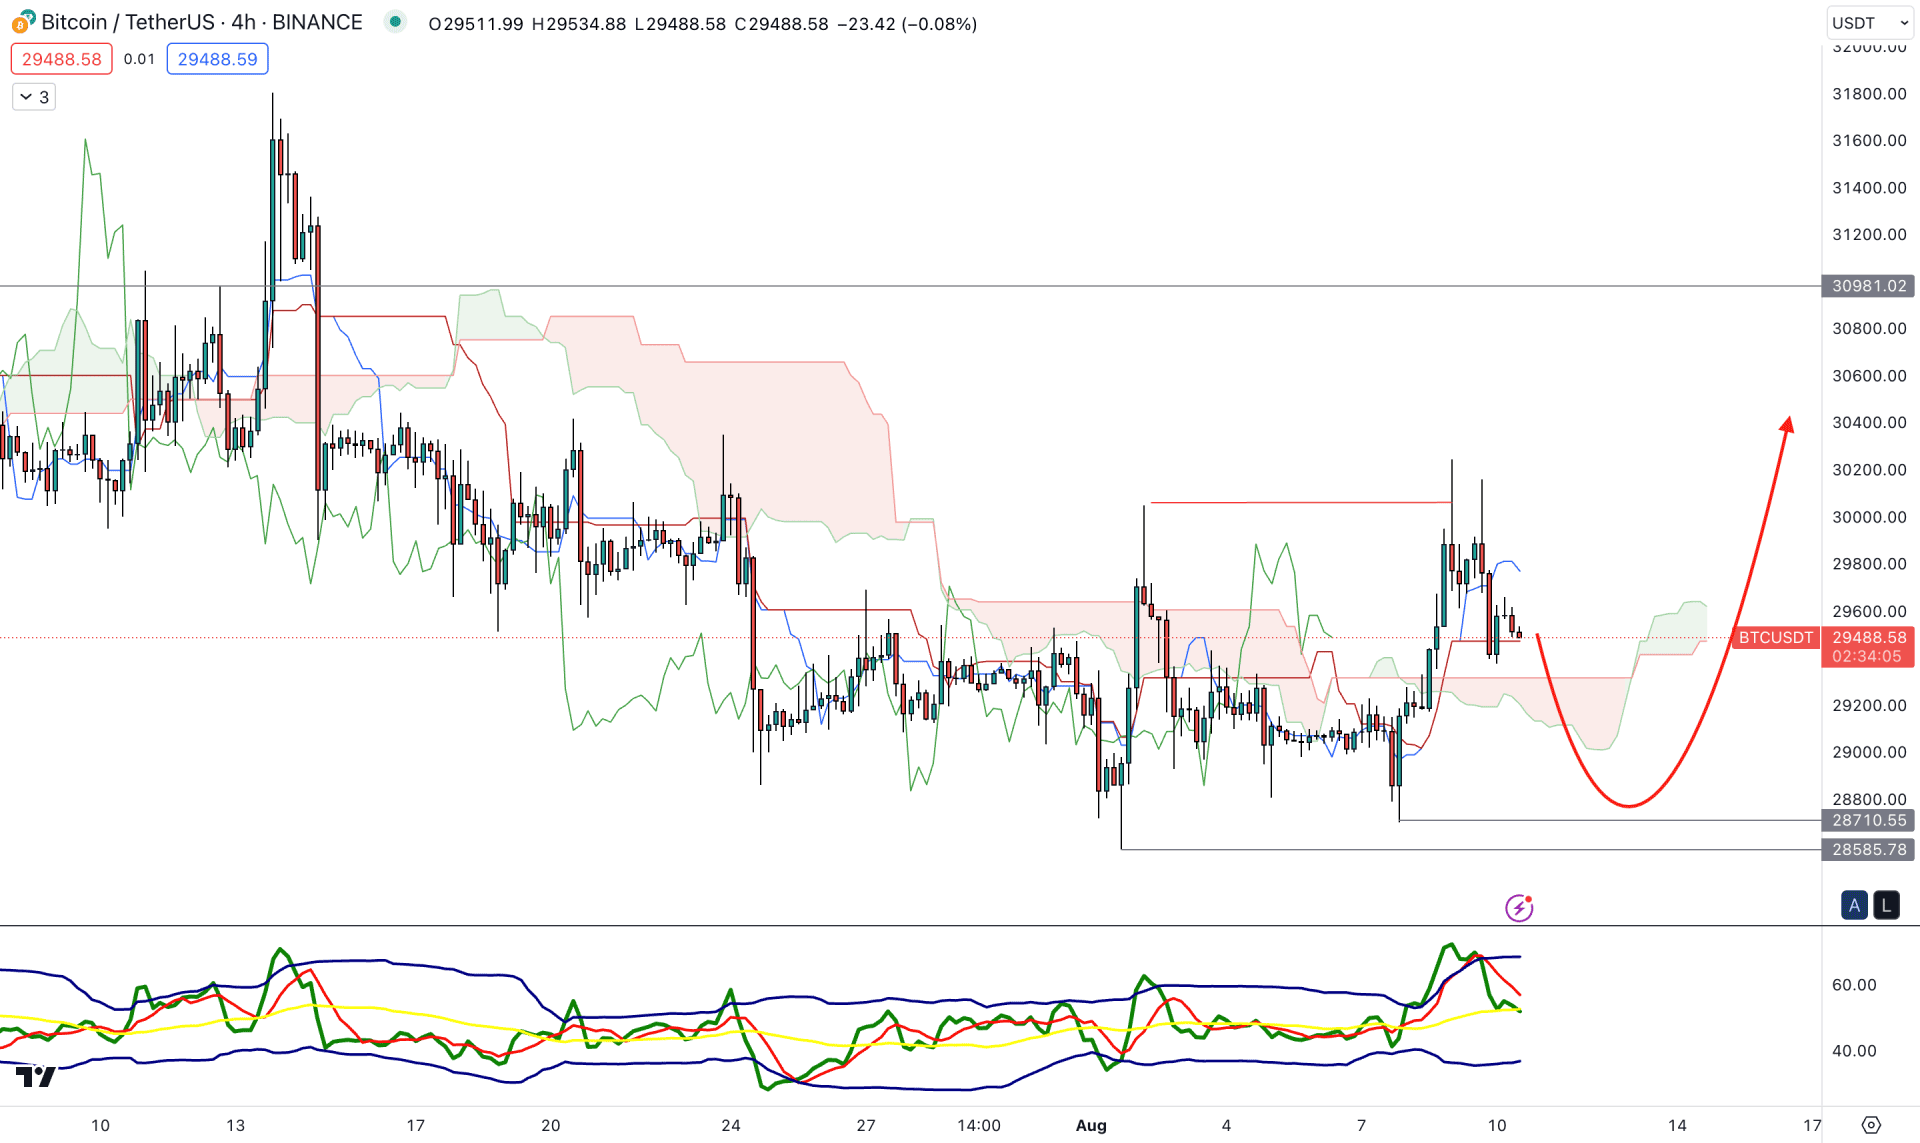
In the H4 outlook, an extreme consolidation is visible where the current price trades sideways above the Ichimoku Kumo Cloud zone. Although the future cloud is bullish, significant bullish price action is considered a bullish trend.
In the indicator window, the current Traders Dynamic Index (TDI) shows a downside possibility as a bearish reversal is visible from the upper band. Moreover, the dynamic Kijun Sen is flat below the current price, signaling indecision.
Based on this H4 outlook, investors might face a bullish trend continuation after grabbing sell-side liquidity from the 28,800.00 to 28,400.00 zone. In that case, the buying pressure may extend towards the 30,981.00 resistance level.
However, breaking below the 28,400.00 level with a bearish h4 candle could lower the price towards the 25,000.00 psychological level.
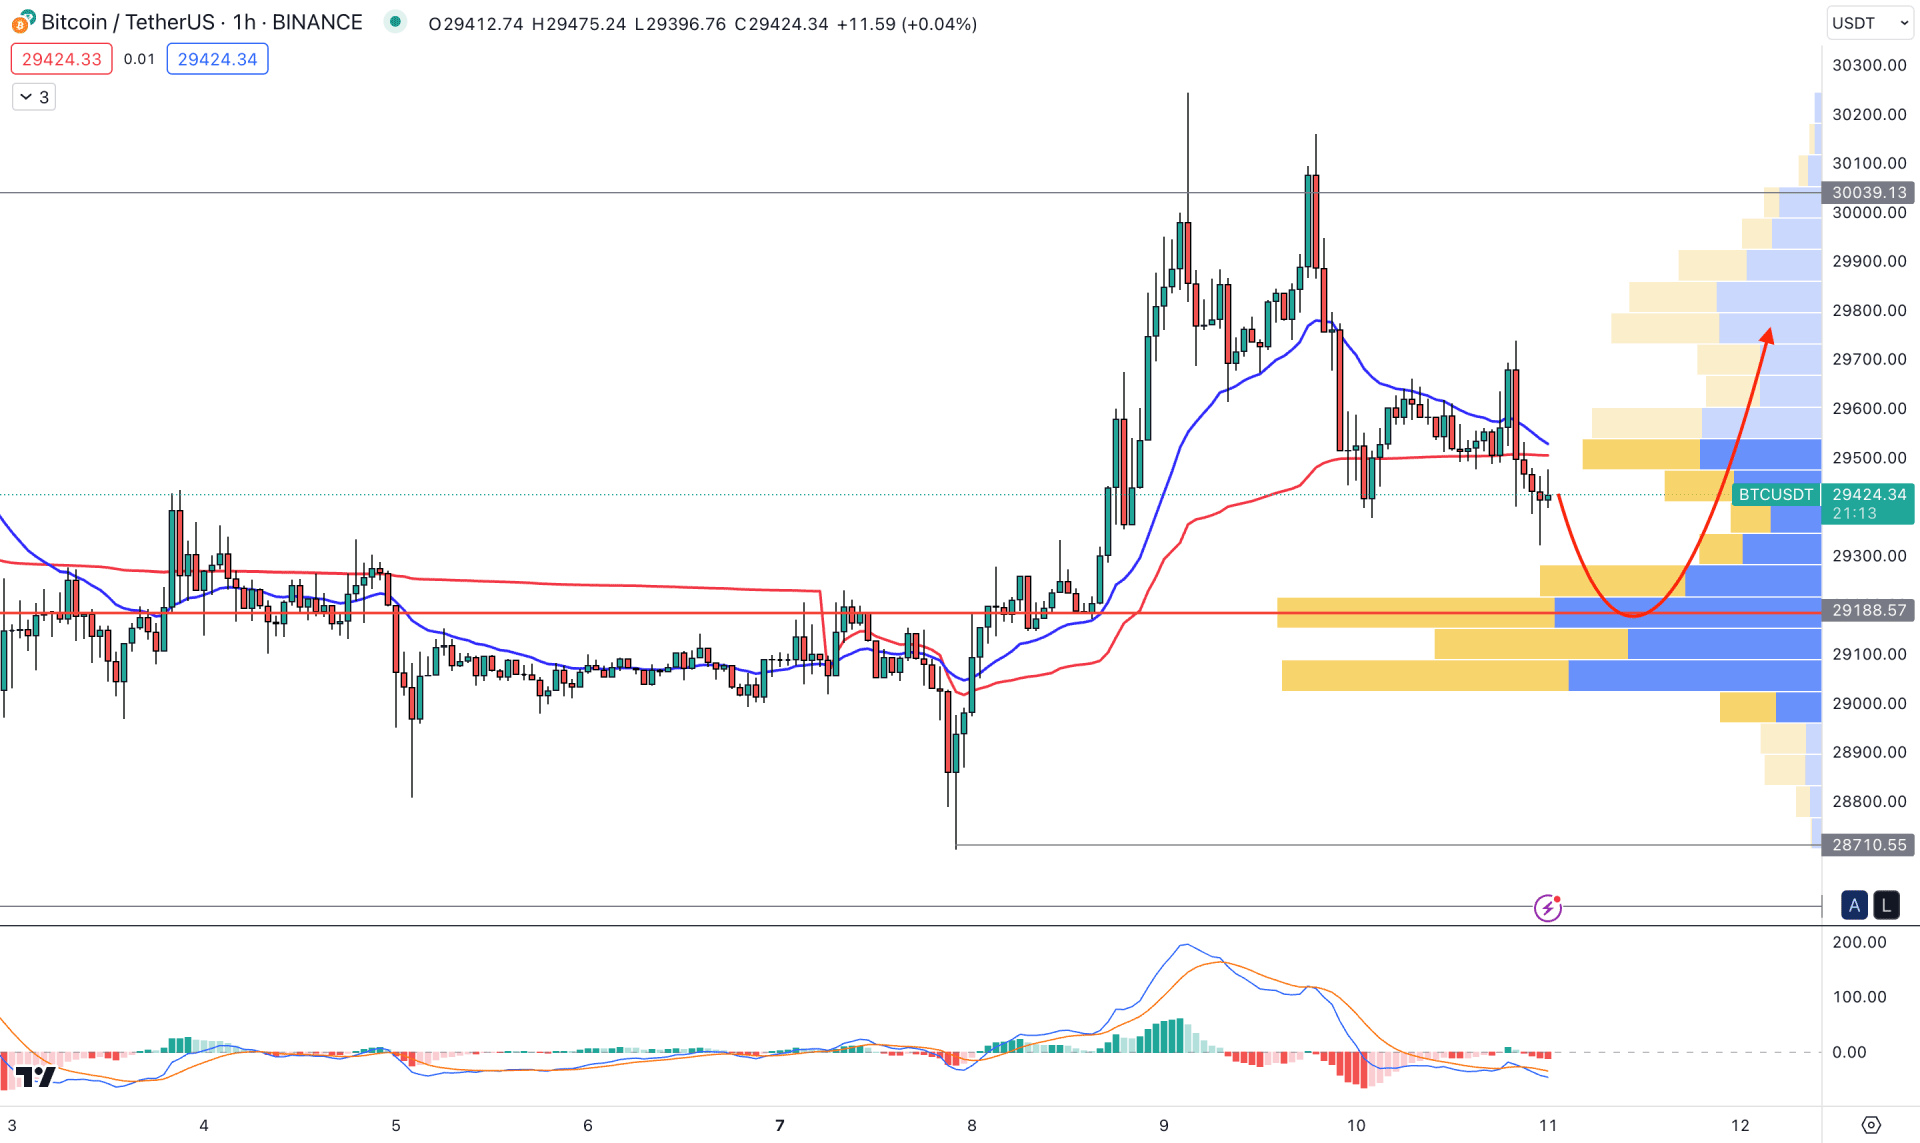
In the hourly price, BTC/USDT is trading above the visible range high volume level, which is a sign of buying pressure in the market. However, there is a strong sellers’ rejection at the 30,000.00 psychological level, which signals a buyer’s failure in the market.
In the indicator window, the MACD Histogram is bearish, while a sellers’ rejection is present from the dynamic 20 EMA level.
Based on the H1 structure, the upcoming price direction depends on how the price reacts to the 30,000.00 high or 28,585.00 low. As the current price is trading above the visible range high volume level, any bullish rejection with an H1 candle above the VWAP could increase the price toward the 31,600.00 level.
Based on the current price outlook, BTC/USDT bullish pressure could initiate from the channel breakout. As of now, the early buying opportunity needs a solid bullish rejection from intraday support areas.


