Published: October 18th, 2023
According to a recent report from CryptoQuant, the approval of Bitcoin spot exchange-traded funds (ETFs) could propel Bitcoin to a $900 billion asset, adding $1 trillion to the total cryptocurrency market. The report suggests that the first phase of institutional adoption from 2020 to 2021 will involve institutions incorporating bitcoin into their balance sheets, while the second wave will involve financial institutions granting clients access to bitcoin via spot ETFs.
Numerous financial institutions in the US have sought approval for Bitcoin spot ETFs, with potential regulatory approvals anticipated by March 2024 at the latest. If approved, the potential inflow from spot ETFs is anticipated to exceed the funds that entered Grayscale Bitcoin Trust (GBTC) during the previous bull market cycle. The Digital Currency Group, which also controls CoinDesk, manages the world's largest cryptocurrency fund, GBTC, which has $16.7 billion in assets under management.
If the issuers of the proposed bitcoin ETFs allocate 1% of their Assets Under Management (AUM) to these funds, it would add $155 billion to the Bitcoin market, according to CryptoQuant. The report also observes that during previous bull markets, Bitcoin's market capitalisation tended to grow three to five times faster than its realized capitalisation.
Let’s see the upcoming price direction from the BTC/USDT technical analysis:

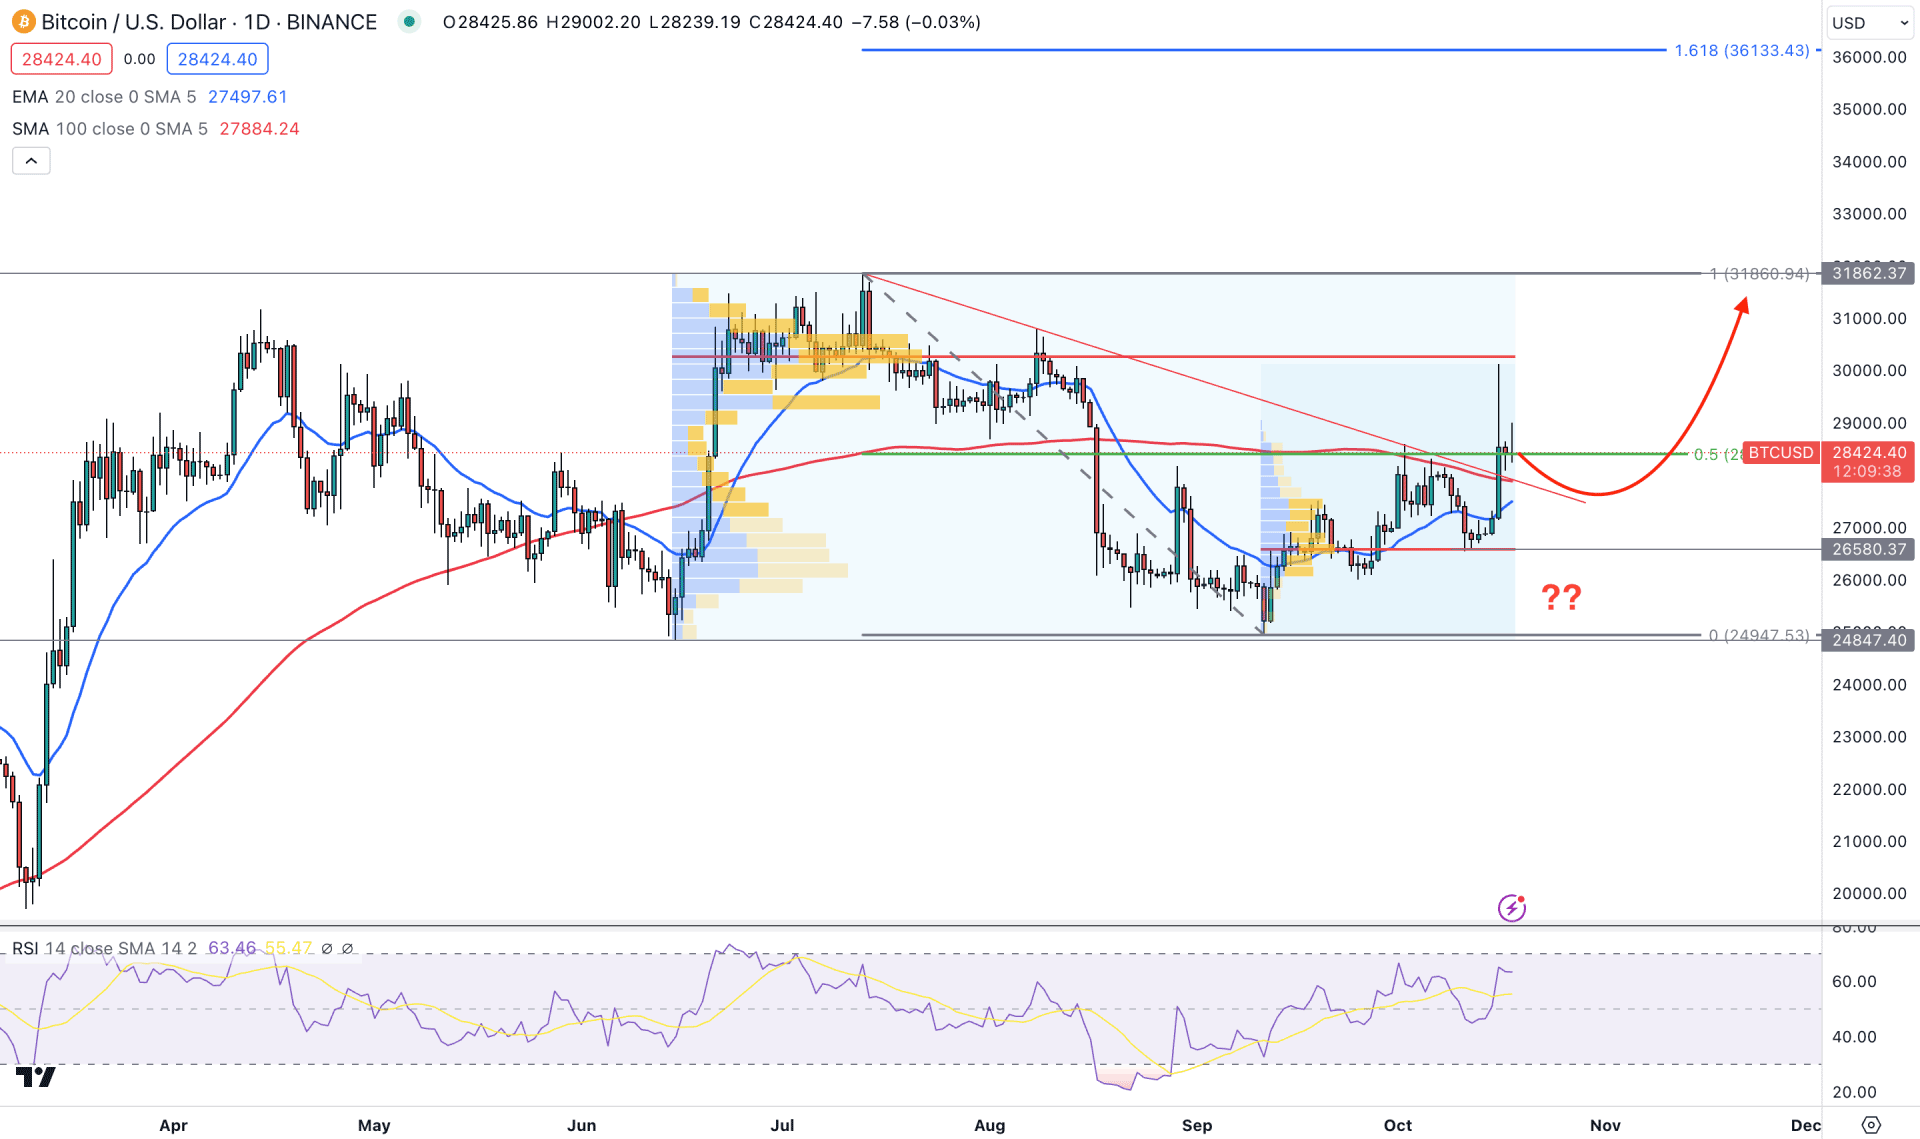
In the daily chart, the broader market direction is bullish, which is supported by fundamental factors like war and ETF approval. Moreover, the final quarter of 2023 has come, which could act as a strong bullish factor for BTC/USDT.
In the monthly chart, a bullish U-shape reversal has appeared, while a bearish inside bar formation backs the current bullish candle. Moreover, the weekly chart shows corrective pressure, while the current price faces resistance from the 100 SMA.
In the volume structure, the most active level since the June 2023 low is marked at the 30,276.76 level, which is still above the current price. It is a sign that bulls have failed to show a strong presence in the market in the last 5 months. However, another high volume level since the 11 September low is at the 26,580.37 level, which aligns with a strong static support level. As per the current high volume level, an impulsive buying pressure might come after violating the 30,276.76 level, but a corrective upside pressure is pending from the current price level.
The bullish trendline breakout is visible in the daily price, with a strong daily candle formation above it. Moreover, the dynamic 20-day EMA and 100-day SMA are below the current price, working as strong support levels.
In the secondary window, the bullish possibility is still potent as the 14-day Relative Strength Index (RSI) is above the 50.00 neutral line.
Based on the daily price outlook, BTC/USDT could face strong upside pressure in the coming days. However, a conservative downside correction is pending after the trendline breakout. Therefore, any strong bullish rejection from the 27,510.00 to 26,200.00 area could be a long opportunity, targeting the 36,133.54 Fibonacci Extension level.
On the bearish side, any failure to break above the 30,000.00 psychological level with an immediate downside correction towards the 25,000.00 level could be a long opportunity. In that case, sellers may extend the momentum towards the 20,000.00 level.

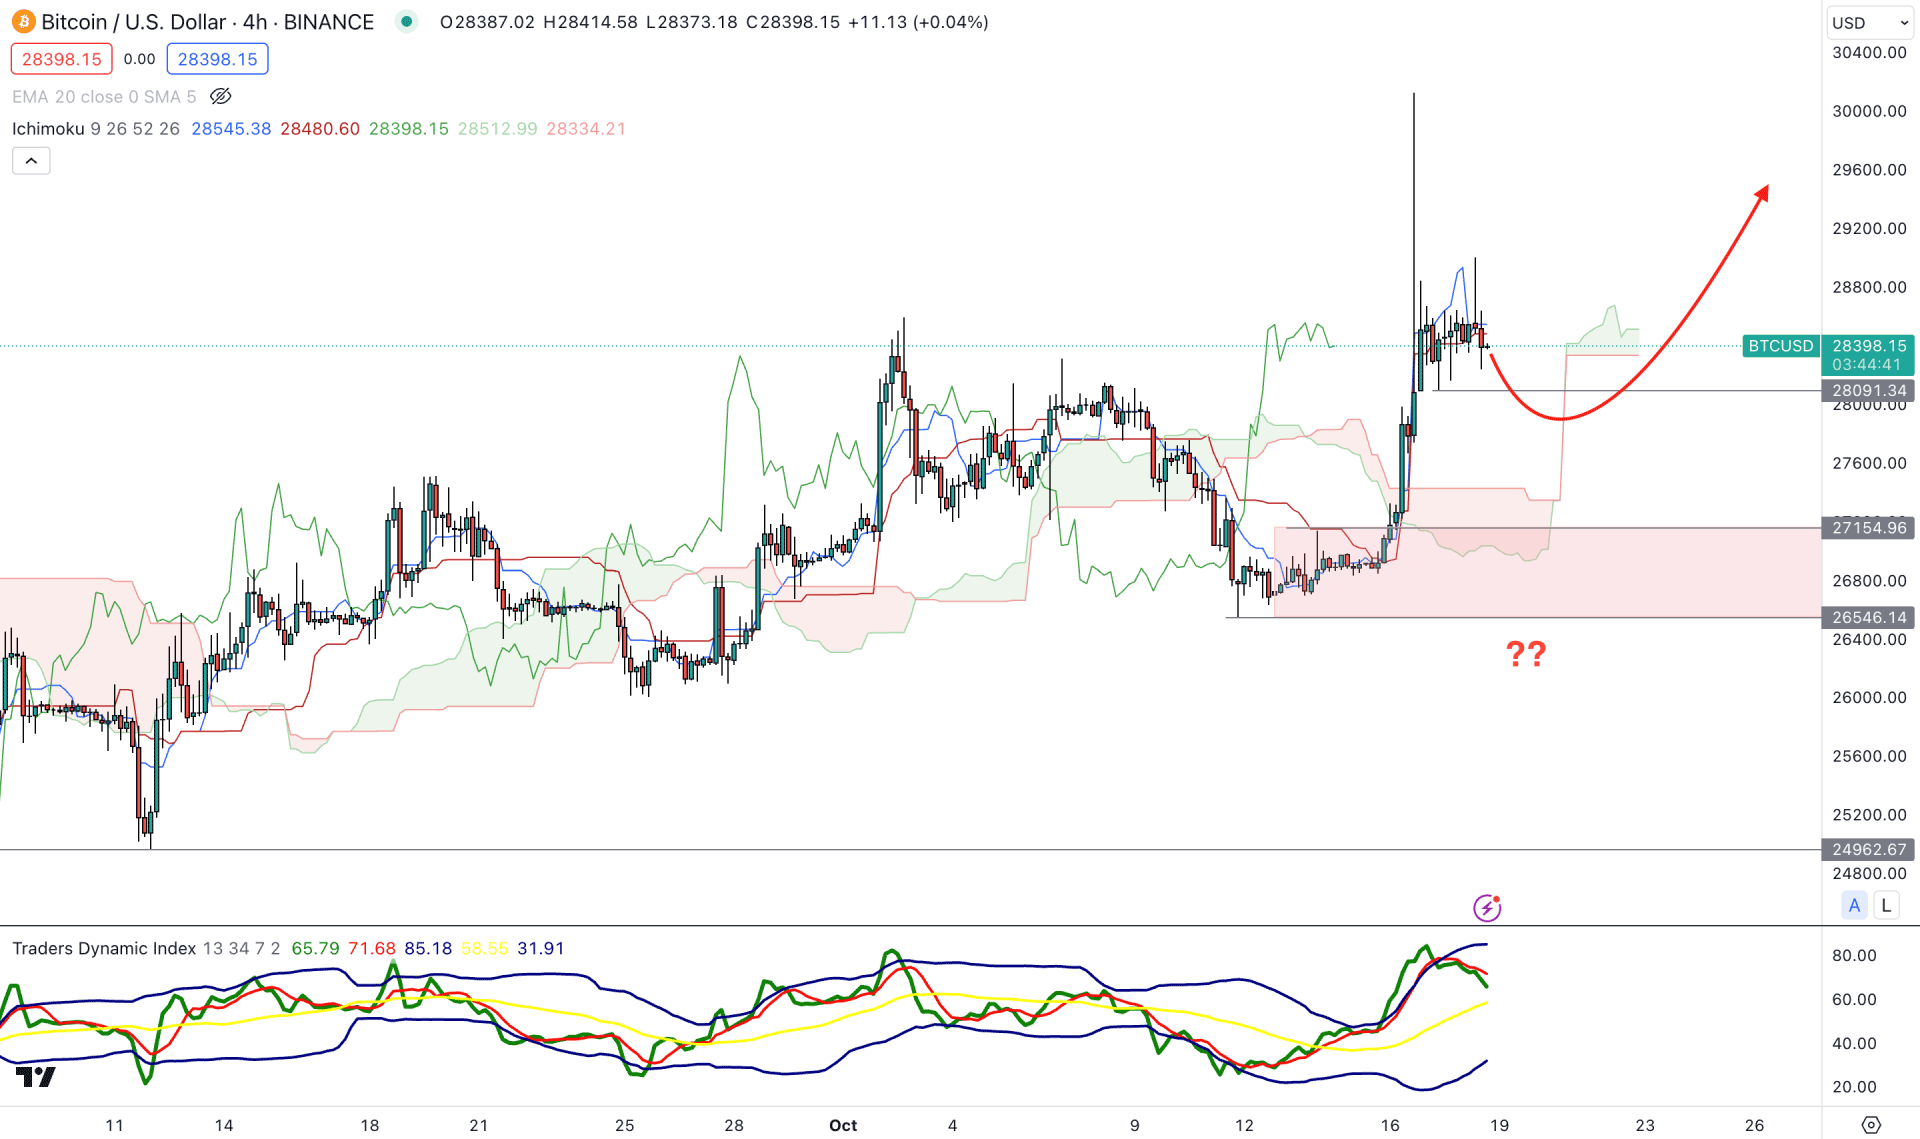
In the H4 timeframe, a bullish continuation opportunity is visible as the current price formed a new swing high above the Ichimoku Cloud zone. Moreover, the Traders Dynamic Index (TDI) has reached the overbought level, which is a sign of a strong bullish trend in the market.
Based on the H4 outlook, a sufficient downside correction is pending as there is a strong bullish spike above the dynamic Kijun Sen level. Therefore, investors should monitor how the price reacts at the 28,091.34 swing low, as a bearish H4 candle below this level could be a short opportunity towards the 27,441.34 cloud support.
On the other hand, bullish may resume gaining momentum after reaching the 27,200.00 to 26,500.00 zone with a valid bullish rejection candlestick. However, an additional sell-side pressure with a bearish H4 candle below the 26,000.00 area could limit the bullish possibility.

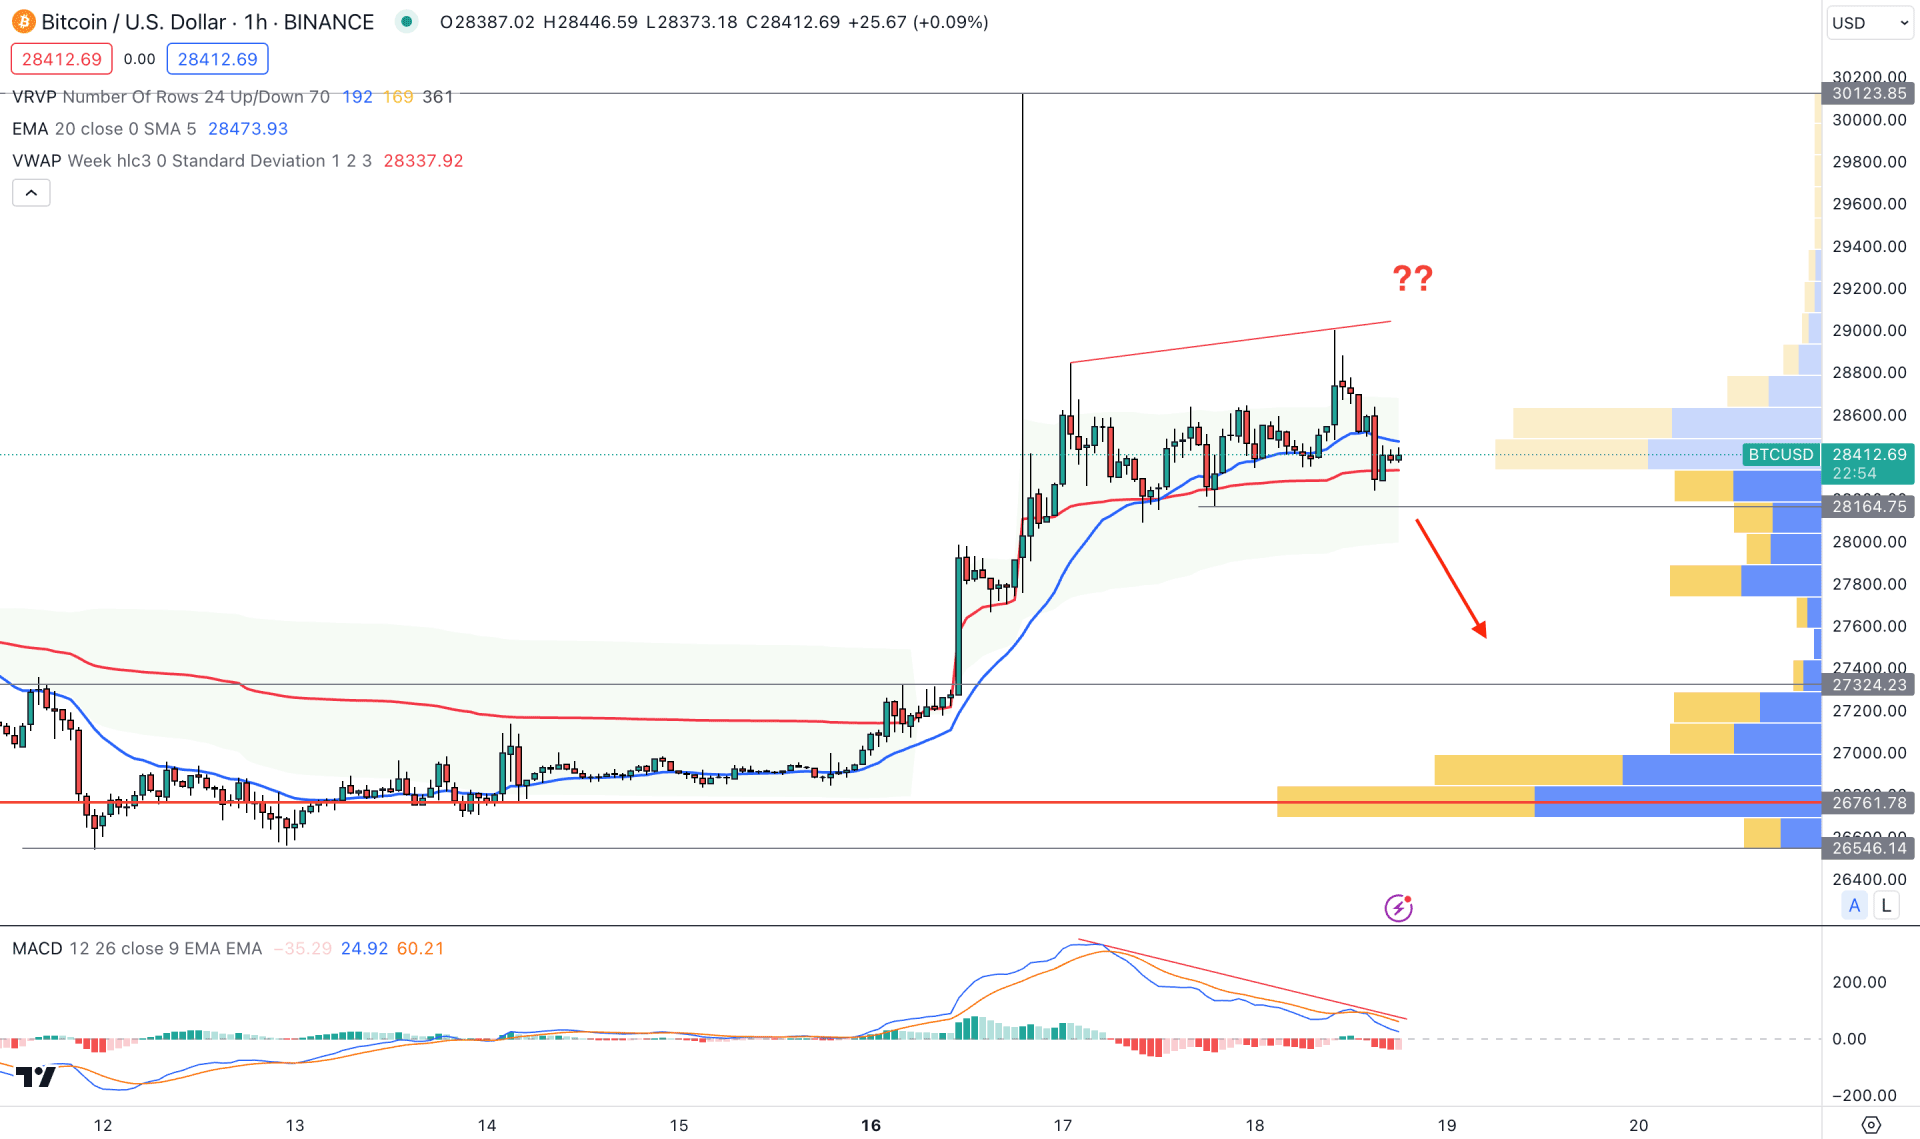
The overall market structure in the hourly chart is bullish, but the recent divergence with the MACD signal line indicates a sellers’ weakness. Moreover, the visible range high volume level is at 26,761.78 level, which is 5.50% below the current price.
The main chart shows downside pressure as the recent price moved below the dynamic 20 EMA and weekly VWAP with a bearish H1 close. In that case, a new low formation below the 28,100.00 level could be a short opportunity, lowering the price towards the 27,324.45 level.
Based on the overall market momentum, the BTC/USDT price could extend the upside pressure after forming a valid retest at the trend line support. On the other hand, the current intraday momentum shows a bullish spike, which could result in a bearish reversal after a new low formation below the 26,000.00 static level.