
Published: January 14th, 2026
Following the post-release of the US Consumer Price Index (CPI) statistics for December, Bitcoin (BTC) and other cryptocurrencies have experienced a slight increase.
Based on the Bureau of Labor Statistics (BLS), the US headline CPI increased 0.3% MoM and 2.7% YoY in December, but it remained steady from its November reading.
The basic CPI, which does not include food and energy prices, increased by 0.2% MoM, less than the 0.3% market forecast. Core inflation stayed constant at 2.6% annually, which was lower than the projected 2.7%.
After releasing a draft of the bill previously this week, the Senate Banking Committee will convene on Thursday to discuss the highly predicted Digital Asset Market Clarity Act. The law guarantees "everyday Americans have the resources, information, and safeguards they need to securely engage with digital asset markets," according to a statement released by the committee on Wednesday.
Digital assets have benefited from developments in the legislation governing the structure of the cryptocurrency market. Based on the latest data, at the beginning of the day, Bitcoin traded at 95,000.00, an increase of 3.6% over the previous day. The biggest cryptocurrency in the world is over 9% so far in 2026, but it is still around 25% off its October record high of more than $126,000.
Let's see the upcoming price action from the BTC/USDT market analysis:
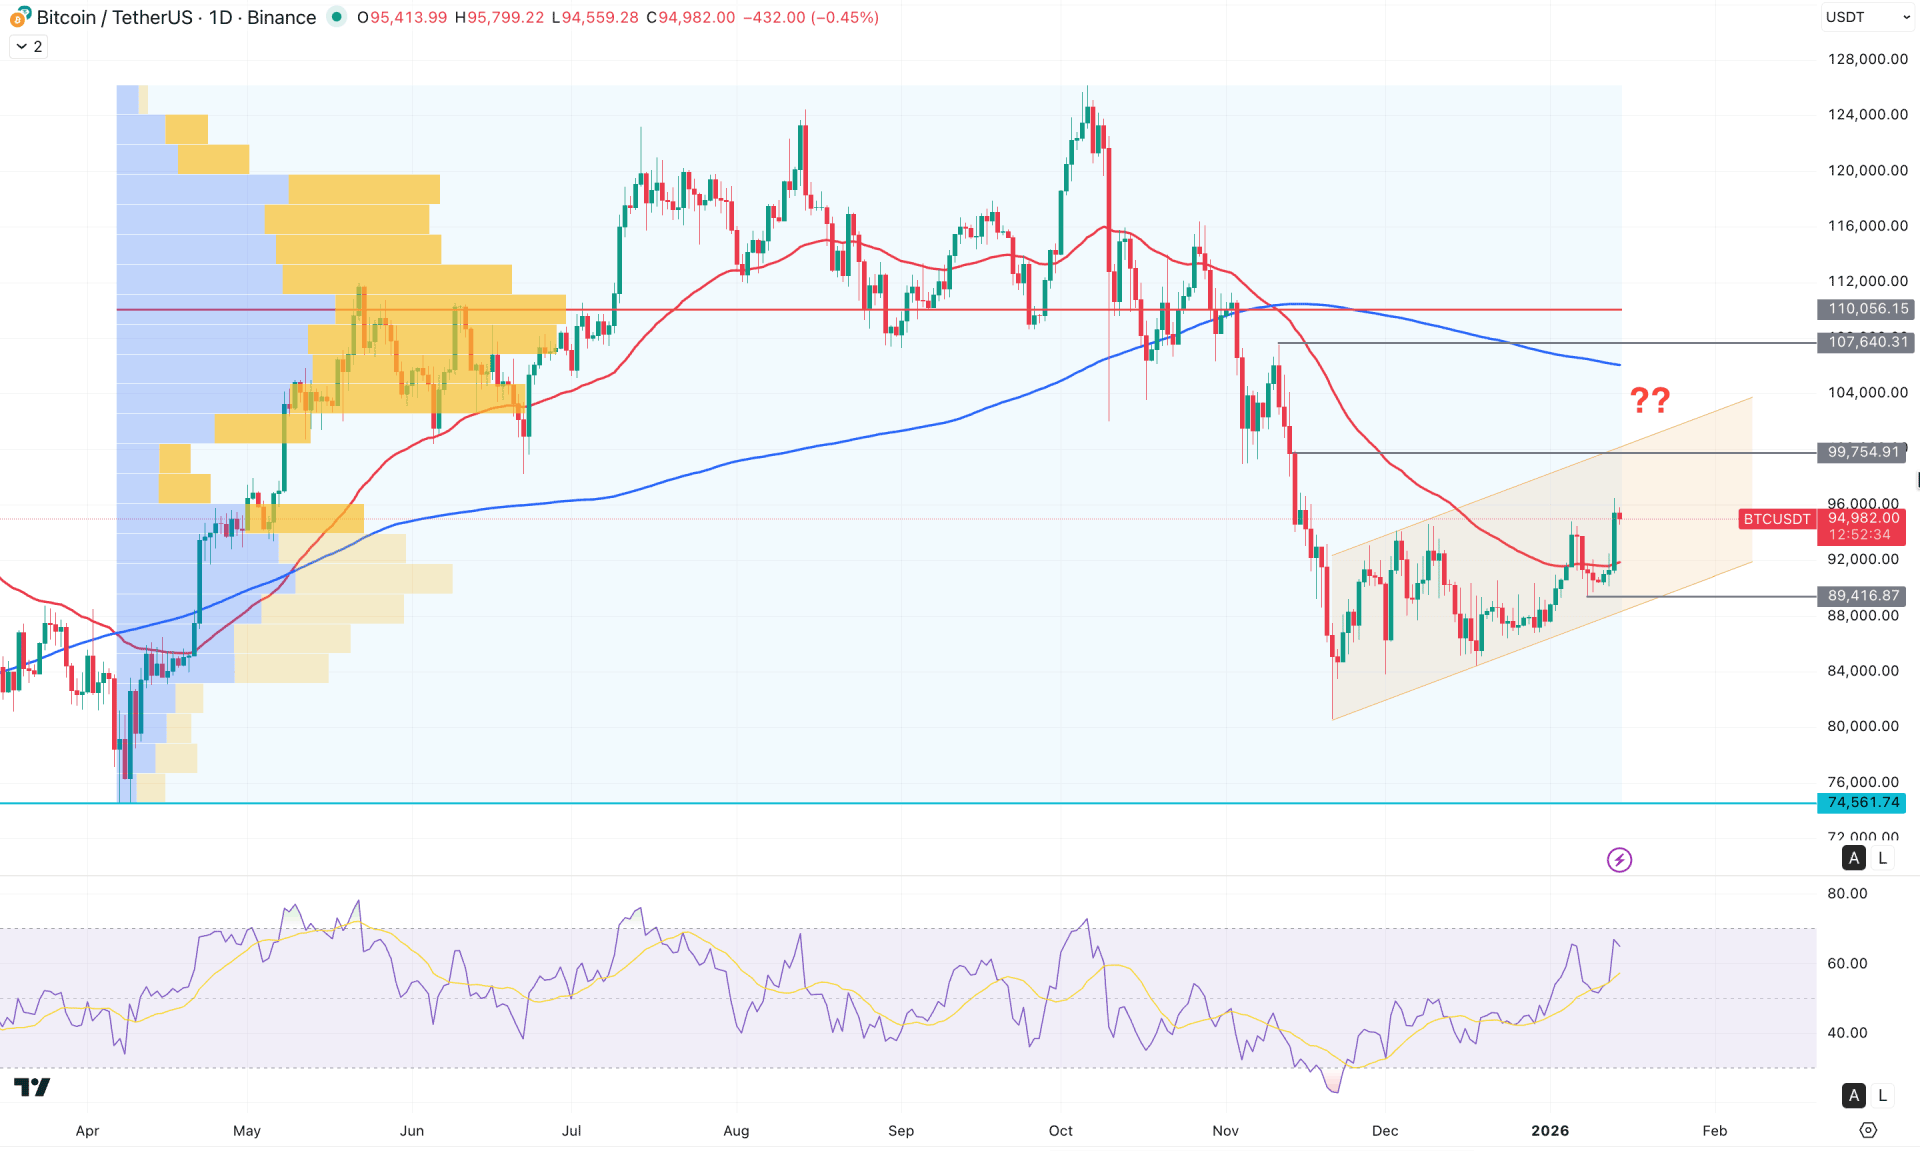
In the daily chart of BTC/USDT, the major market momentum is sideways as the current price is trading within an ascending channel. The most recent price has shown a strong bullish reaction from the channel support, creating a short-term bullish opportunity.
In the monthly timeframe, the current price is trading above the December 2025 high, creating a bullish present after two consecutive bearish months. A valid monthly close above the monthly flip zone could validate a bullish reversal from the current downside correction.
The weekly timeframe remains bearish, where the current price is trading sideways at the bottom, with no sign of a valid bullish rebound.
In the main price chart, the ongoing market momentum is bullish as the price trades below the 200-day Simple Moving Average line. However, a short-term bullish recovery is present as a U-shape recovery is visible above the dynamic 50-day EMA line.
In the indicator window, the Relative Strength Index (RSI) shows a stable position above the 50.00 neutral line, suggesting a stable buyers' present.
Based on the current market outlook, a short-term bullish opportunity is present, targeting the 99754.91 resistance level. However, a strong bullish reversal with a stable price above the 100,000.00 level could increase the possibility to move beyond the 120,000.00 level, following the major bullish rally.
On the other hand, the price is still trading sideways within an ascending channel. In that case, a failure to hold the buying pressure above the dynamic 50-day EMA could be a challenging factor. In that case, a bearish daily close below the 89,416.67 support level could validate the channel breakout, targeting the 80,000.00 psychological line.
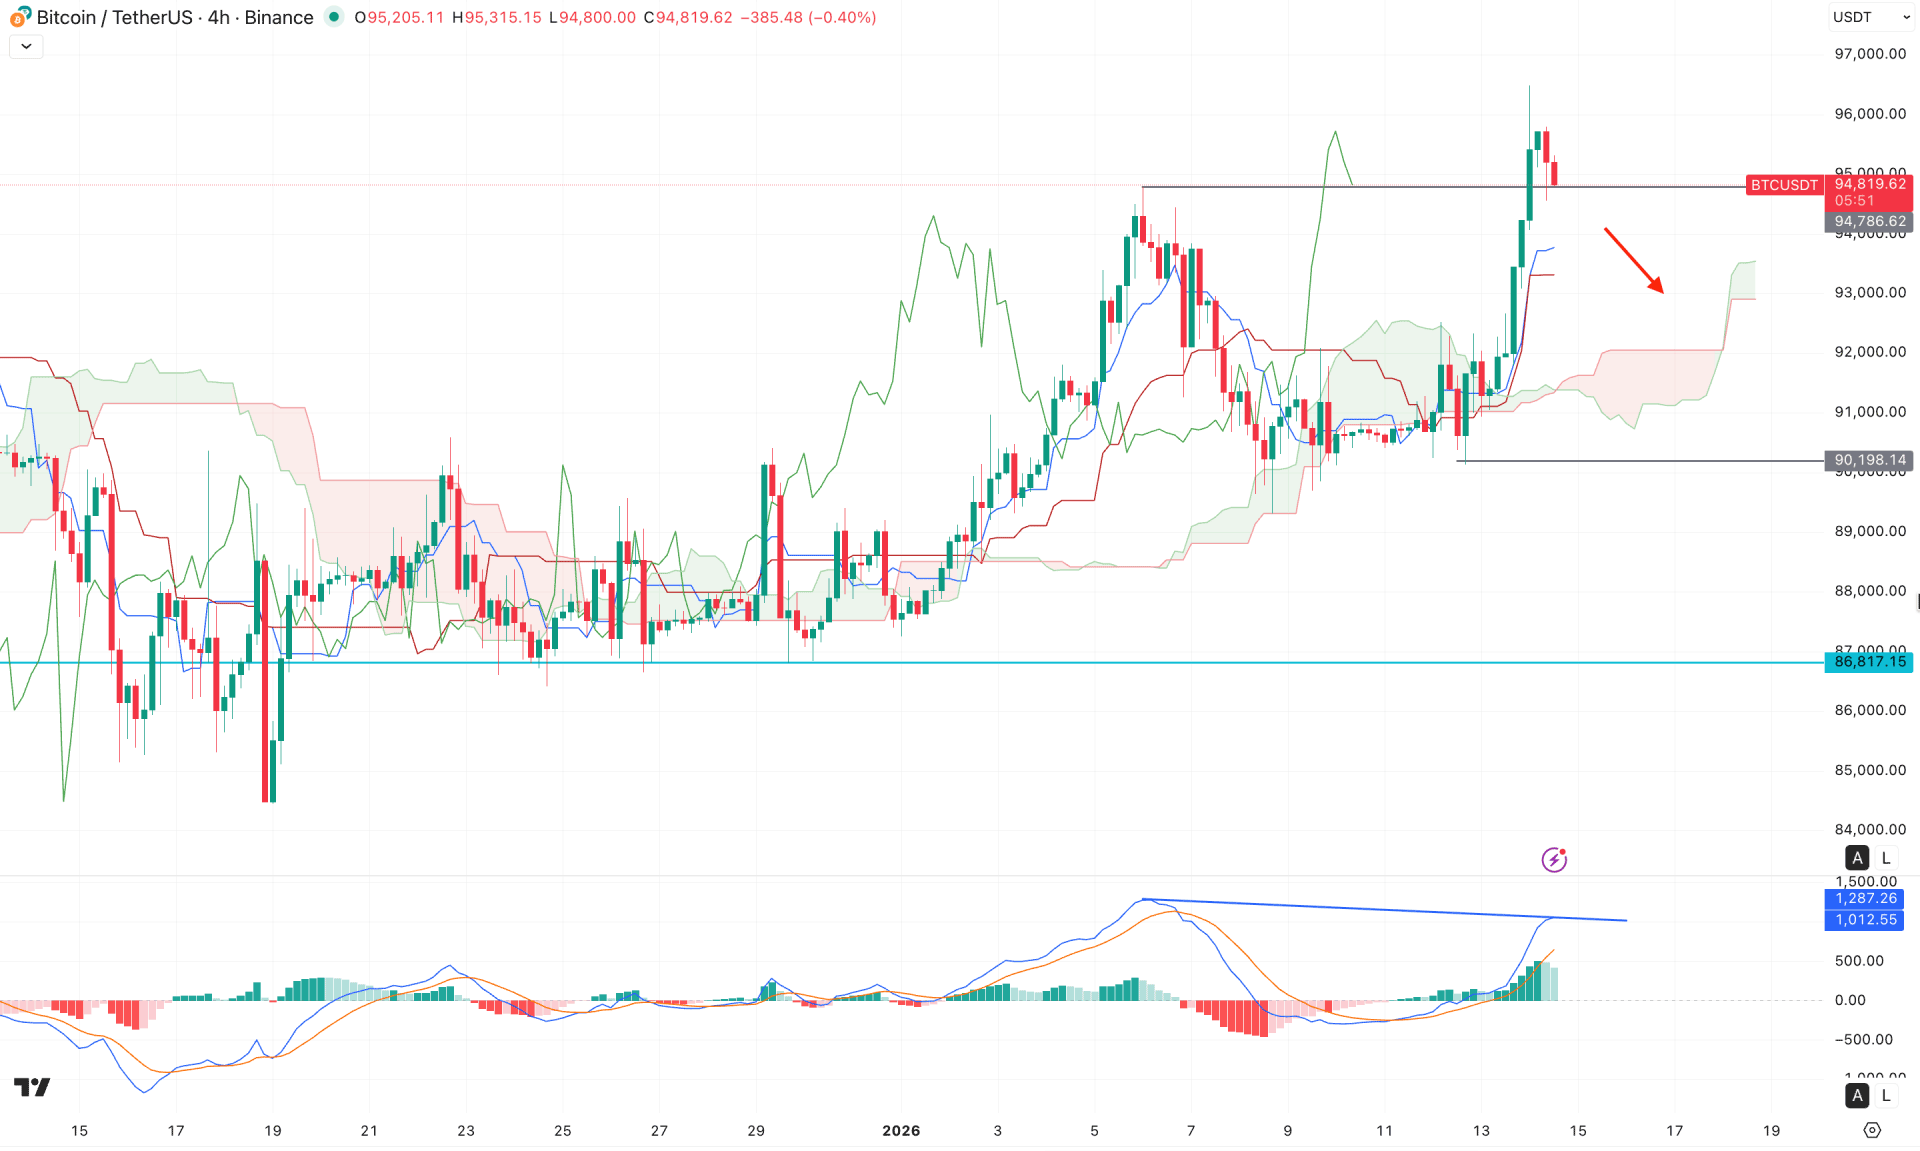
In the H4 timeframe, the current market momentum is bullish as the price keeps moving higher above the Ichimoku Cloud zone. Moreover, the Future Cloud has flipped the position, suggesting a potential bullish continuation.
In the secondary window, the MACD Signal line is hovering above the neutral line, suggesting buying pressure in the market. However, the Signal line has failed to follow the momentum, creating a divergence. The Histogram has failed to grow where the most recent line has squeezes to the neutral area.
Based on this outlook, the major market momentum is still bullish, and a valid bullish reversal from Kijun Sen could offer another long opportunity.
On the other hand, an extended bearish correction is possible towards the dynamic Ichimoku Cloud area. A break below the 91,000.00 level with a bearish H4 close could limit the bullish possibility at any time.
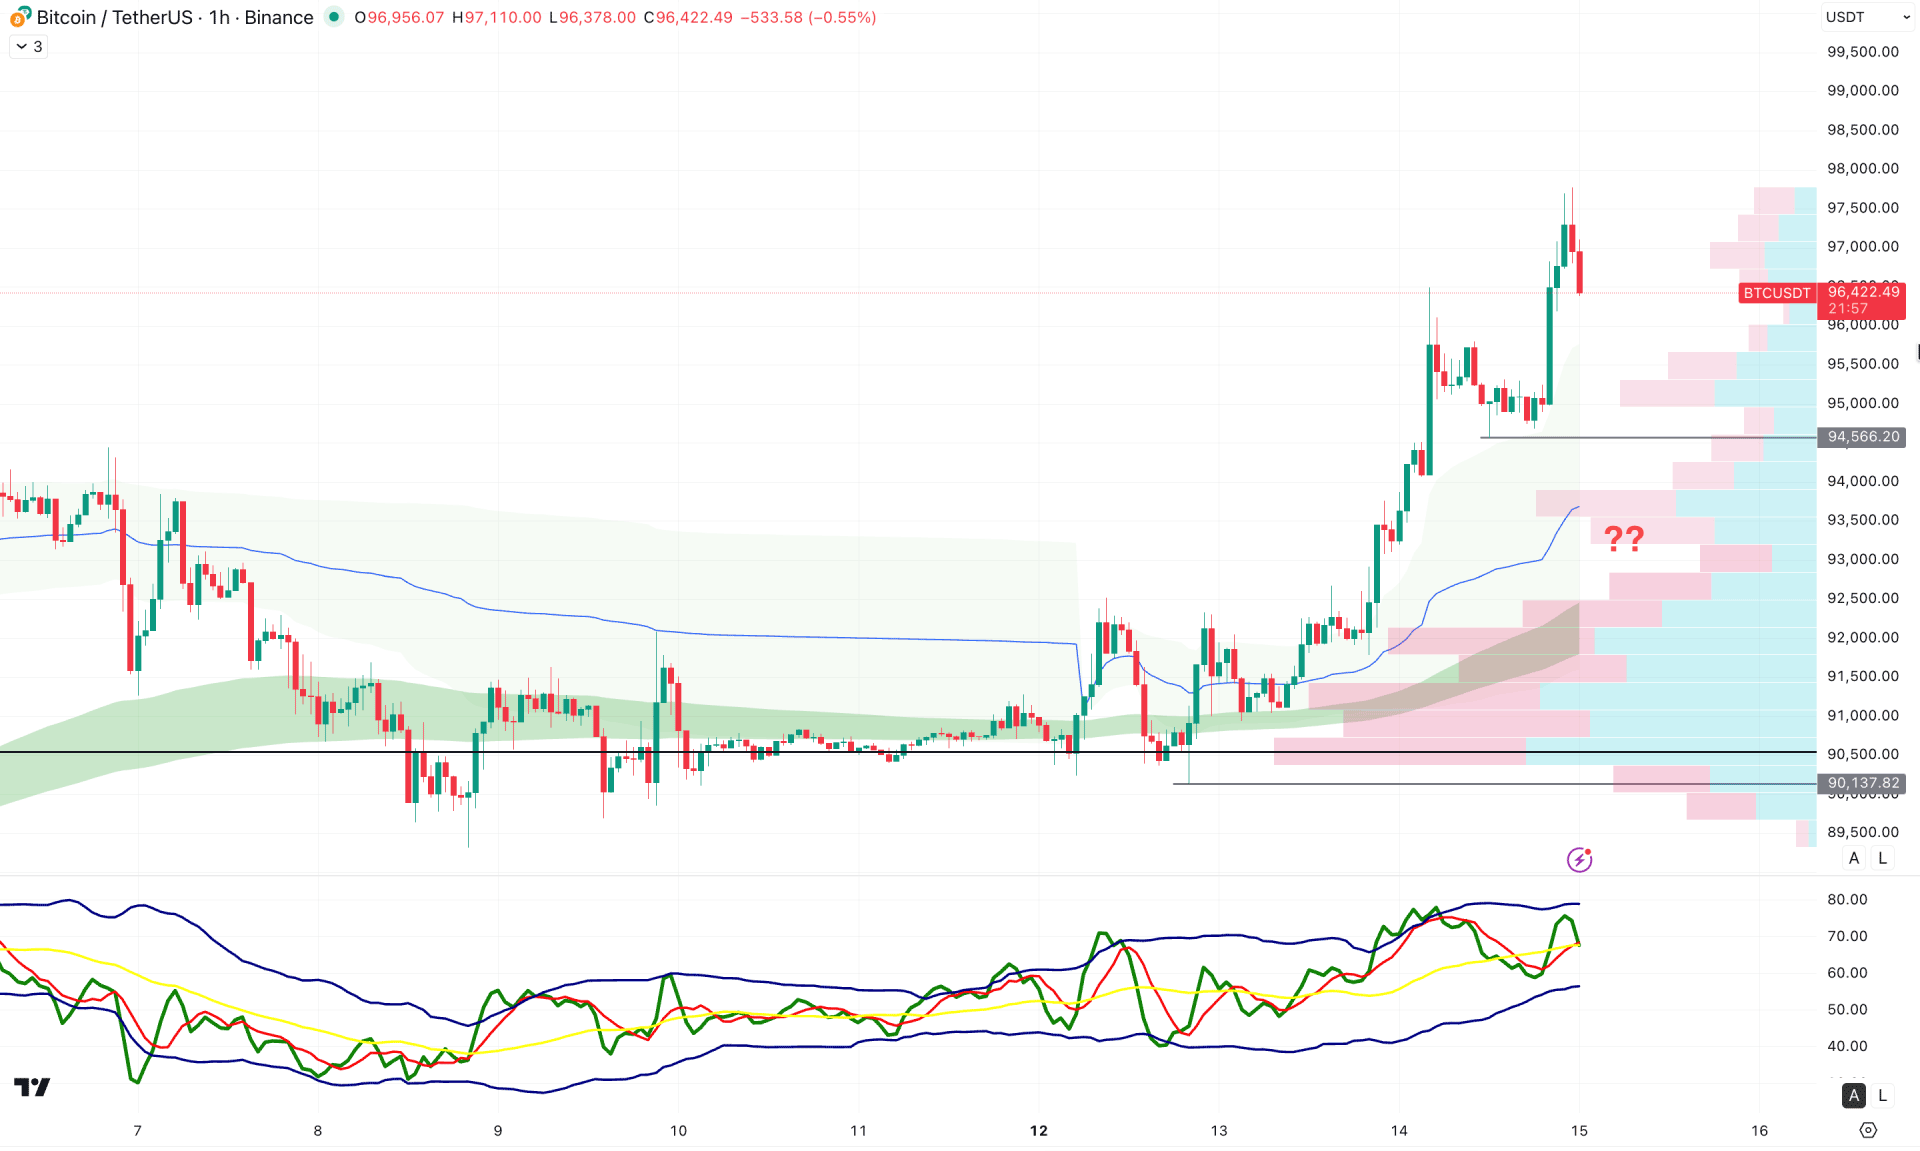
In the lower timeframe, the most recent price action shows a bullish reversal from the Exponential Moving Average wave, with multiple hourly candles holding above the weekly VWAP line. Moreover, the intraday high volume line is positioned below the entire price structure, suggesting an additional bullish factor.
In the indicator window, the Traders Dynamic Index (TDI) is approaching the upper band, indicating an overbought market condition.
Based on this outlook, the primary market momentum remains bullish, and any long signal from the VWAP line could present a reliable trading opportunity. However, the price is currently overextended and trading above the recent swing high, from where a corrective pullback remains possible.
Overall, investors should monitor how the price reacts after retesting the VWAP line. Any immediate selling pressure accompanied by strong bearish momentum could push the price lower toward the 87,722.81 level.
From a broader market structure perspective, BTC/USDT is trading within a short-term bullish phase, while the overall structure remains part of a broader corrective wave. As the price continues to rise from channel support, investors should closely observe price behavior near the channel resistance area, where a downside correction may occur. Although the dominant market bias remains bullish, ongoing geopolitical uncertainty could trigger sudden bearish pressure. In such a scenario, a confirmed breakout would be required before anticipating a long-term trend continuation.


