Published: October 16th, 2024
After a successful day for the cryptocurrency market as a whole, Bitcoin rose more than 8% this week. Analysts and investors feel optimistic about this price increase, expecting even greater profits in the coming months. As price movement improves, so does market sentiment, raising expectations for a long-term rally.
The belief that Bitcoin might keep rising is supported by significant evidence from the increased demand for the cryptocurrency. Rising demand and improved market sentiment create an atmosphere conducive to positive momentum.
Any hesitancy could result in more consolidation while maintaining the recent price spike, which could pave the way for Bitcoin to hit new highs. In either case, market players are anxiously anticipating the next significant move.
The price has increased by more than 12% in days, indicating that market sentiment has turned bullish again. As a result of this rising momentum, many people are hopeful that Bitcoin will continue to rise and that a big breakout is imminent.
According to on-chain data from CryptoQuant, Bitcoin's public interest on all exchanges has reached a new record-breaking high of $19.75 billion.
This increase in open interest, which indicates increased activity and more money at risk in the market, frequently comes before significant price movements. It indicates that traders are setting up for big price movements, which might further strengthen the current rise.
Bitcoin might be headed for new highs if this momentum holds, opening the door for a wider market rise. The course of Bitcoin will largely be determined over the days that follow as the market watches this pivotal moment.
Let's see the complete outlook for this coin from the BTC/USD technical analysis:

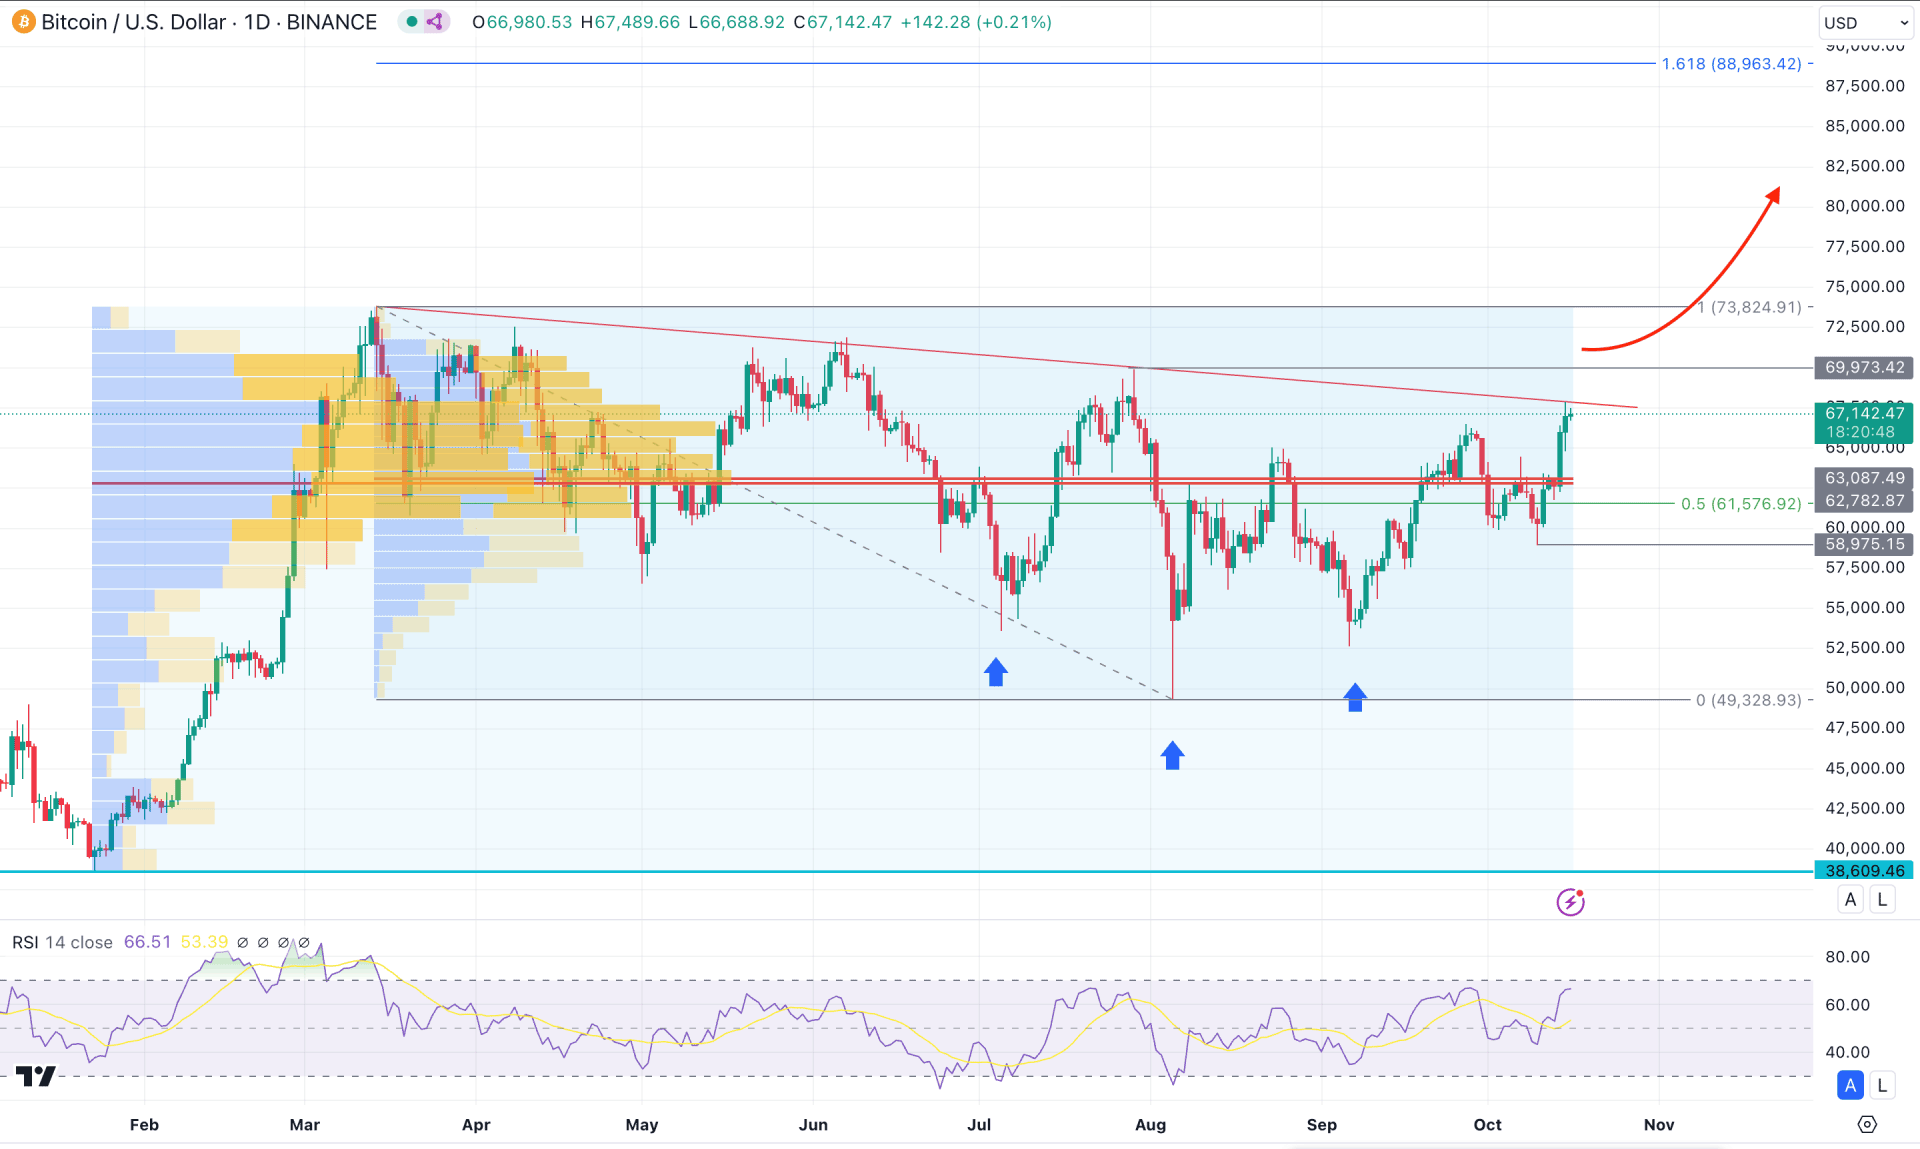
In the daily chart of BTC/USD, the ongoing buying pressure is clear, where the most recent price consolidates after an impressive bullish wave.
In the higher timeframe, a bullish fakey candlestick was formed in August 2024 with an inside bar on the next candle. As the current price is hovering above the 2 month high, we may consider the ongoing market trend as bullish.
The volume structure tells the same story. The high volume level since March 2024 and January 2024 was below the current price. The buying pressure is primarily valid in this pair as long as the current price hovers above the 62782.87 high volume line.
The main price chart shows an inverse Head and Shoulders pattern, where the neckline is at the 69973.42 level. Therefore, a bullish break above the recent resistance could open a decent long opportunity.
In the secondary window, the Relative Strength Index (RSI) remains steady after retesting the 50.00 neutral line. As the current reading is heading to the 70.00 overbought line, we may consider it as a strong bullish trend.
Based on the daily market outlook of BTC/USD, the current consolidation after the bullish wave suggests that investors are holding their positions. In that case, a valid trendline resistance breakout could be the primary signal of the upcoming bullish wave.
However, a stable market above the 69973.42 resistance line could open a conservative long opportunity, aiming for the 88963.42 Fibonacci Extension level.
On the other hand, there is sufficient trendline liquidity above the immediate swing high, which needs to be filled before showing any bearish pressure.
In that case, a valid bearish reversal from the 69973.42 to the 73824.94 zone with a daily candle below the 66000.00 psychological line could extend the consolidation by revisiting below the 60000.00 level.

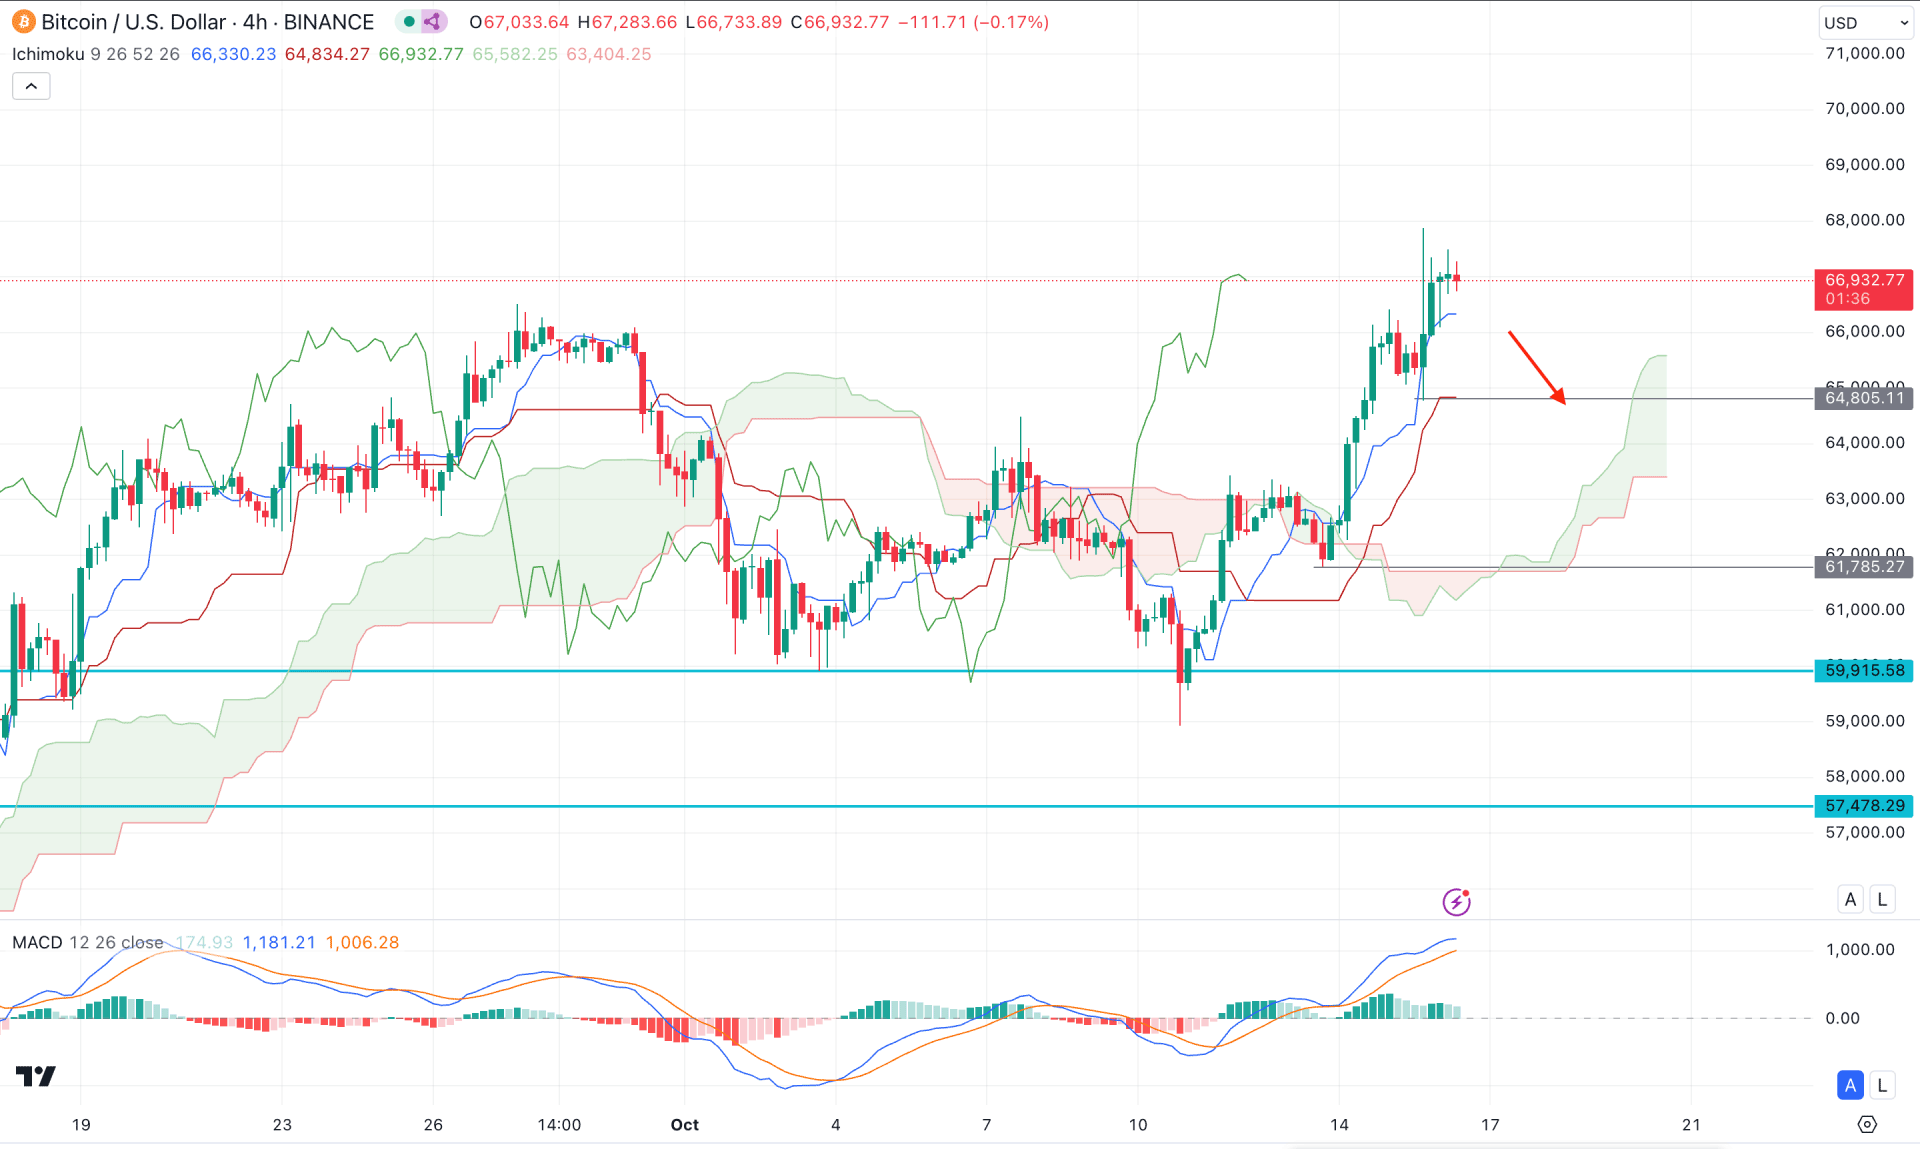
In the H4 timeframe, the ongoing buying pressure is visible, which is initiated from the sell-side liquidity sweep from the 59915.59 level with a bullish V-shape recovery. As the current price hovers above the 27 September high, we may expect the upward pressure to extend in the coming days.
In the secondary indicator window, the MACD Signal line is overextended and reached the highest level in a month. However, the signal line reached the neutral point, suggesting a primary signal of an upcoming bearish correction.
Based on the current H4 outlook, BTC/USD might find support from the dynamic Kijun Sen level. However, breaking below the 64805.11 level might initiate a downside correction towards the 61785.27 level.
However, as the ongoing buying pressure is valid above the Cloud area, any bullish rebound from 64000.00 to 61000.00 could be a bullish continuation signal, aiming for the 70000.00 level.

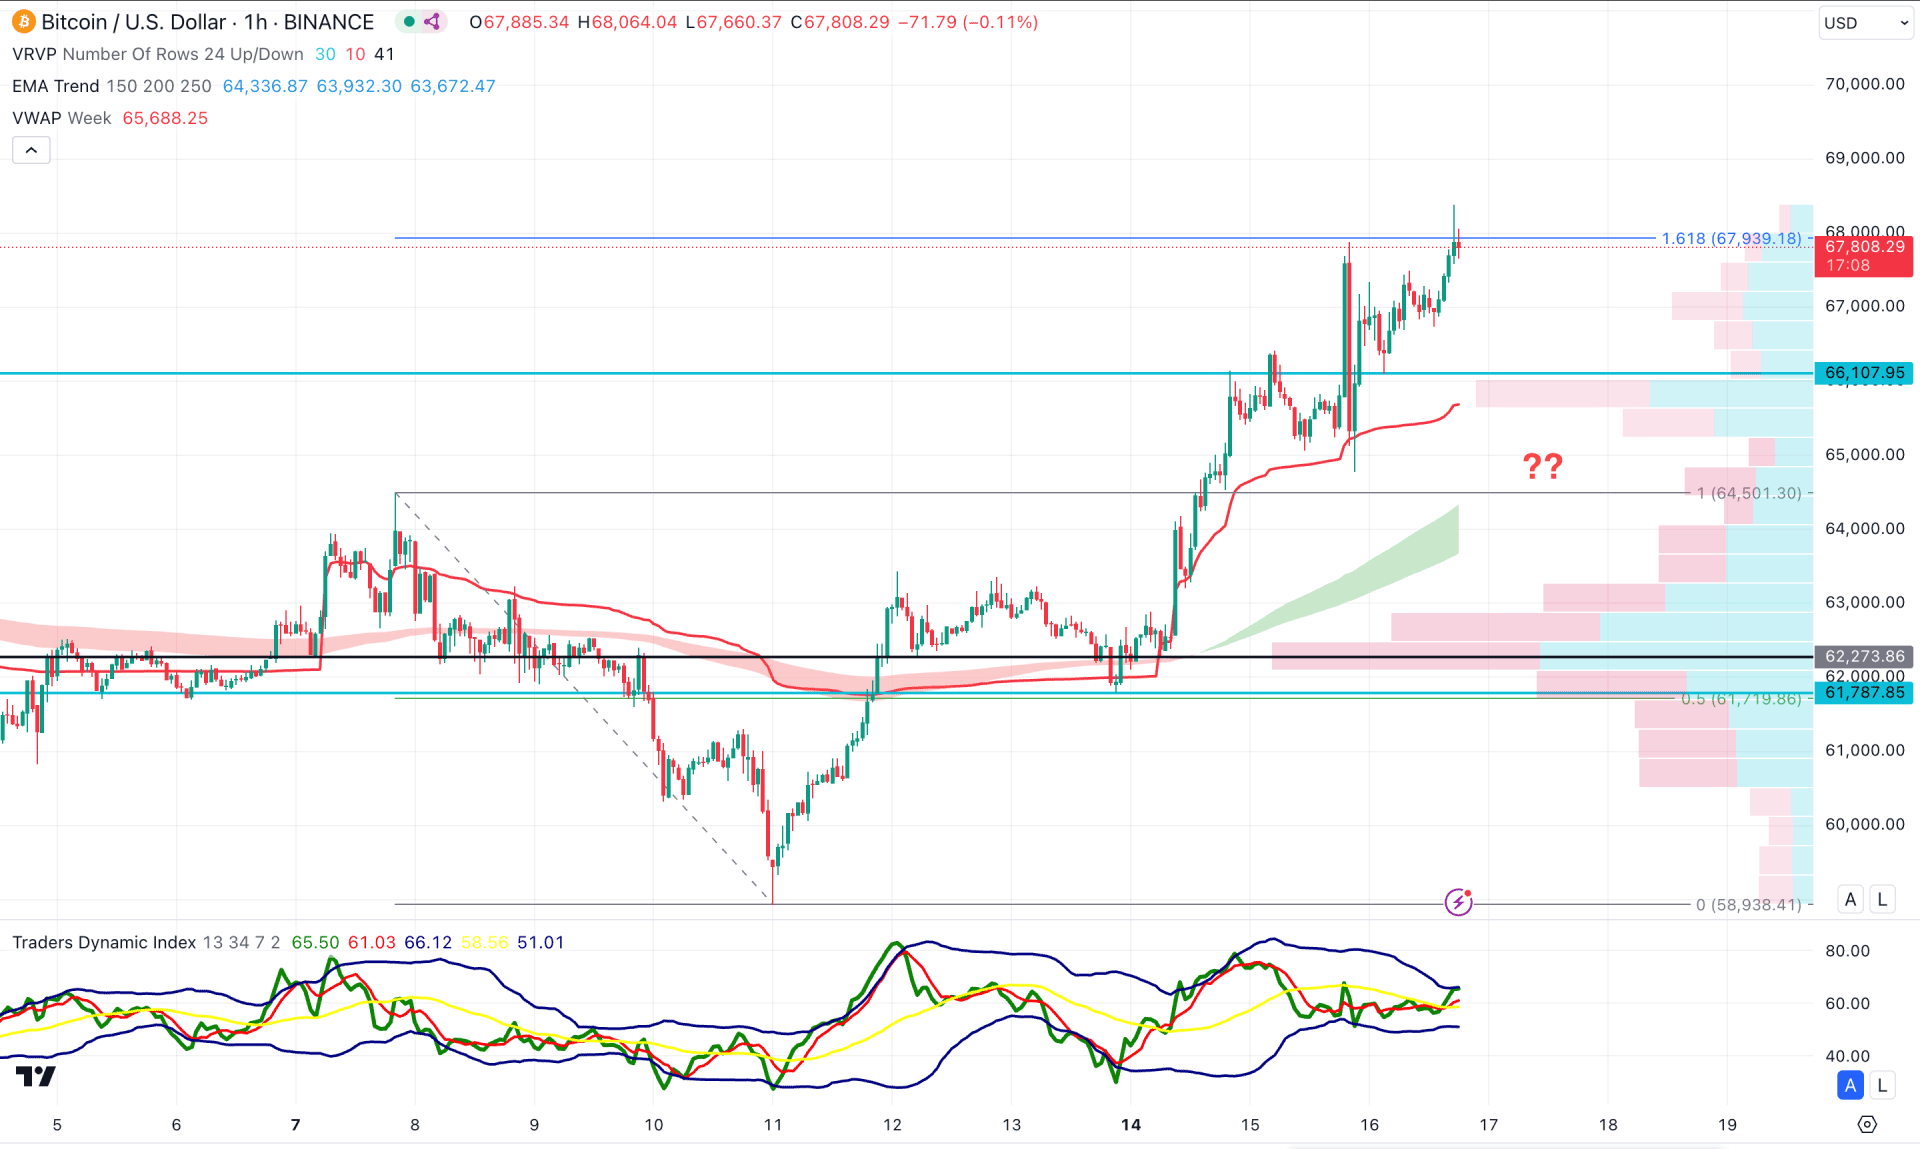
In the hourly time frame, the BTC/USD price has extended and reached the 161.8% Fibonacci Extension level from the existing swing. It is a sign that the price reached the top and a sufficient downside correction might happen.
The visible range high volume line is below the current price, while the MA wave is supportive to bulls. In that case, the buying pressure is likely to extend once the intraday correction is over.
In this context, the major bullish trend is valid as long as the high volume level is untouched. However, a selling pressure below the 66107.85 could signal a profit taking before forming another bull run.
Based on the current market structure, the bullish momentum is solid for the BTC/USD price as the recent price has held momentum for months. Primarily, a valid trend line breakout in the daily chart could validate the long opportunity but an early signal might come from the lower timeframe.