

Published: July 29th, 2026
Bitcoin (BTC) is plunging near 63k, a 10-day low, as investors carefully anticipate the FOMC rate decision and a sell-off in AI-linked equities, affecting the crypto risk sentiment.
As investors rethink their expectations for Federal Reserve policies, Bitcoin is declining. The likelihood of a Fed rate increase this week, or at the very least a hawkish policy statement, has increased due to strong labour market data, robust corporate activity, and high oil prices.
Markets are currently pricing in a 38% chance of a 25-basis-point rate increase at the upcoming meeting, up from 12% ten days ago, according to the CME FedWatch Tool. The likelihood of a rate increase in September has also increased to over 80%.
Bitcoin is being affected by changes in Fed expectations. Tighter liquidity is usually associated with higher interest rates, which is detrimental to riskier investments.
Institutional interest in Bitcoin is still low, though. Spot ETF inflows have been insufficient to raise prices, and open exposure to CME Bitcoin options and futures has dropped to multi-year lows.
Let's see the current price projection from the BTC/USDT technical analysis:
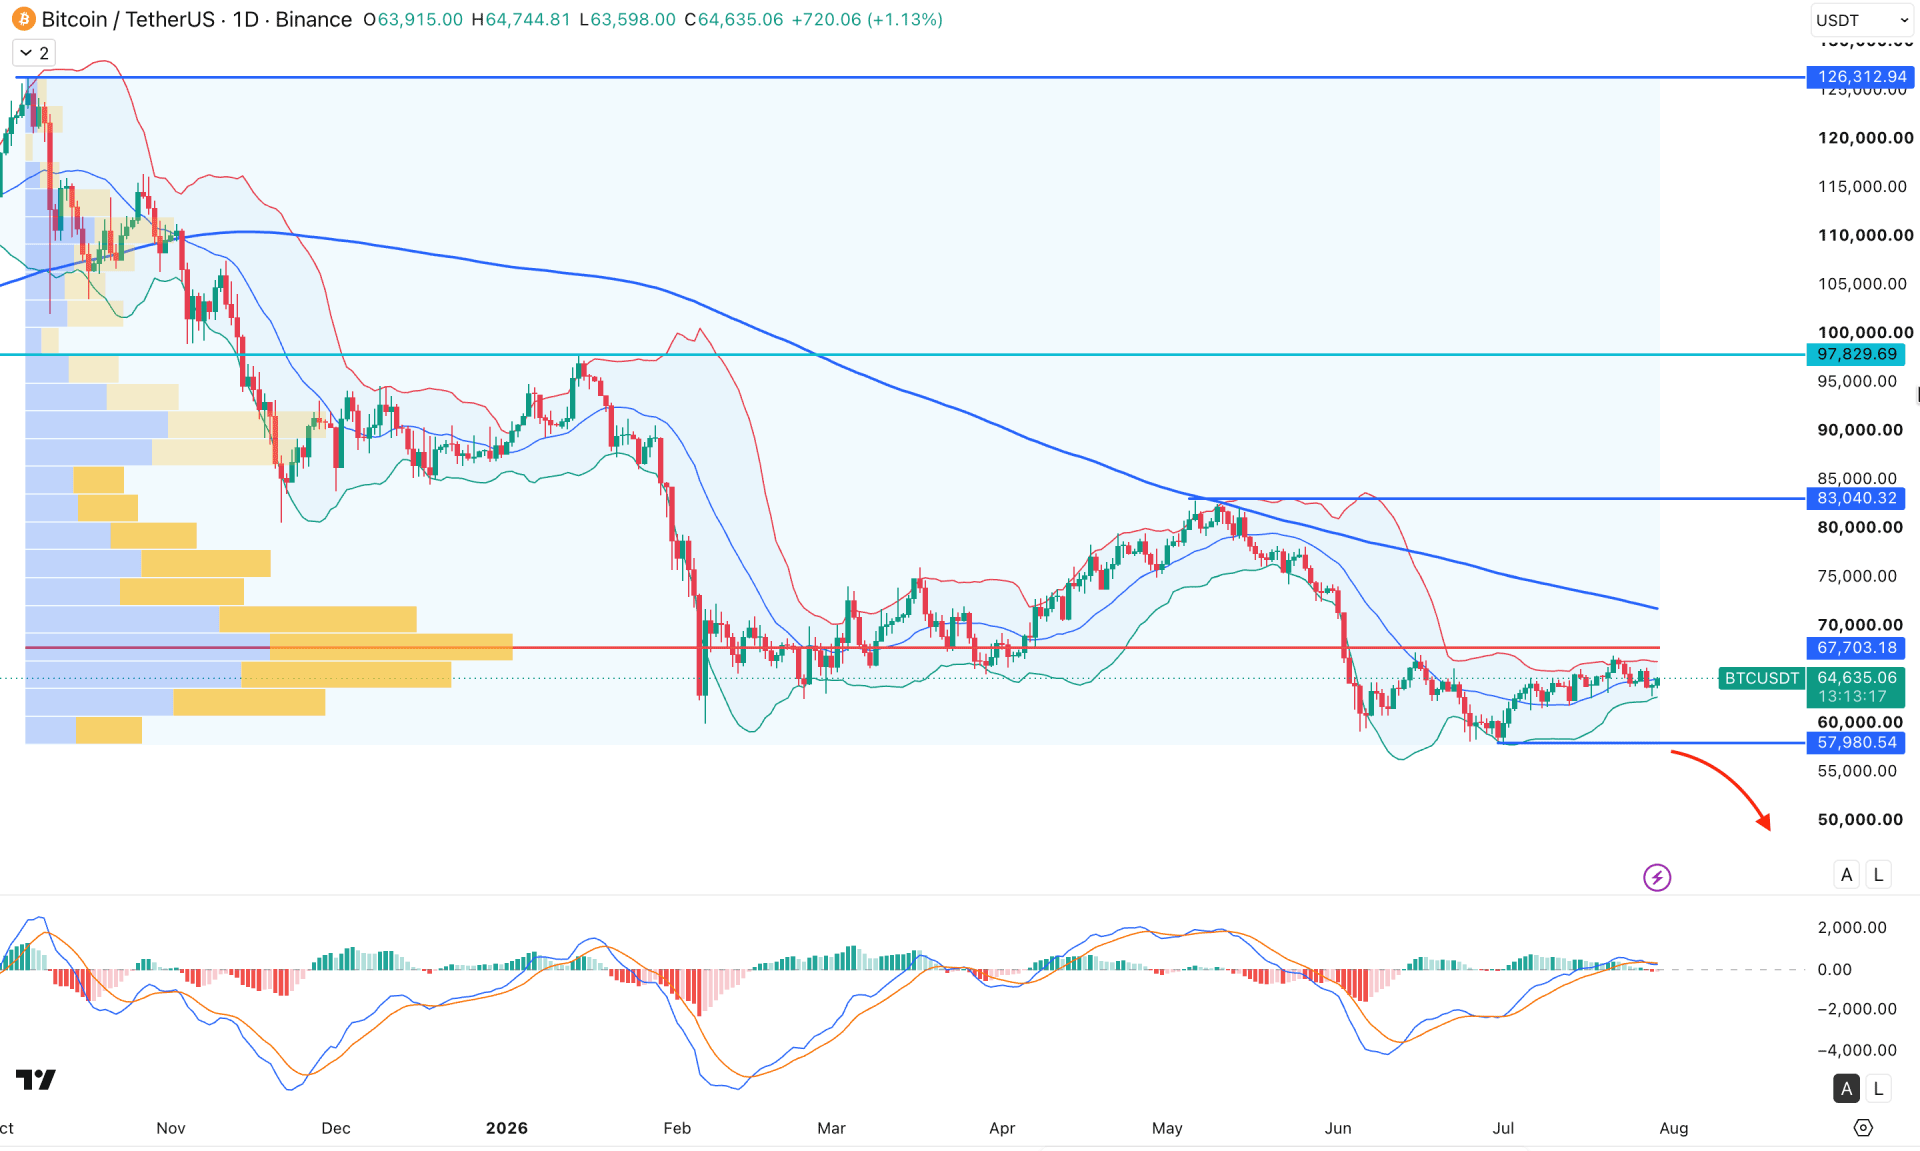
In the daily chart of BTC/USDT, ongoing bearish pressure is clear as the price keeps moving lower after testing the 126K all-time high. The price has moved below the crucial 200-day SMA and has held this momentum for a considerable time, which signals a possible downside continuation.
Looking at the higher timeframe, we can see a bearish trend, and the ongoing monthly candle is sideways within an impulsive bearish wave. A new break of structure is visible, with a valid bearish close below the February 2026 low, which signals a crucial bearish opportunity. Moreover, the weekly timeframe shows strong corrective momentum after creating a new swing low, which indicates that bears are still holding control without any significant bullish attempt.
The volume structure shows a similar outlook, where the most active level since September 2025 is at 67,703.18, which is just above the current price. In 2026, the price attempted to move higher from the high-volume level but reversed lower immediately while maintaining bearish pressure as a corrective move. This indicates that sellers are still dominating the market and may lead to a bearish break at any time.
In the main price chart, the upper and lower Bollinger Bands are coming closer together, signaling a possible squeeze. Moreover, a sideways market is visible with multiple violations at the middle Bollinger Band. The overall structure is bearish, as the 200 SMA is above the current price and is acting as a major barrier just below a key resistance level.
In the indicator window, the MACD histogram has maintained sideways momentum for a considerable time, as no significant highs or lows have formed over the past week. The signal line shows a similar outlook, with a flat EMA line just above the neutral level.
Based on the overall market structure, the ideal trading approach is to look for bearish opportunities as long as the price remains below the 67,703.18 resistance level.
In that case, a valid break below the middle Bollinger Band could increase the possibility of testing the 57,980.54 swing low. A further break below this level may initiate an extended bearish correction toward the 52,735.68 support area.
On the other hand, a considerable bullish correction is still possible, as the most recent corrective move remains within a discounted zone that started from the May 2026 high. The 50% Fibonacci retracement level of the current swing is marked at 70,748.54, which could act as major resistance. A bullish rebound from this level, followed by a bearish rejection after testing the 200 SMA, could provide another short opportunity targeting the 57,980.54 area.
However, a recovery above the 200-day SMA with confirmation could increase the possibility of testing the 83,040.32 resistance level before moving toward the 97,829.69 area.
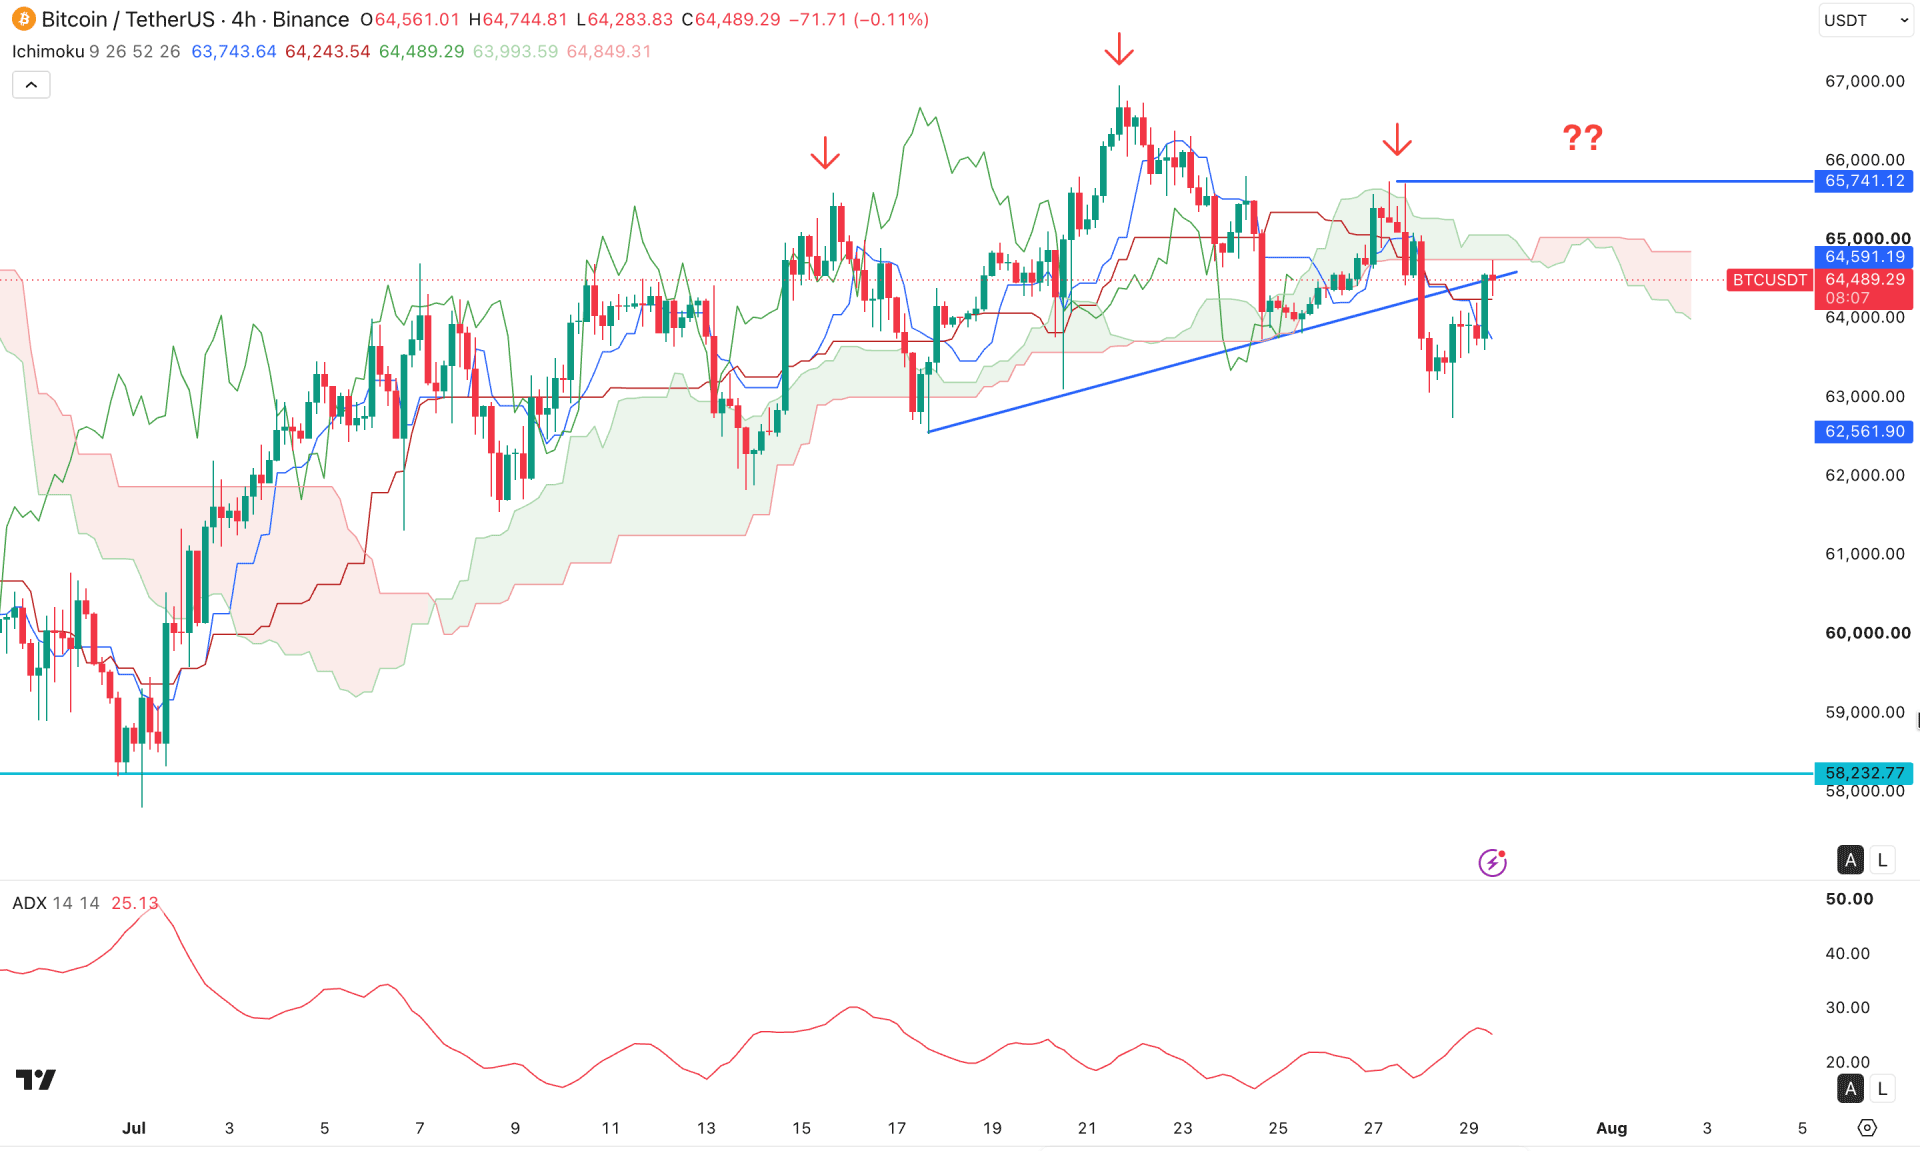
In the four-hour timeframe, BTC/USDT is trading within a corrective bullish momentum; however, the most recent price failed to create a new swing high and formed a potential Head and Shoulders pattern. As the price is currently trading below the neckline, the primary expectation is to look for short opportunities. Moreover, a valid bearish break is visible below the Ichimoku Cloud after a decent bullish recovery, which signals a possible continuation.
In the secondary indicator window, the Average Directional Index has become flat after moving above the 20.00 level, which signals the early stage of trend development.
The future cloud remains supportive of bearish continuation, while the recent bullish recovery around the dynamic zone indicates mixed market sentiment.
Primarily, a bearish continuation is expected as long as the price holds below the 65,741.12 swing high. A four-hour close below the Kijun-sen level could increase downside potential, targeting the 60,000.00 key support area.
On the other hand, the current price is holding sell-side liquidity from the head and shoulders breakout. The higher price region around the neckline should be monitored carefully. An immediate bullish break above the 65,741.12 swing high would invalidate the pattern and increase the possibility of a move toward the 70,000.00 level.
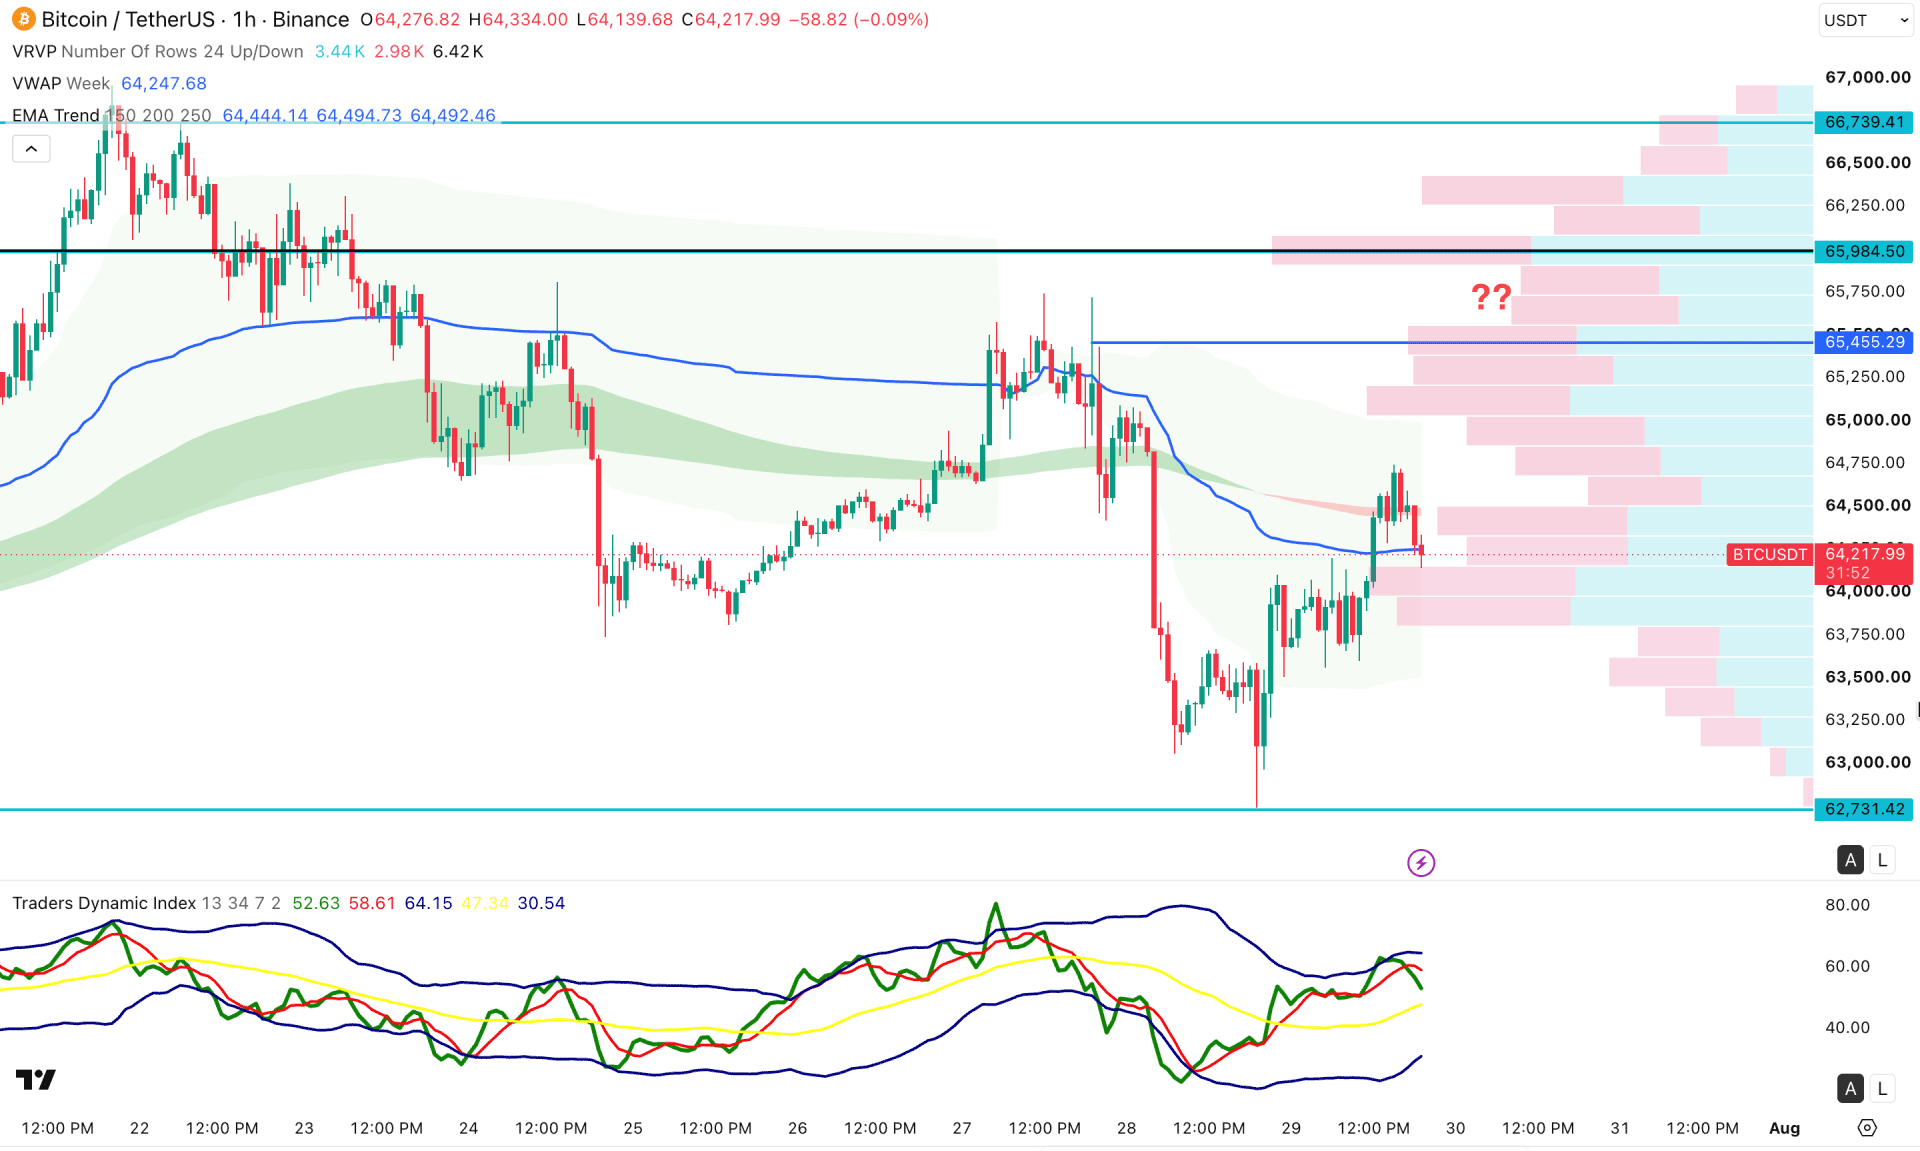
In the hourly timeframe, BTC/USDT is trading within a very strong trend, and the most recent price action shows a minor bullish correction with a recovery above the weekly VWAP. However, the exponential moving average is close to the current price and is acting as a crucial resistance.
On the other hand, the broader outlook shows bearish pressure from the internal high-volume line, which is above the 65,000.00 area.
In the indicator window, the Average Directional Index is rebounding after reaching a peak, which signals a downward continuation possibility.
Based on this outlook, a bearish opportunity remains valid as long as the price stays below the 65,455.29 resistance level. A break below the weekly VWAP level could increase the short opportunity, targeting the 62,731.42 level. However, an immediate rebound above the 65,984.50 area could invalidate the structure in the short term.
Based on the overall market structure, BTC/USDT is trading within a long-term strong trend, where further bearish continuation is possible. However, the price is also reaching a consolidation zone near the 2024 high, so a range-bound market is possible. A bullish rebound with bottom formation may take more time and would need a solid recovery with multiple higher-high formations on the daily timeframe.


