

Published: November 10th, 2026
Bitcoin investors who entered the market during its recent recovery are facing mounting pressure as prices continue to decline. The short-term holders (STHs) are nearing their break-even point, according to Glassnode’s Monday Market Pulse report. Also, the data indicates that the share of Bitcoin’s circulating supply currently in profit fell by 3.8 percentage points over the past week.
The Net Unrealised Profit/Loss (NUPL) metric also dropped significantly, declining from 3.4% to 1.1%. This reflects the shrinking unrealised gains among Bitcoin investors amid the recent price downturn. At the same time, the realised profit-to-loss ratio declined from -0.21 to -0.63, signaling that investors were recording considerably more losses than profits.
Bitcoin futures open interest fell 1.1% over the past seven days, dropping from $37.4 billion to $37 billion. Glassnode linked the decline to position closures during Thursday’s market downturn, followed by another wave of long liquidations.
However, open interest remains close to the upper end of its historical range. It signals that substantial leverage is still present in the market. Funding payments from long positions also remained above their historical upper range. Nevertheless, the figure declined by 7.1%, falling from $3.1 million to $2.9 million.
Let's see the current price projection from the BTC/USDT technical analysis:
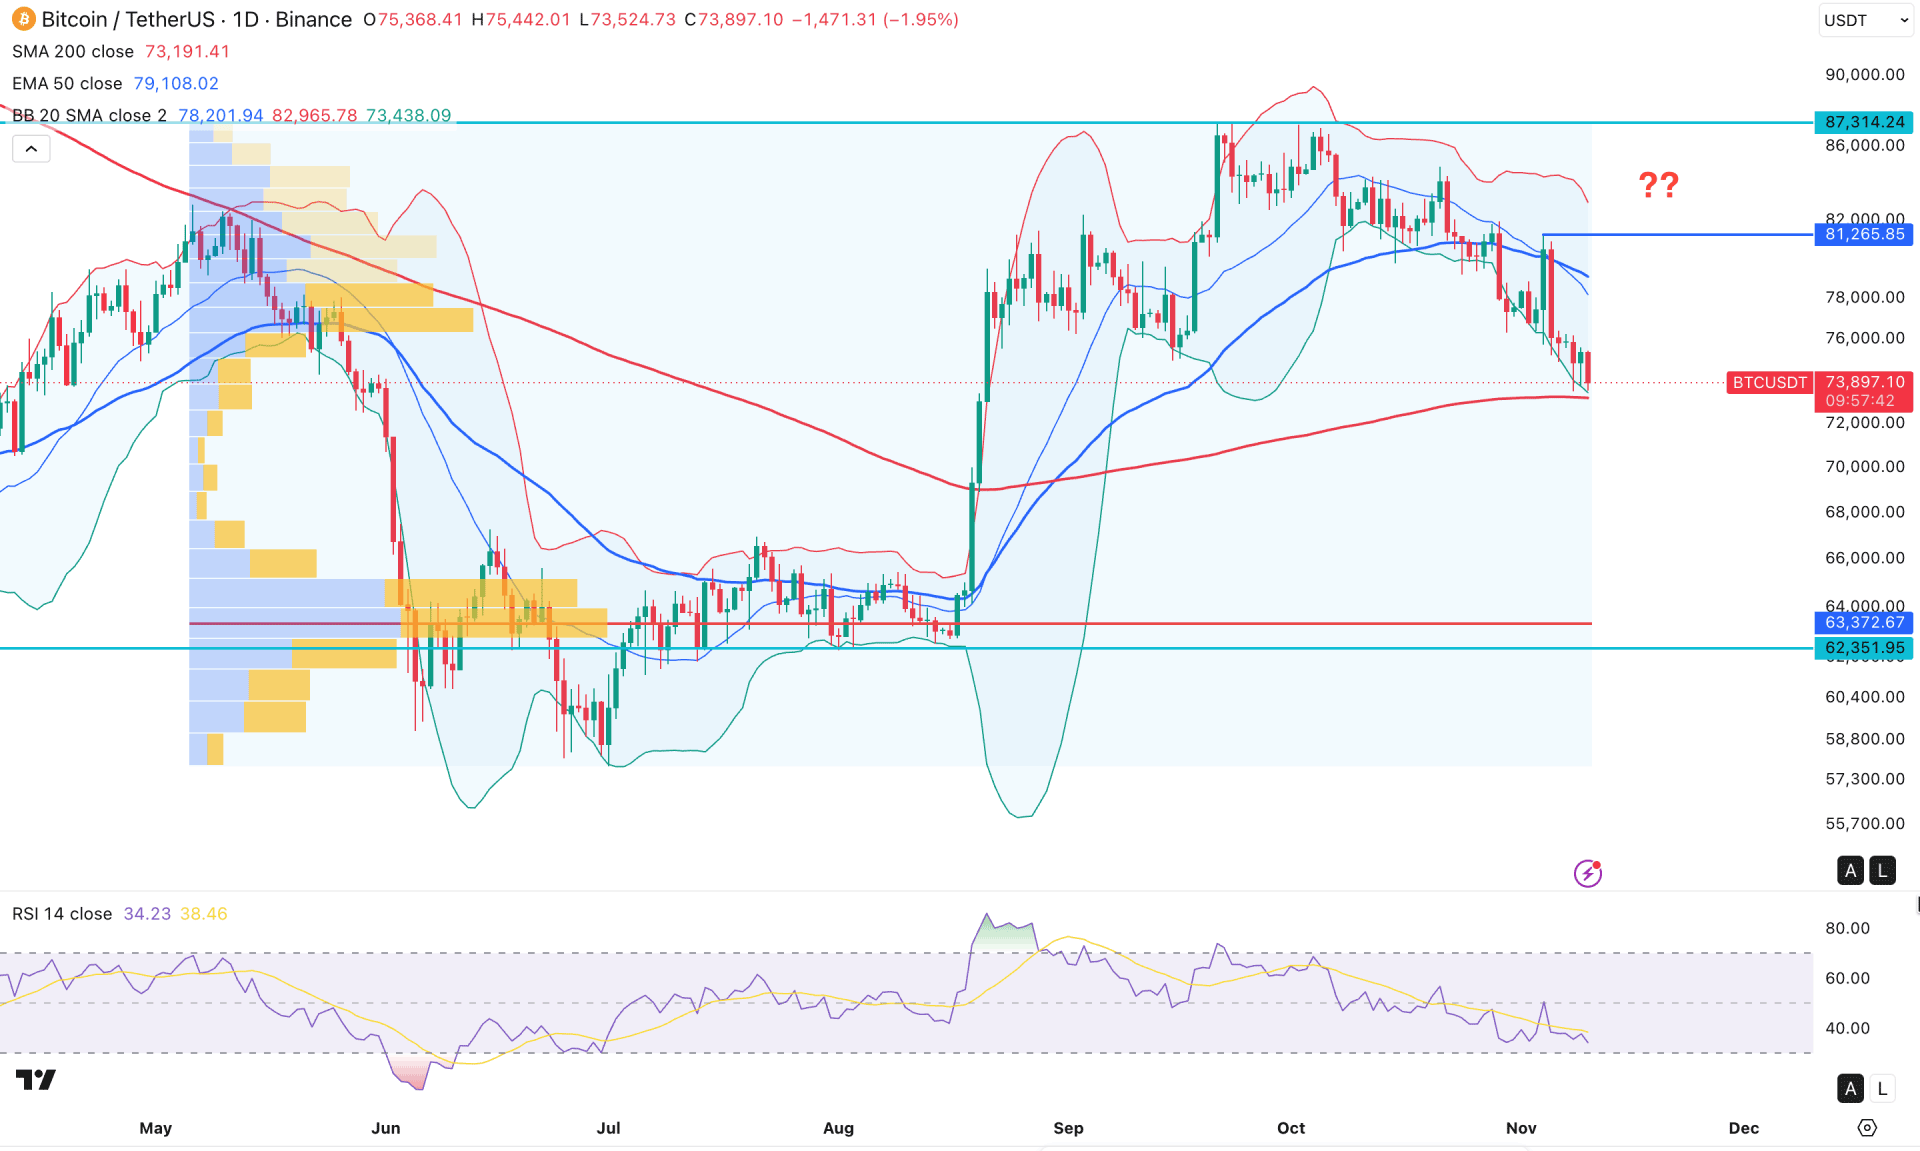
On the BTC/USDT daily chart, overall market momentum is corrective after failing to hold buying pressure above the May 2026 high. Currently, price is aiming lower by creating multiple lower lows, suggesting a possible downside correction.
Looking at the higher timeframe, the monthly candle suggests a valid rebound with a bearish reversal candle in October 2026. Price continues to move lower, as shown on the weekly timeframe. Six consecutive bearish weeks are visible at the bullish peak area, which signals a sufficient buy-side liquidity sweep.
In terms of volume, buyers are still dominating price, as the largest activity level seen since May 2026 is at 63,372.67, well below the current price. Although several high-volume levels were found at the bullish peak area, the gap between the current price and the existing high-volume level signals more downside possibility.
In the main price chart, downside recovery has been found below the 50-day EMA, signaling a medium-term bearish structure. Moreover, the 200-day SMA is acting as immediate support, and price has stalled at this level for three consecutive trading days.
In the secondary trading indicator, Bollinger Bands show corrective bearish momentum, with price testing the mid-Bollinger support for 10 consecutive trading days. Still, there is no sign of a bullish recovery, as the mid-Bollinger line maintains a bearish structure at resistance.
In the Relative Strength Index, the line is currently fluctuating between the 30 and 50 levels, signaling corrective downside pressure. As the relative strength line encounters resistance near the 50.00 midline, it is likely to aim lower toward the 30.00 oversold area.
Based on the overall market structure, BTC/USDT is trading in a bearish structure, with the current price testing the crucial 200 SMA support. In this structure, sufficient bullish pressure with a reversal above the 81,265.85 level could validate a long opportunity targeting 87,314.24. Moreover, a move above this line could open the door to breaking the 100,000.00 psychological barrier.
On the bearish side, the 50 EMA is key resistance to watch, and price is likely to aim lower as long as it stays below this dynamic line. Below the 200 SMA, an imbalance is visible, where crucial support is marked at the 63,372.67 level.
Alternatively, the price might find sufficient liquidity below the 200 SMA; in that case, a bullish rebound after breaking below the 200 SMA could be another trading condition. In that scenario, recovery above the 50-day EMA could offer an alternative long opportunity at any time.
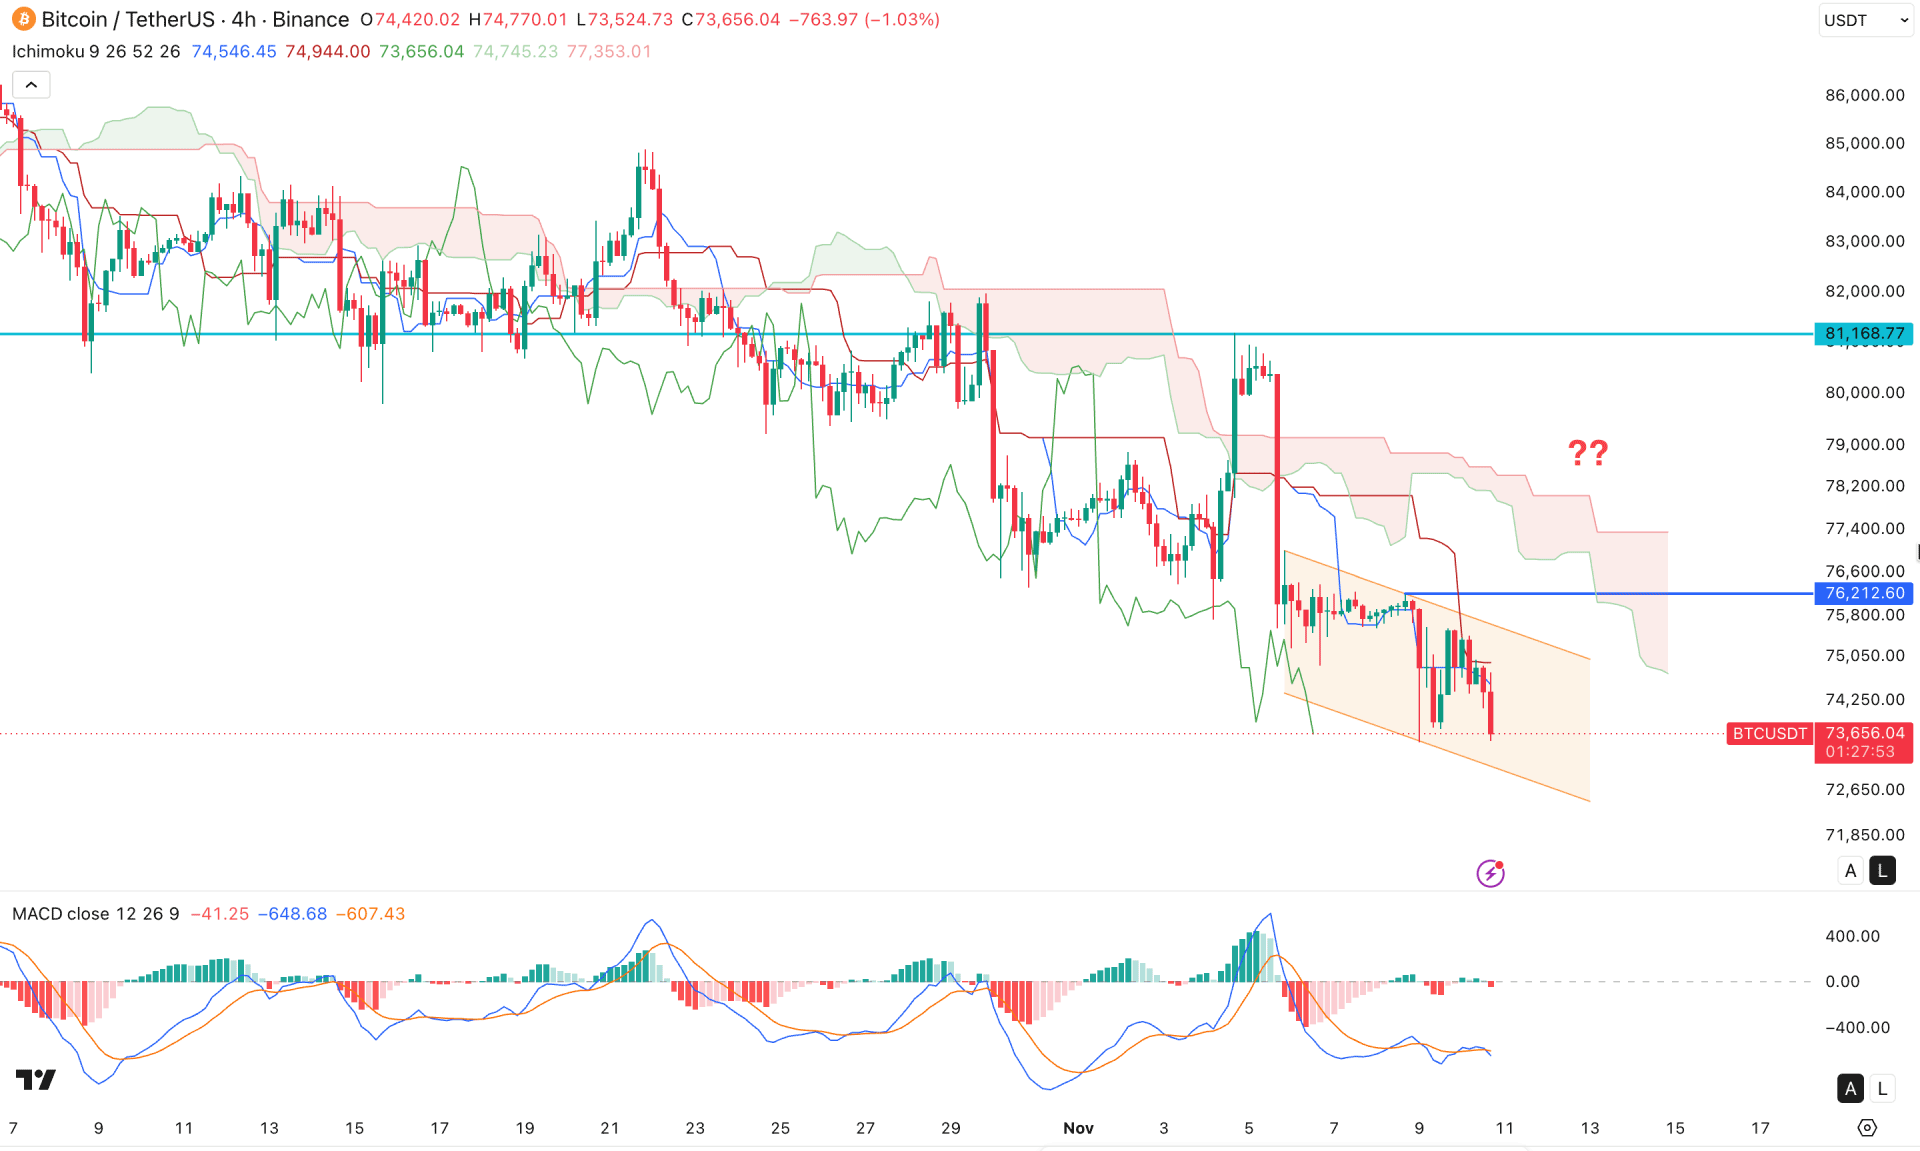
On the four-hour timeframe, BTC/USDT is trading in a bearish trend, with the most recent price in a discounted trading zone. Primarily, the price is at a demand area from where a sufficient bullish correction is possible.
On the other hand, the recent bullish rebound above the cloud resistance failed to maintain momentum and immediately reversed against the trend. This bearish momentum signals strong selling pressure in the market, creating multiple lower lows.
As a result, the future cloud has flipped position, and price is now continuing lower below dynamic resistance lines.
In the secondary indicator window, the MACD signal line became sideways at the bearish peak area with no valid momentum in the signal line. This signals extreme corrective pressure, and we need more clues before anticipating a trend-trading opportunity.
Based on this context, a bullish correction is pending, and the immediate resistance level to watch is 76,212.60. Above this line, sufficient bullish action might present, and price might be encouraged to move lower after sweeping buy-side liquidity.
On the other hand, extended bullish pressure above the cloud resistance, with a bullish hourly candle close above 81,168.77, could invalidate the bearish structure at any time.
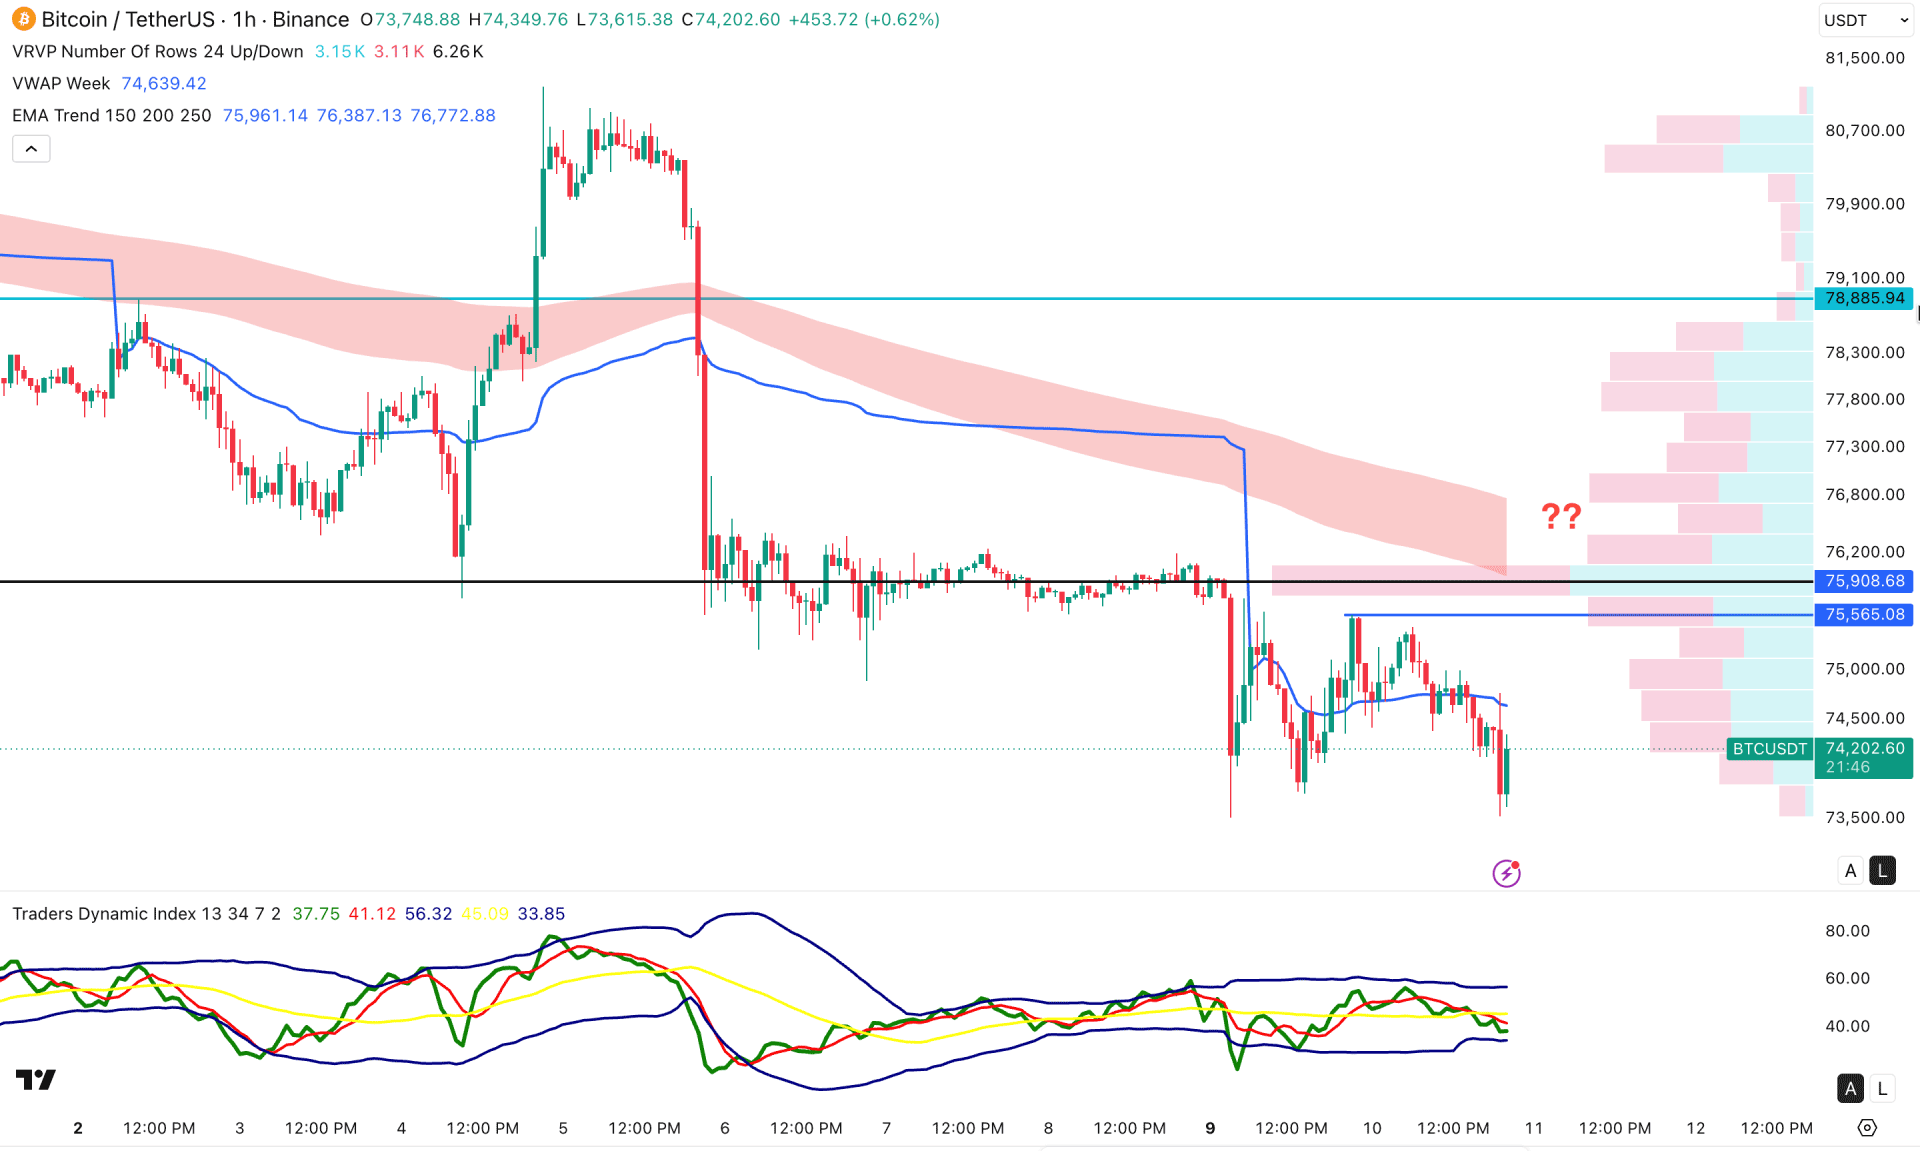
In the hourly timeframe, BTC/USDT is trading at a discounted area from where the most recent price action shows an oversold condition. Primarily, a sideways market with volatility at the bottom could result in a bullish correction at any time.
In the current price structure, the trend remains bearish as price trades below the 75,908.68 high-volume resistance level. Moreover, the EMA wave and weekly VWAP level are above the current price, maintaining a bearish slope.
In the secondary indicator window, the Trader's Dynamic Index hovers below the 50.00 neutral area, signaling an additional bearish factor.
Based on the market structure, the ongoing downside pressure remains valid as long as the price stays below the 75,565.08 resistance level.
On the other hand, a recovery above the 75,908.68 high-volume line with a bullish hourly close could invalidate the bearish structure at any time and open room for testing the 78,885.94 resistance level.
Based on the overall market structure, BTC/USDT is trading within a corrective structure, with enough room to extend bearish momentum. Meanwhile, the intraday chart is near a bottom, where a bullish correction is possible. Investors should remain cautious when seeking a bearish trend continuation, as a valid bullish breakout could resume the broader bullish trend at any time.


