Published: June 23rd, 2021
Bitcoin’s bearish pressure held at June 8 level, indicating that a reversal is pending. In the meantime, Bitcoin achieved legal tender in El Salvador on June 9, which is a historic move for a cryptocurrency like Bitcoin that came a long way.
Despite the winning position of Bitcoin enthusiasts, China was tightening its policies to BTC miners. According to a recent report, the cryptocurrency mining ban in the Qinghai Province increased the possibility of a further embargo on crypto usage in China. As a result, Crypto enthusiasts from China are more bearish than other countries, especially miners. Moreover, miners are moving out from China and setting up their setups in other countries.
Due to this alleged energy shortage, Bitcoin Hash Rate dropped by more than 20% since 8 June 2021. The situation became worse as soon as a Chinese search engine and social media apps blocked the world’s top three cryptocurrency exchanges- Huobi, OKEx, and Binance.
In this context, investors should see what the price says about the future movement before taking any further decision.
Let’s see the future price direction from the Bitcoin technical analysis:
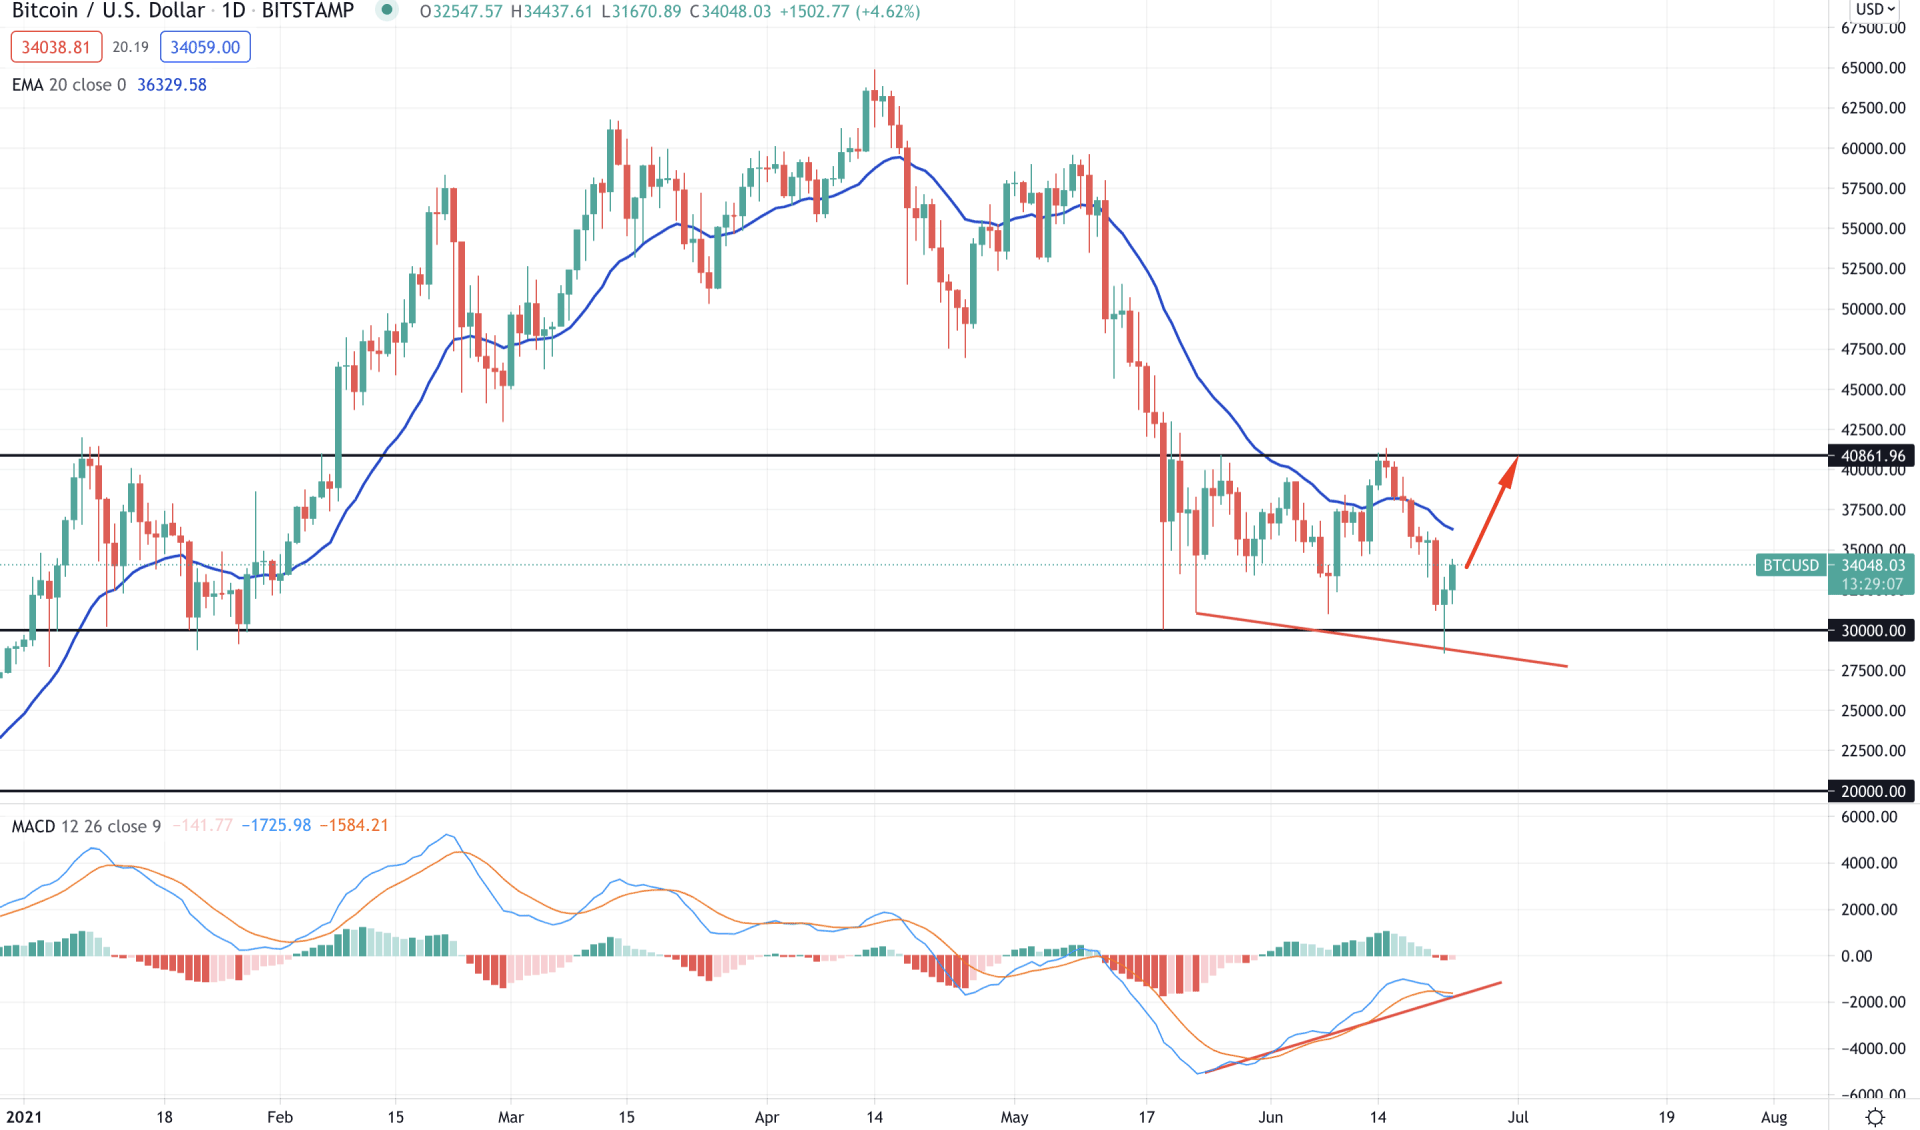
Bitcoin price gained almost 24% from 31,000 to 38,500 level as soon as it was approved as a currency of El Salvador. Later on, the price remained sideways, but the most recent daily close with a bearish rejection at 30,000 key support levels increased the bullish possibility.
Before that, the price moved higher at the 40861.96 resistance level but failed to hold the momentum. As a result, the price moved down below the dynamic level of 20 EMA and created hope for a bearish breakout below the 30,000 level.
In the above image, we can see the daily chart of Bitcoin, where the price remained volatile within the range of 30,000 to 40861.96 level. Therefore, the recent rejection from the 30,000 level created hope for buyers that may take the price to at least the top of the range.
Besides, MACD Histogram became bearish but failed to make new lows. Therefore, the shift of MACD Histogram from bearish to bullish with a regular divergence with the price may work as an additional confirmation of the possible buy trend.
However, the price is still consolidating after an impulsive bearish pressure, where a daily close below the 30,000 level has a higher possibility of continuing the bearish trend.
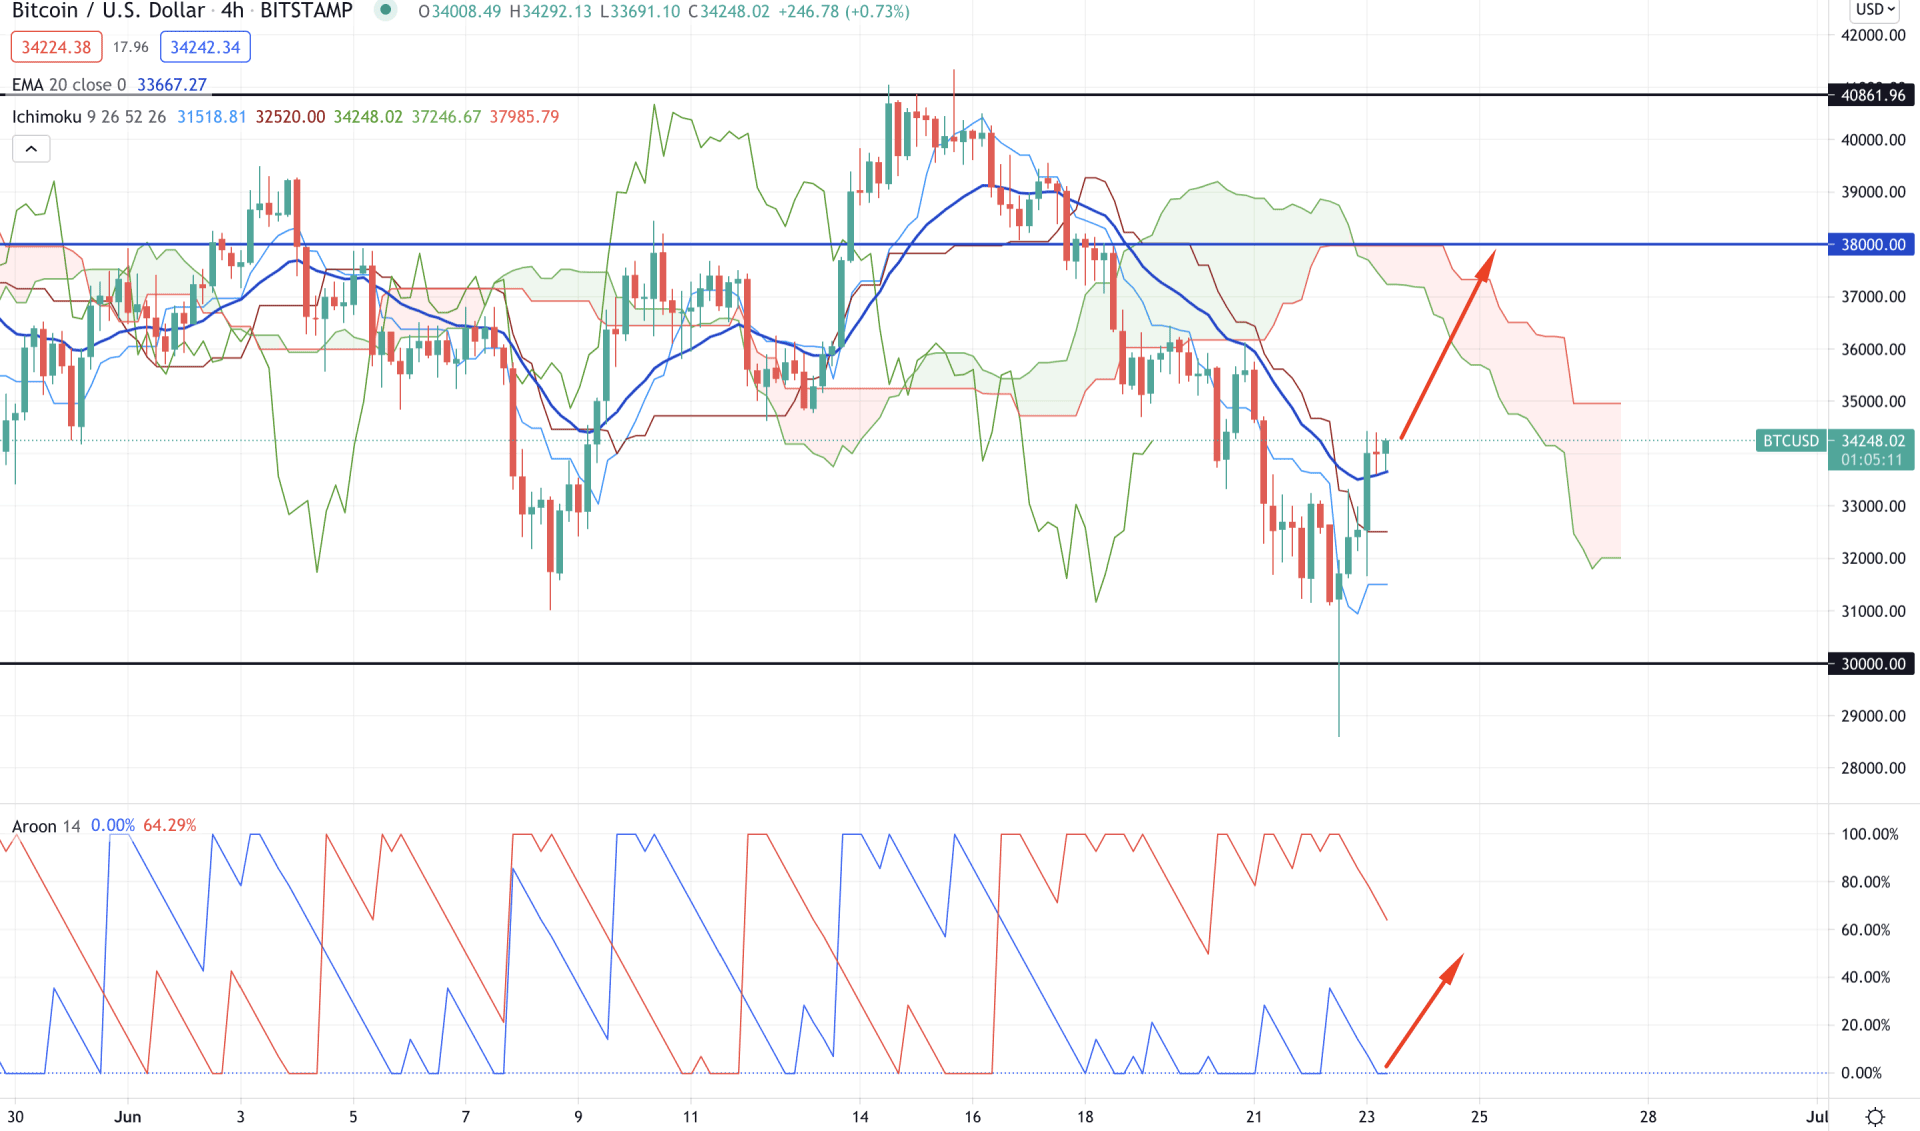
If we plot the Ichimoku Kinko Hyo on the H4 timeframe, we would see that the price moved above the dynamic Tenkan Sen and Kijun Sen with a solid bullish candle. However, Senkou Span A is below Senkou Span B in the future cloud, and the Chikou Span is still below the price. Therefore, the price is not ready for a solid bullish move where investors should wait for confirmations from Aroon Indicator.
In the indicator window, we can see that the Aroon Down (red line) is above the Aroon Up (blue line) and pointing downwards. Therefore, investors should wait for a crossover, and any shift in Aroon lines would be the beginning phase of a bullish trend.
The current price showed a strong bullish pressure and moved above the Dynamic Kijun Sen. So the immediate price target would be the 38,000 Kumo resistance level. Breaking above this level with a strong bullish H4 close may take the price higher above 40,000 level.
On the other hand, any rebound from the Kumo resistance may increase the volatility that may take the price lower towards the 30,000 level.
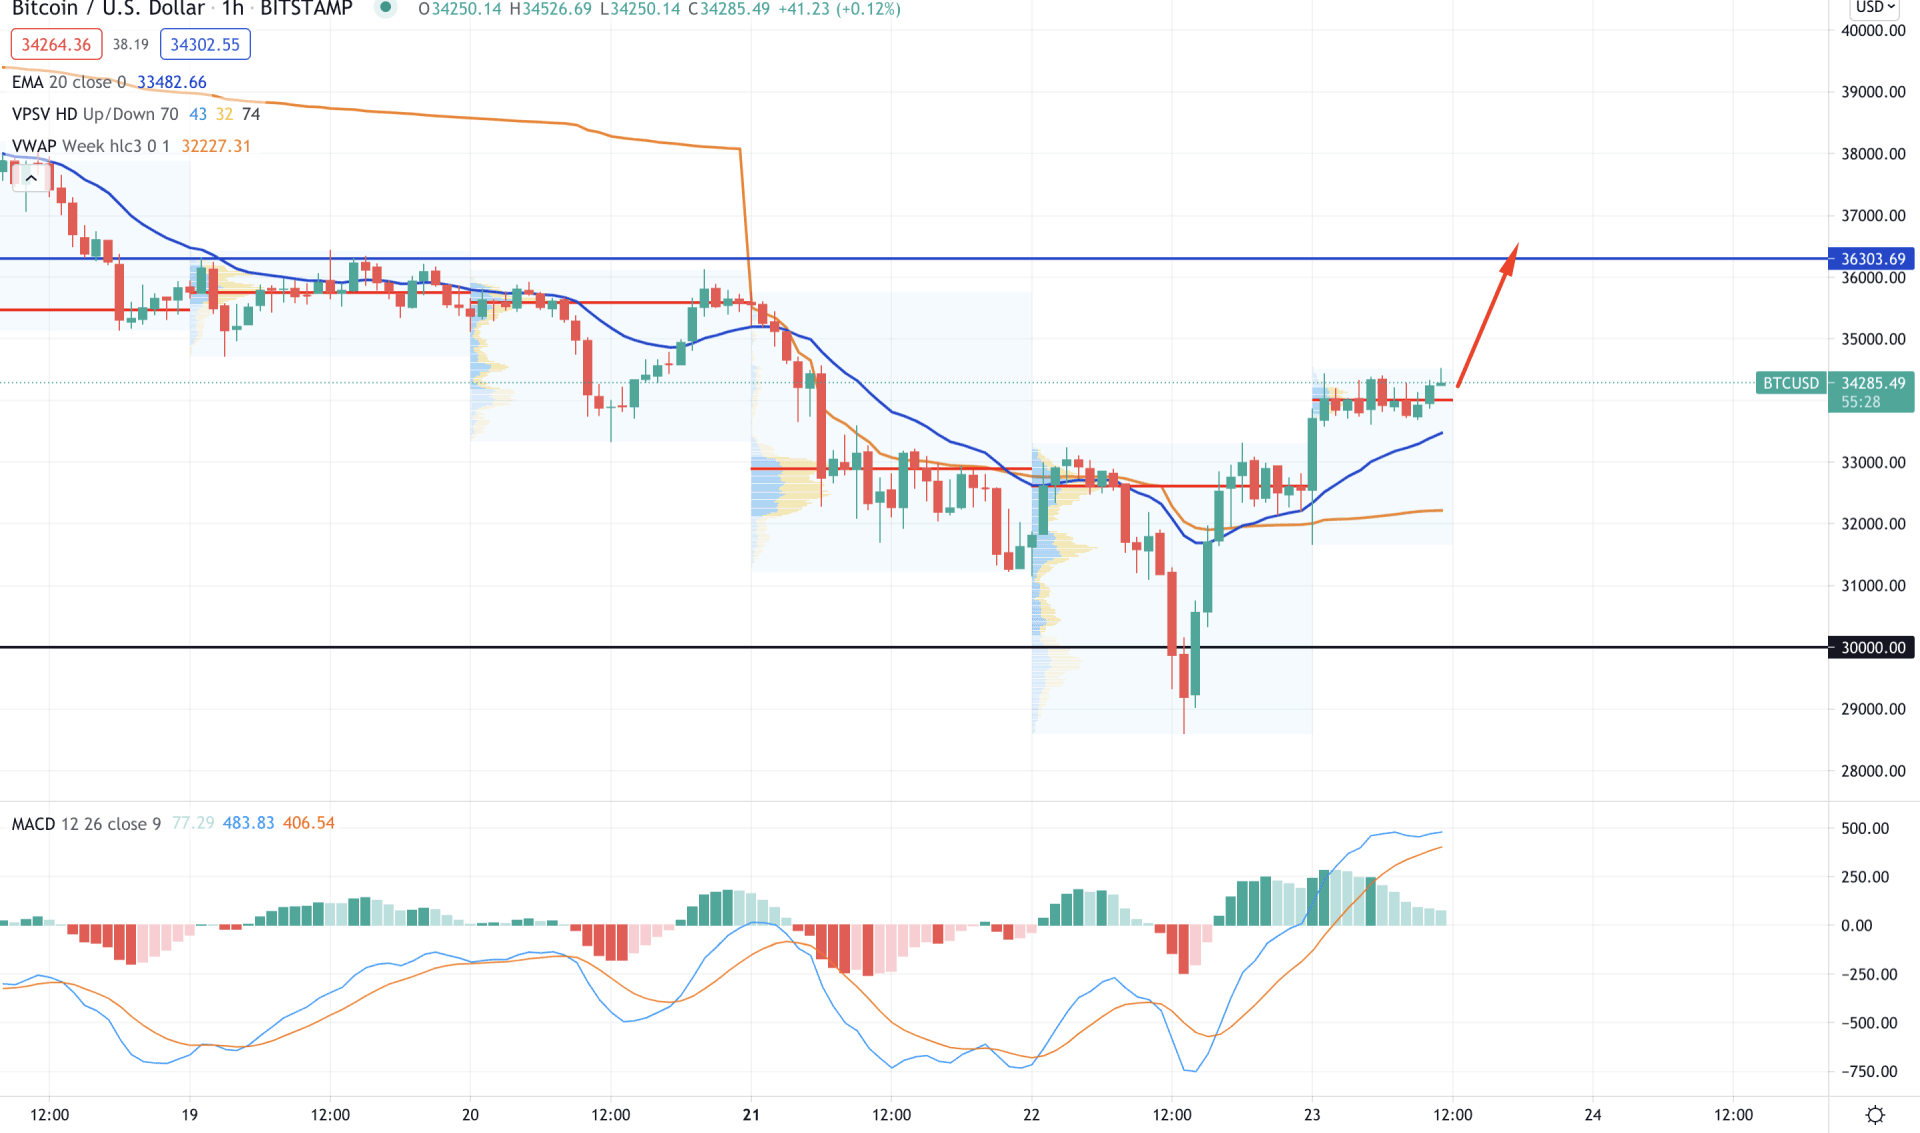
In the intraday price chart, Bitcoin showed a V-shaped recovery from the 30,000 level. Moreover, the price successfully broke above the high volume level near 32,700 areas. Therefore, as long as the price is trading above the 32,700 level, it has a higher possibility of continuing the current bullish pressure.
The above image shows that the price is within a correction at the intraday high volume level of 33,947.00, after a strong bullish H1 candle. Moreover, the price is above the dynamic 20 EMA and vwap on the H1 timeframe, increasing bullish pressure.
MACD Histogram is still bullish where any new high in the Histogram can increase the bullishness to the price. The primary target of the bullish pressure is 36,303.69 level, and any stable price above this level may breach the 40,000 level.
On the other hand, a strong bearish H1 close below the dynamic vwap level and the high volume level at 32,700 may initiate a bearish movement towards the 30,000 level.
As of the above discussion, we can say that Bitcoin may move higher towards the 40,861.96 resistance level as long as the price is trading above the intraday high volume level of 32,700.
On the other hand, investors should find a strong bearish H4 close below the dynamic Kijun Sen in the H4 chart to consider the following possible movement as bearish.


