
Published: March 3rd, 2022
One of the essential on-chain data, Bitcoin taker buy/sell volume shows that the buying momentum in the BTC price has appeared as the current value of the indicator reached above 0.50 level.
According to the recent post from CryptoQuant, BTC taker buys volume reached a level from where buying momentum was seen in history. The taker volume measures the long volume on Bitcoin from different derivative exchanges. When the value of this indicator hits 0.50 level, bulls have likely gained momentum, and the price is likely to move higher. On the other hand, the opposite version of this indicator is the taker sell volume that reached naturally down, pointing out fewer sellers' dominance in the market.
Besides, Bitcoin faced three consecutive bearish months after the November peak. Later on, the price struggled to change the momentum and succeeded by forming a monthly bullish candle in late February. After three bearish months, the bullish closing in February shows buyers present in the price. A similar price pattern was seen in December 2011, June 2015 and February 2019. On the other hand, the recent surge in the overall crypto market cap above $2 trillion is a sign of increased investors’ activity. In that case, any bullish sign from the BTC/USDT price from technical analysis might provide a decent buying opportunity.
Let’s see the upcoming price direction from the BTC/USDT technical analysis:
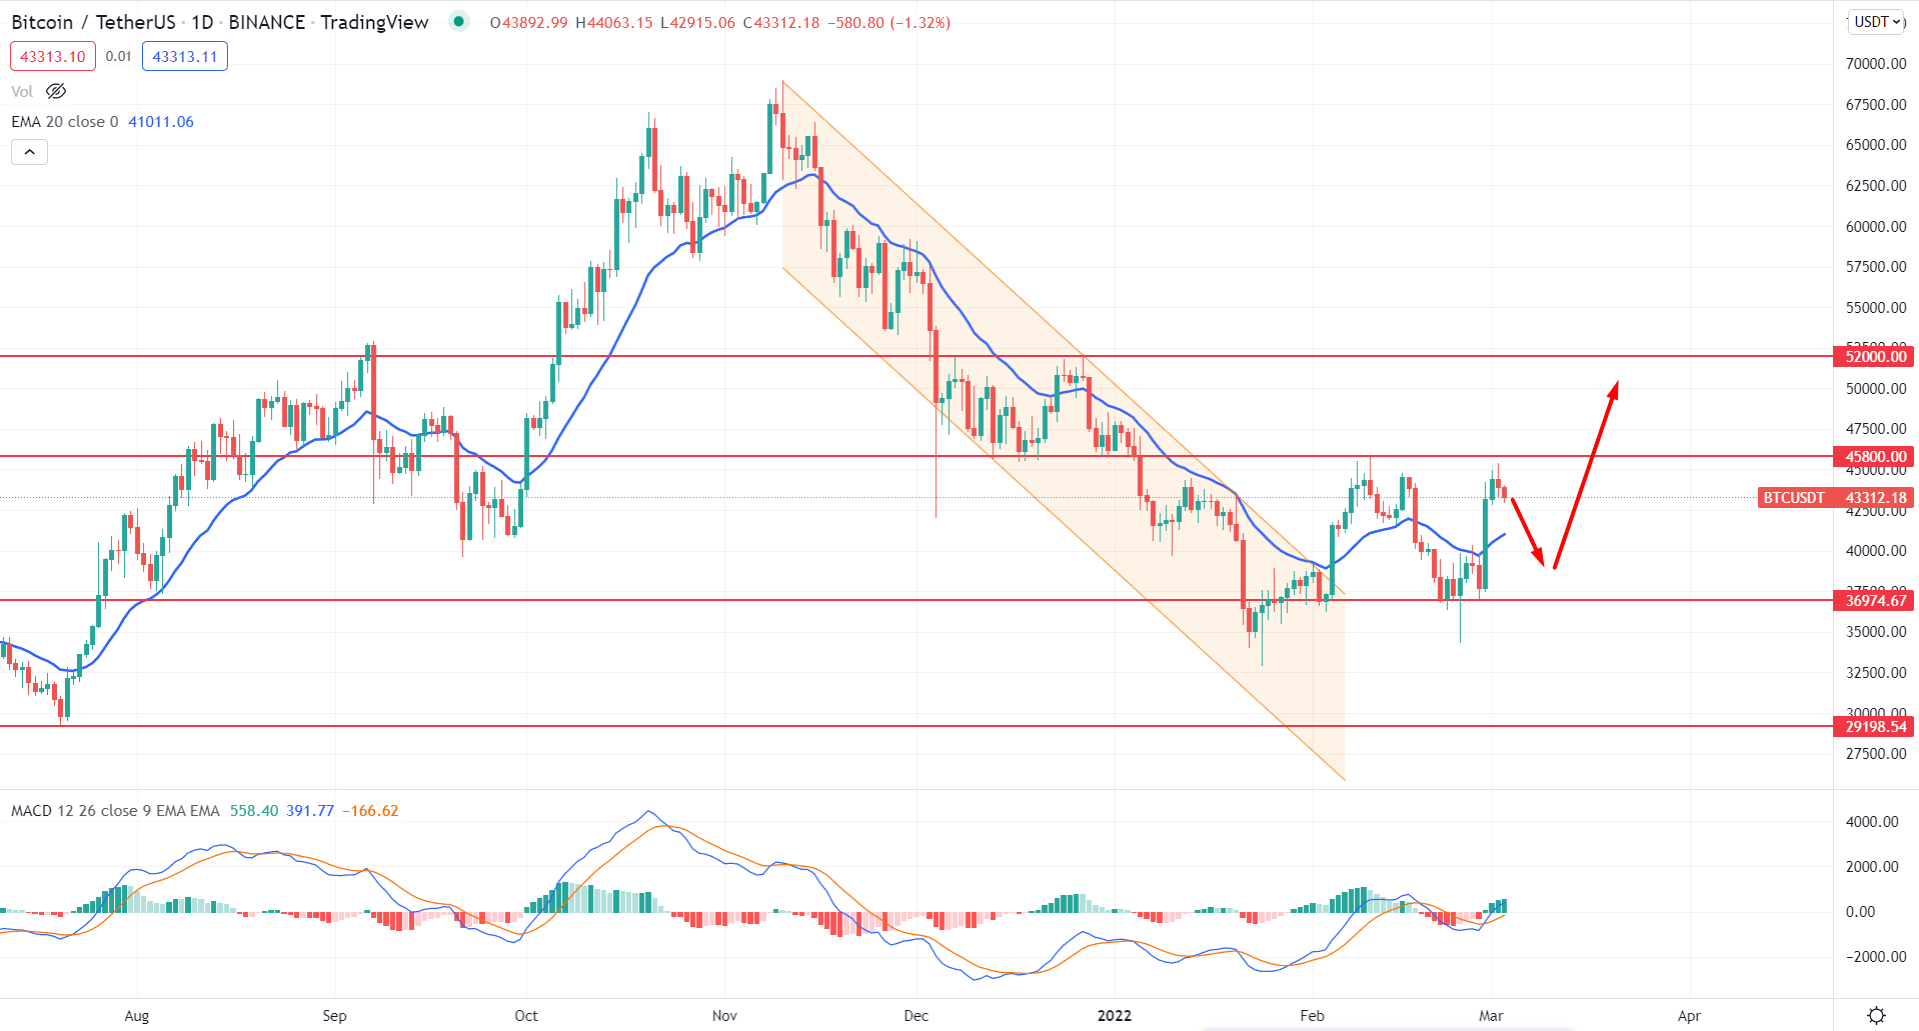
In the BTCUSDT daily chart, the price recovered from the recent price crash from 69,000.00 to 32917.30 level. Bulls were above the form of a bearish channel breakout with a consolidation. Therefore, any bullish sign from the current range between 45,800.00 to 36,974.67 has a higher possibility of showing buying pressure in the coming days.
The above image shows how the MACD Histogram shifted from bearish to bullish and aimed higher while dynamic 20 EMA is below the price. In that case, the buying sentiment is valid until a new Histogram appears below the MACD neutral line.
Based on the current price context, a bearish correction and bullish candlestick formation from dynamic 20 EMA to 36,974.6 has a higher possibility of extending the buying momentum towards the 52800.00 resistance level. On the other hand, another bullish approach is to wait for a bullish daily candle above the 45,800.00 level and wait for buying pressures in the intraday chart.
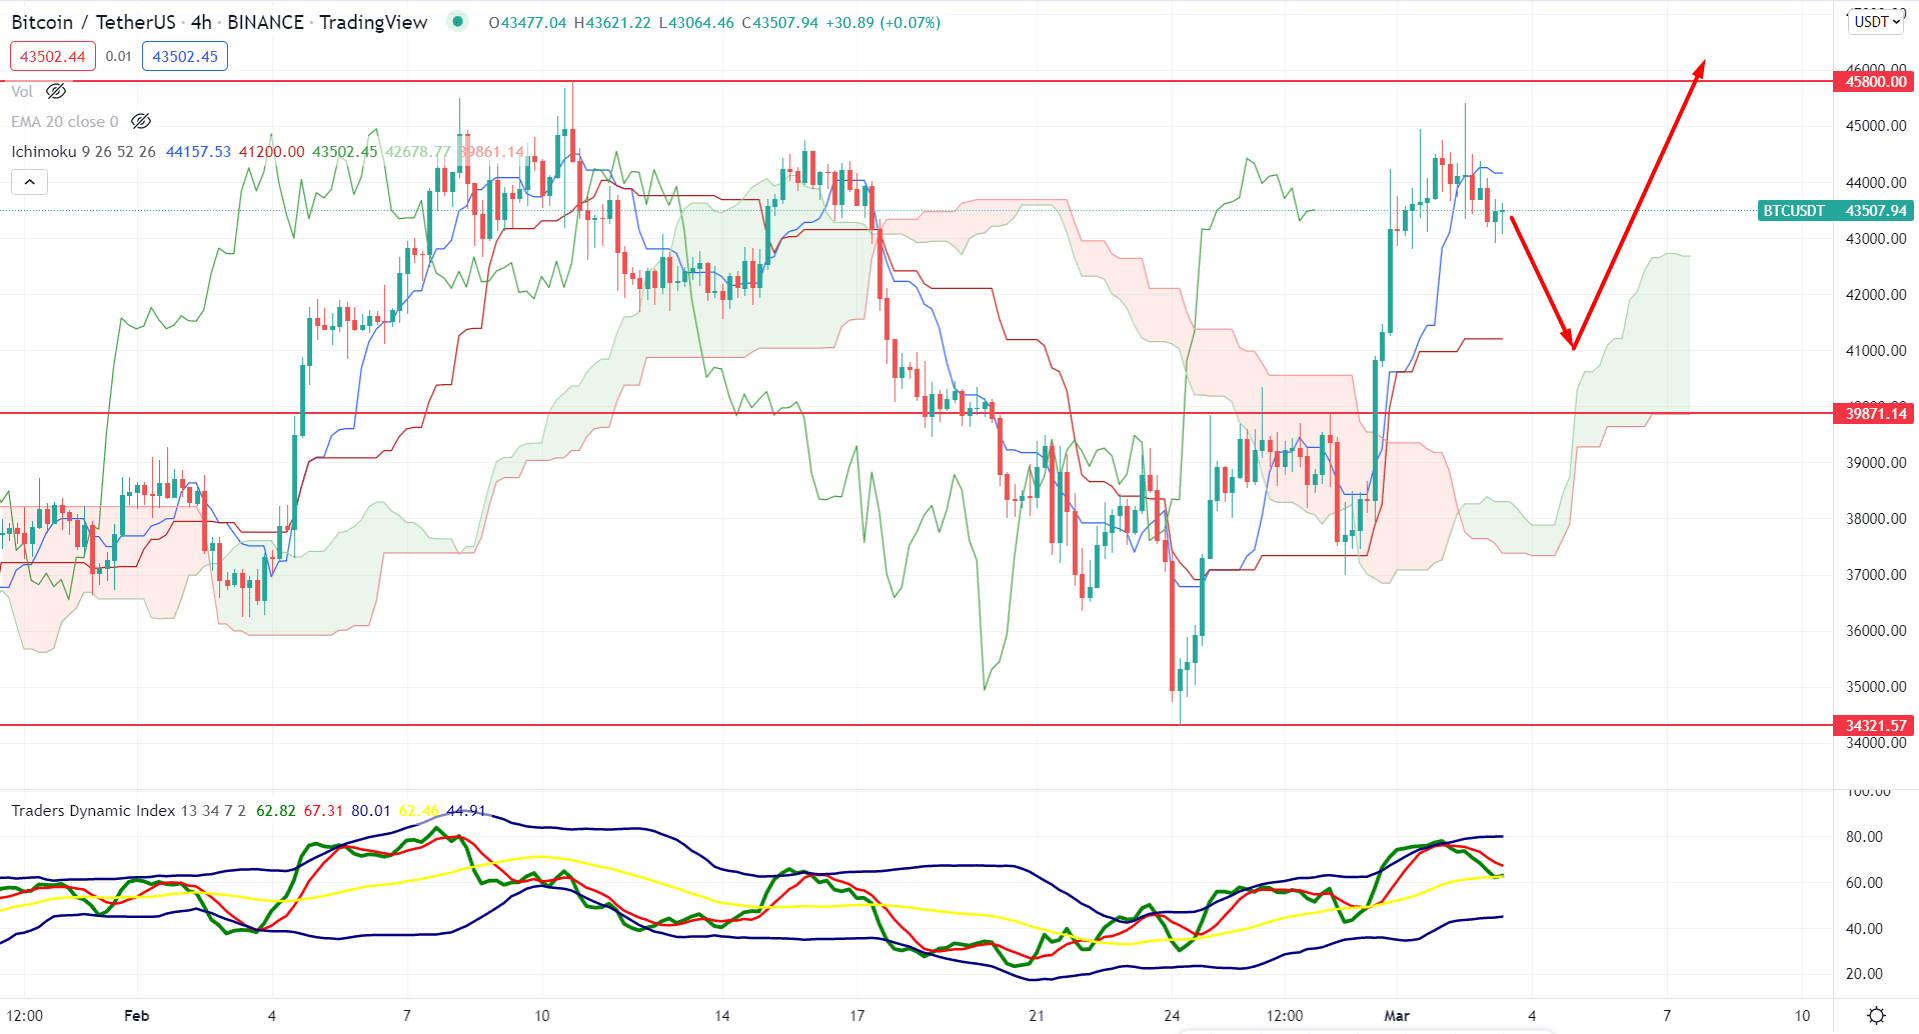
According to the Ichimoku Cloud analysis, the BTCUSDT H4 chart is trading within a bullish momentum while the future cloud is strongly bullish. The Senkou Span A is above the Senkou Span B in the future cloud, while the Lagging Span is above the price. Moreover, the current price is above the Kumo Cloud, followed by a strong bullish breakout.
The above image shows how the Traders Dynamic Index is moving up where a rebound from 50 levels would increase the possibility of testing the 80.0 upper level. Moreover, the current price is above the dynamic Kijun Sen while both dynamic levels are above the Cloud area.
In this context, investors may experience a bearish correction in the price where any bullish rejection from dynamic Kijun Sen or static 39,871.31 would be a buying opportunity with the target of 45,800.00 level. On the other hand, any bearish H4 candle below the Kumoi Cloud might increase the possibility of a correction before showing another buying sign.
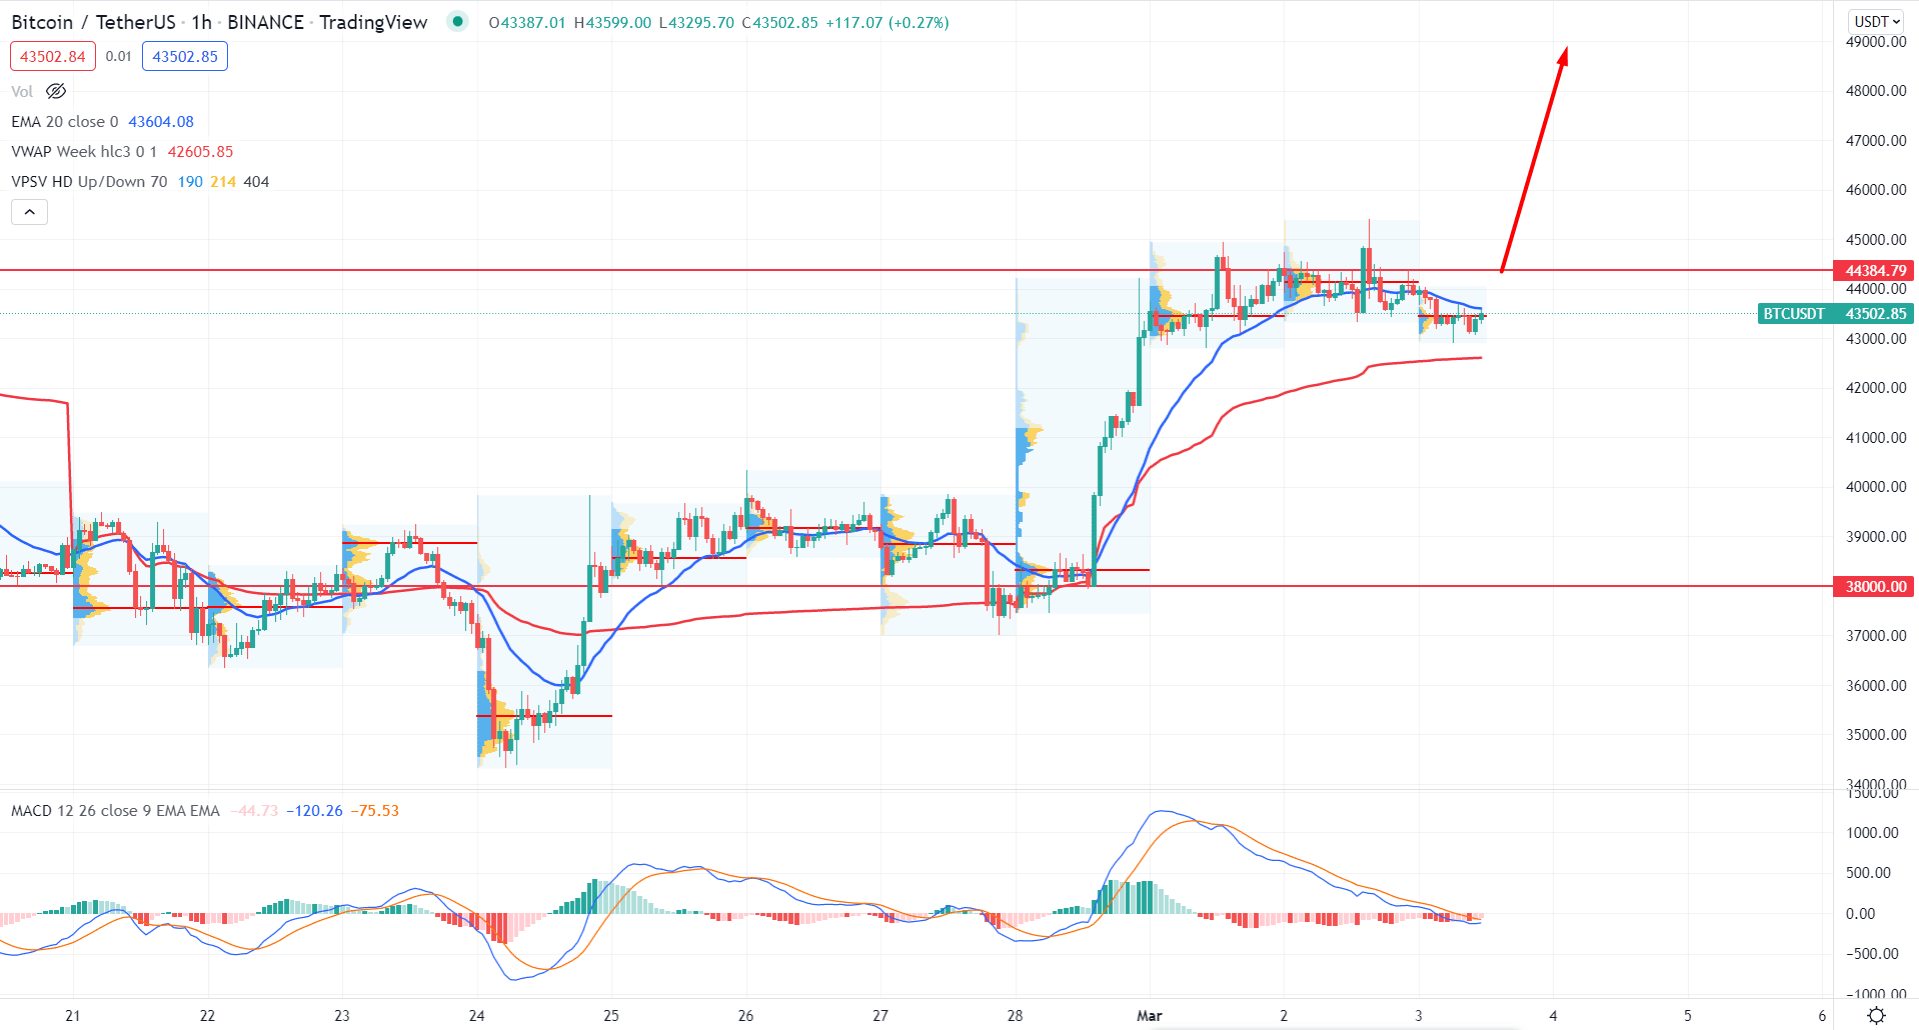
BTCUSDT is trading within a corrective momentum in the intraday chart, backed by a strong bullish trend. As a result, the current correction might provide a buying opportunity with an upcoming impulsive bullish pressure.
The above image shows how the price trades above the dynamic Weekly VWAP while the MACD line reaches the neutral zone. However, the MACD Histogram is still bearish while the price struggles to show a bullish momentum above the dynamic 20 EMA.
In that case, a bullish H1 candle above the dynamic 20 EMA and static 44,384.79 has a higher possibility of extending the current bullish pressure towards the 50,000.00 key level. On the other hand, a break below the dynamic weekly VWAP might extend the bearish correction towards the 38,000.00 level.
As of the above discussion, we can say that the BTCUSDT has a higher possibility of extending the current bullish pressure as the price consolidates after the bearish channel breakout. In that case, any bullish sign from H4 or H1 timeframes would provide a reliable trading opportunity.