
Published: November 8th, 2023
BioMarin Pharmaceuticals (NASDAQ: BMRN) witnessed a share surge exceeding 12% this week. The disclosure that Elliott Investment Management has been discreetly constructing a stake in the company and collaborating closely with its management for several months has served as the impetus for this ascent. This partnership signifies Elliott's considerable interest as an activist investor.
Elliott Investment Management, renowned for its proactive engagement in underperforming firms, frequently pursues board seats and influence to effectuate favorable transformations. BioMarin, which was experiencing subpar performance in comparison to the wider biotechnology industry, has been redeemed positively by the market as a result of Elliott's participation.
Elliott's substantial investment of more than $1 billion in BioMarin, a firm with an estimated $16 billion market capitalization following the latest advance. Elliott's impact could potentially yield advantages for BioMarin by facilitating the drug launch process and optimizing the execution plans. Certain investors perceive BioMarin as deficient in both strategy and operations; therefore, Elliott's novel outlook is anticipated to contribute to the company's potential recovery.
Let’s see the possible price action from the BMRN technical analysis:
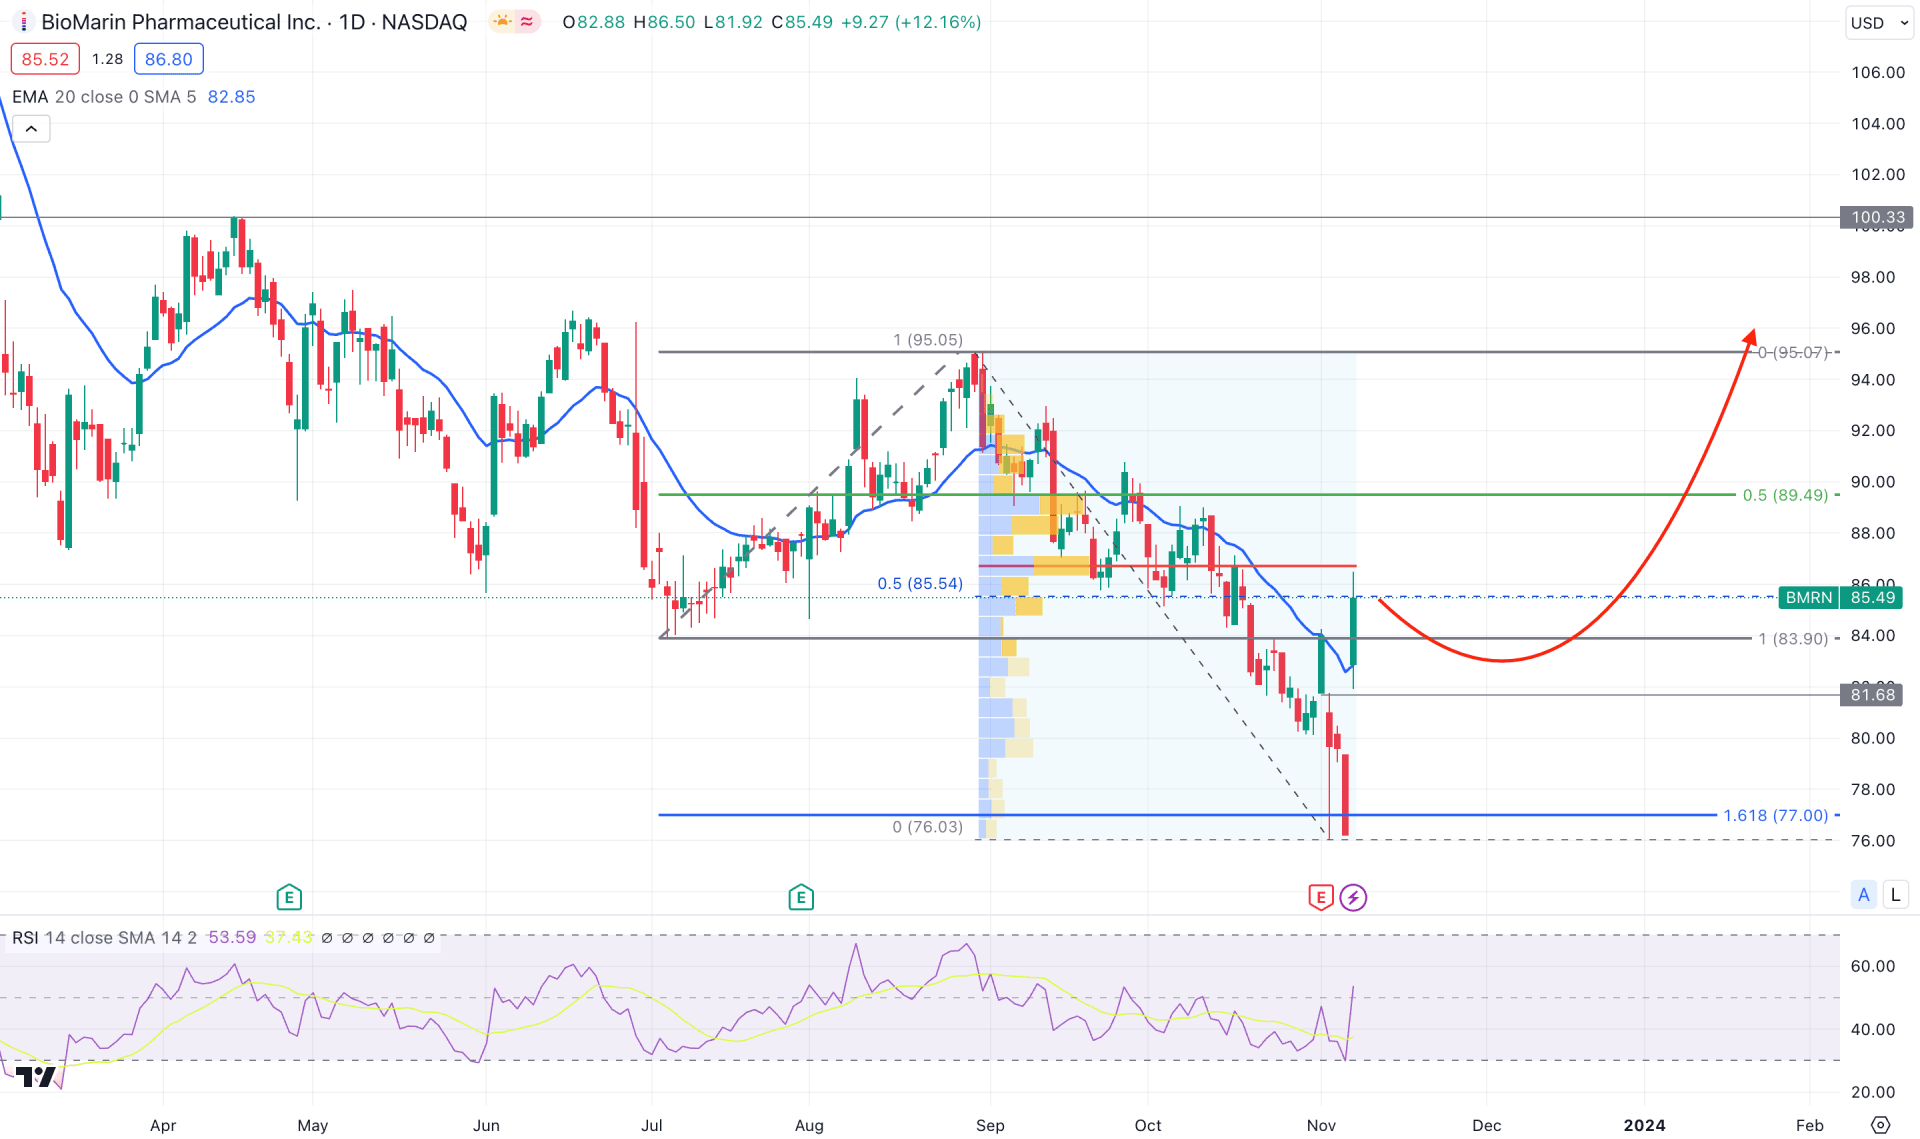
In the daily chart of BMRN, the recent price shows extensive bearish pressure but the lower price helped institutions to buy this stock with an upward possibility.
In the latest price action, the selling pressure from the 95.07 top came with a bearish trend continuation, which moved below the 83.90 support level. Later on, the price found a bottom at the 77.00 level, which is the 161.8% Fibonacci Extension level from the 89.90 to 95.07 zone. As the recent price showed buyers’ interest from this significant low, we may expect the buying pressure to extend in the coming days.
In the higher timeframe, the monthly candle suggests ongoing bullish pressure from the ongoing ascending trendline support, while the weekly suggests a strong recovery after indecision.
In the daily chart, the highest active level from the 30 August 2023 high is at 86.74, which is above the current price. The secondary window suggests a bullish possibility as the recent Relative Strength Index (RSI) rebounded from the 30.00 level.
Based on the current daily price of BMRN, a bullish continuation needs a sufficient downside correction. Therefore, a valid bullish rejection from the 81.68 to 78.00 area could offer a long opportunity, targeting the 95.07 high.
On the other hand, a bearish trend continuation is possible as the current price trades below the crucial high volume level. In that case, a bearish rejection from the 88.00 to 92.00 area could be a short-term short opportunity, targeting the 77.00 level.

In the H4 chart, the recent price trades below the Ichimoku Cloud zone, which is a primary sign of an existing bearish trend. However, extensive selling pressure with a V-shape recovery from the 76.01 bottom suggests a bullish recovery, which may result in a trend reversal in the coming days.
The secondary window suggests a bullish continuation as the RSI is at the 50.00 line, while the MACD Histogram suggests a bullish PNP formation.
Based on the H4 timeframe, the overall market momentum is bullish, where a bearish recovery and a bullish rejection from the dynamic Kijun Sen could be a long opportunity, targeting the 89.00 psychological level.
On the other hand, the bearish continuation could occur if a bearish H4 candle comes below the 80.10 level, which could lower the price toward the 75.00 area.
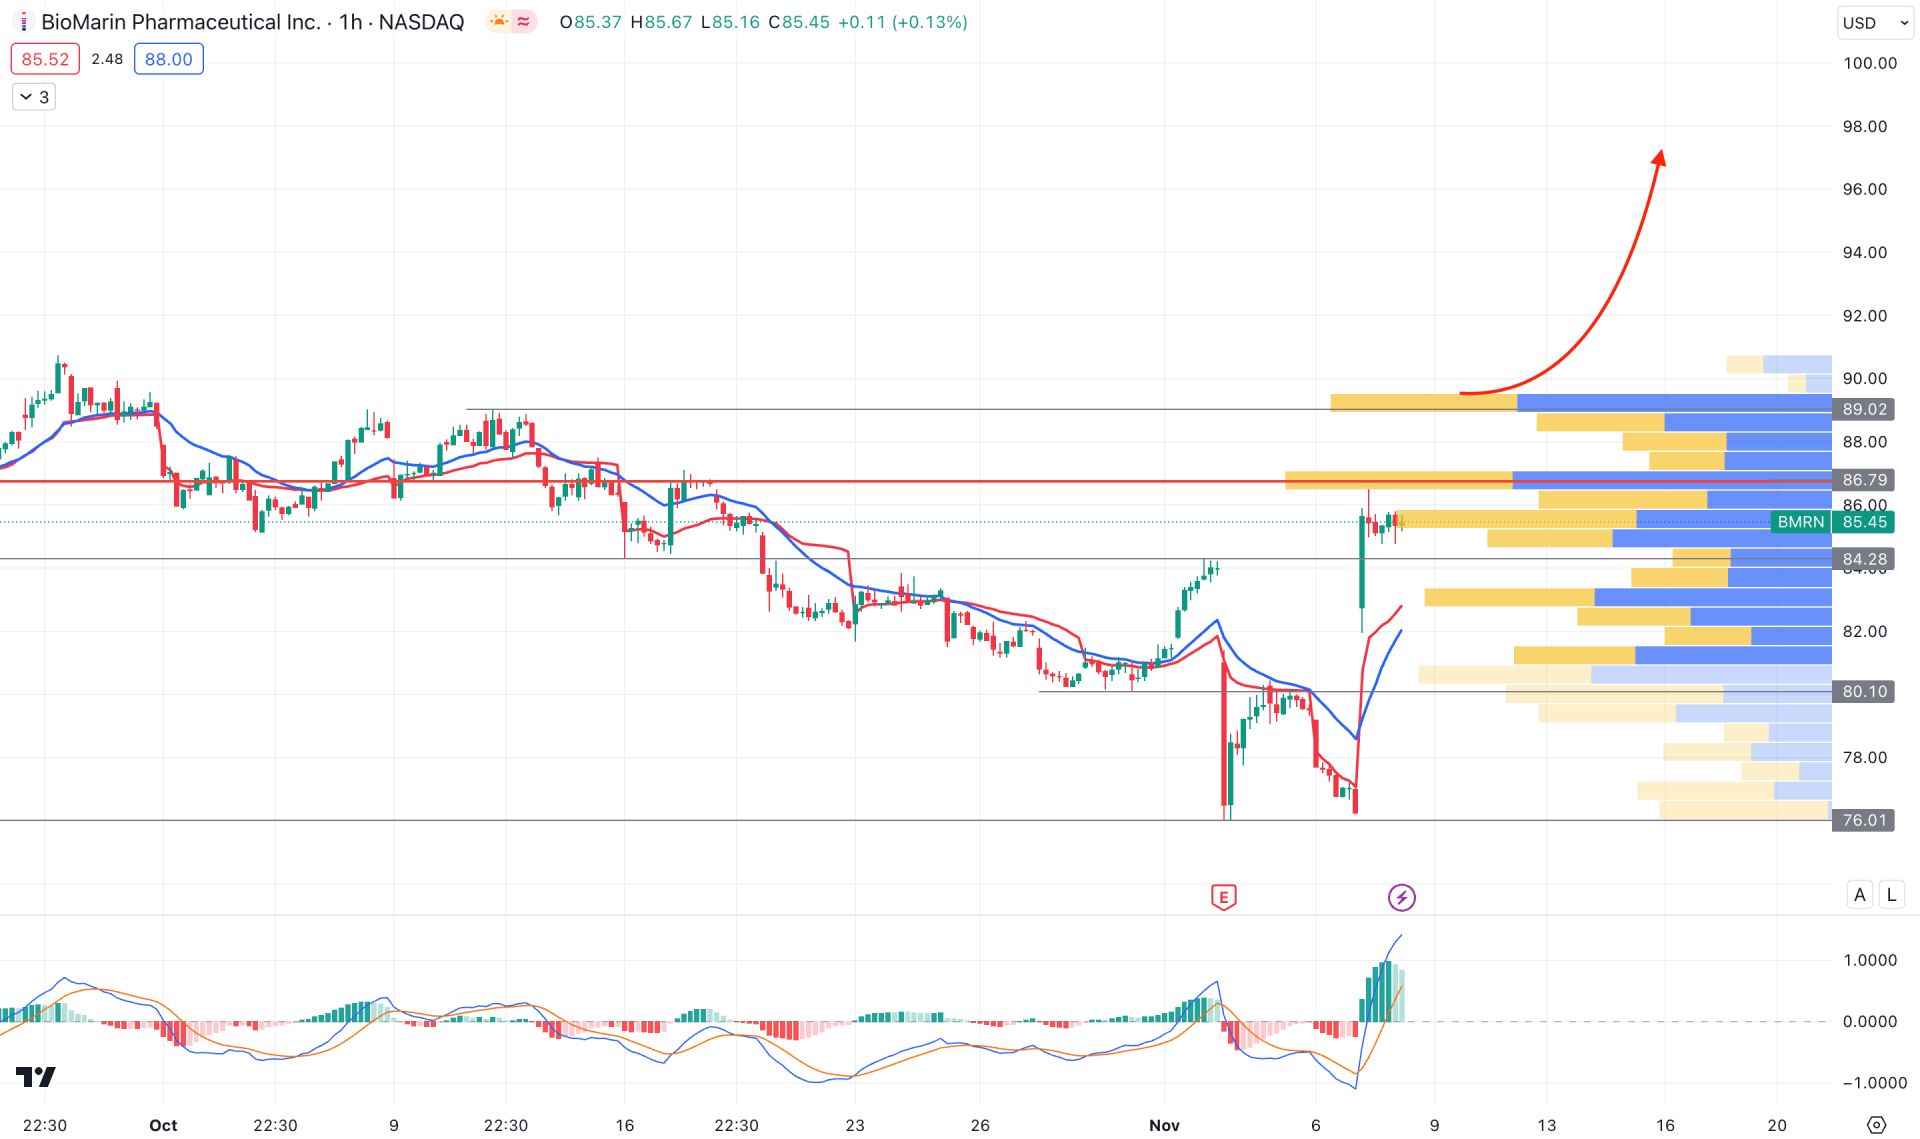
In the hourly chart, the overall market momentum is bullish as the recent price showed a double bottom breakout from the 76.01 support level. As a result, the buying pressure became validated by having an H1 candle above the dynamic 20 EMA.
Moreover, the MACD Histogram shows a bullish pressure by forming a positive Histogram, which is backed by a bullish crossover in the signal line.
Based on this structure, a bullish continuation needs a valid price action above the 86.79 high volume level. In that case, an H1 candle close above the 89.02 resistance level could offer a long opportunity, where the main aim is to test the 100.00 psychological level.
On the other hand, a strong bearish pressure with a candle close below the dynamic VWAP level could lower the price in the coming hours.
Considering the recent bullish volume injection in the BMRN came with a valid bullish reversal with a V-shape recovery. Therefore, as long as the price trades above the H4 Kijun Sen level, we may expect the buying pressure to extend.


