Published: April 6th, 2023
The stock price of Biogen has risen by 3% during the previous week, prompting a review of the company's financial performance.
Return on Equity (ROE) is a profitability statistic that gauges the rate of return on the company's shareholders' capital contributions. Compared to the industry average, the company's return on equity is excellent and reasonable. Still, its five-year net income fall rate of 11% could be explained by other variables. Competitive pressures or a large proportion of earnings paid out as dividends could be a significant barrier to earnings growth.
In addition, while Biogen's earnings have decreased, industry earnings have increased by 35%, which is problematic. This indicator is vital for determining the value of a stock and helps investors assess whether the stock is positioned for a bright or dreary future.
Furthermore, Biogen does not pay dividends, which raises issues as to why the corporation retains its earnings if it cannot invest them in business expansion. There may be underlying concerns hurting the company's financial performance, such as declining earnings and a lack of dividend payments, notwithstanding the company's solid ROE.
Should you buy Biogen stock now? Let’s see the complete price forecast from the Biogen Stock (BIIB) technical analysis:

The weekly chart shows four consecutive bullish closes followed by a 4.9% drop in a single week. As the price recovered the early loss and gained with a V-shape recovery, we may expect that bulls may extend the momentum in the coming days.
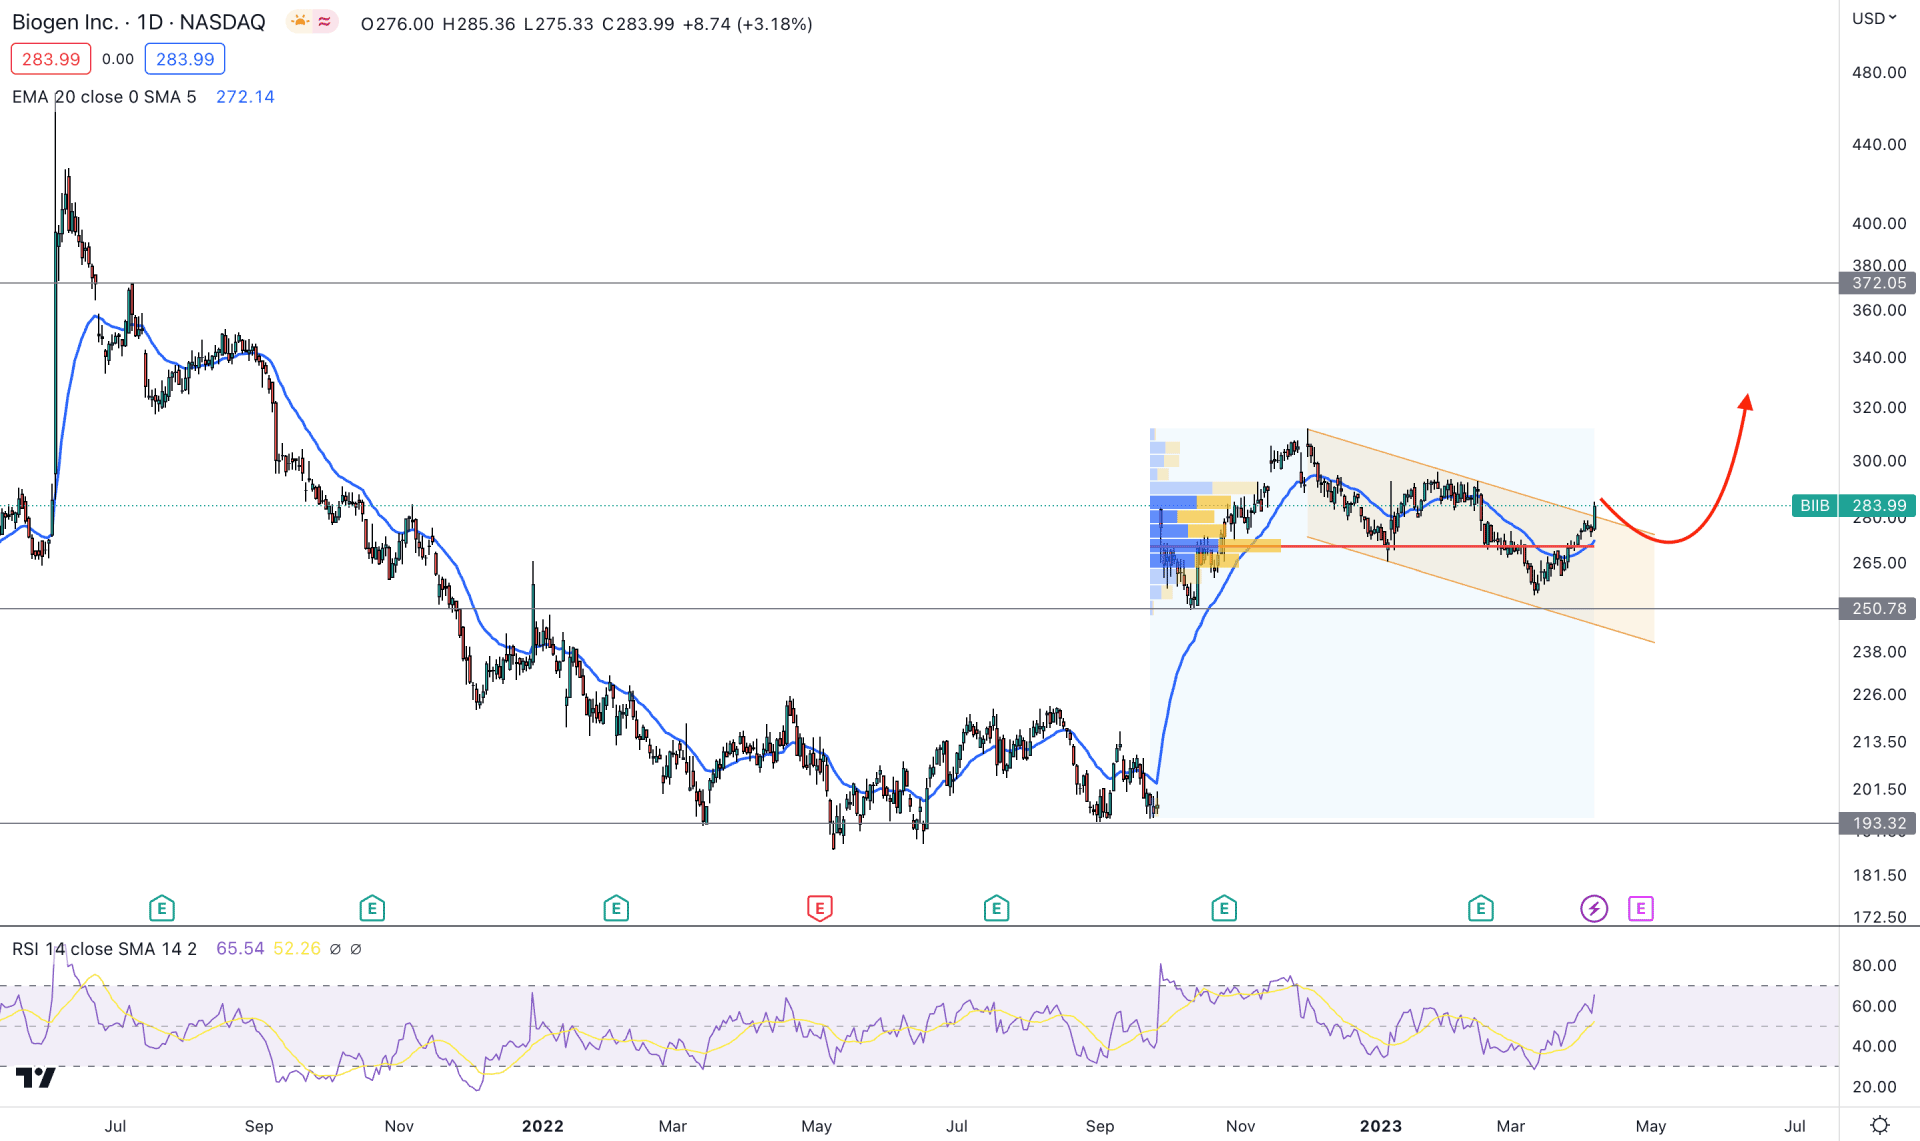
In the daily chart, the upside pressure is solid as the current price trades higher above the descending channel resistance. Also, the channel formation is in the buyers' zone, initiated from the 193.32 swing low. Therefore, a proper downside correction and a bullish rejection from the intraday support could offer a decent buying opportunity in this stock.
According to the high volume level indicator, the largest activity level since 19 September 2022 is at 270.23 level, which is just below the current price. It signals that bulls are in control over bears and can extend their presence in the coming days.
The main chart window shows dynamic support by the 20-day Exponential Moving Average, which signals short-term buyers' activity in the market. Moreover, the current Relative Strength Index (RSI) is stable above the 50.00 line, which signals buyers' presence.
Based on the daily price outlook of BIIB, bulls are active in the market and can increase the price toward the 372.05 resistance level. However, a channel extension is possible where another buying opportunity may come from the 250.00 support level.
However, breaking below the 248.00 level with a daily close could limit the bullish possibility and open a short opportunity toward the 193.00 level.

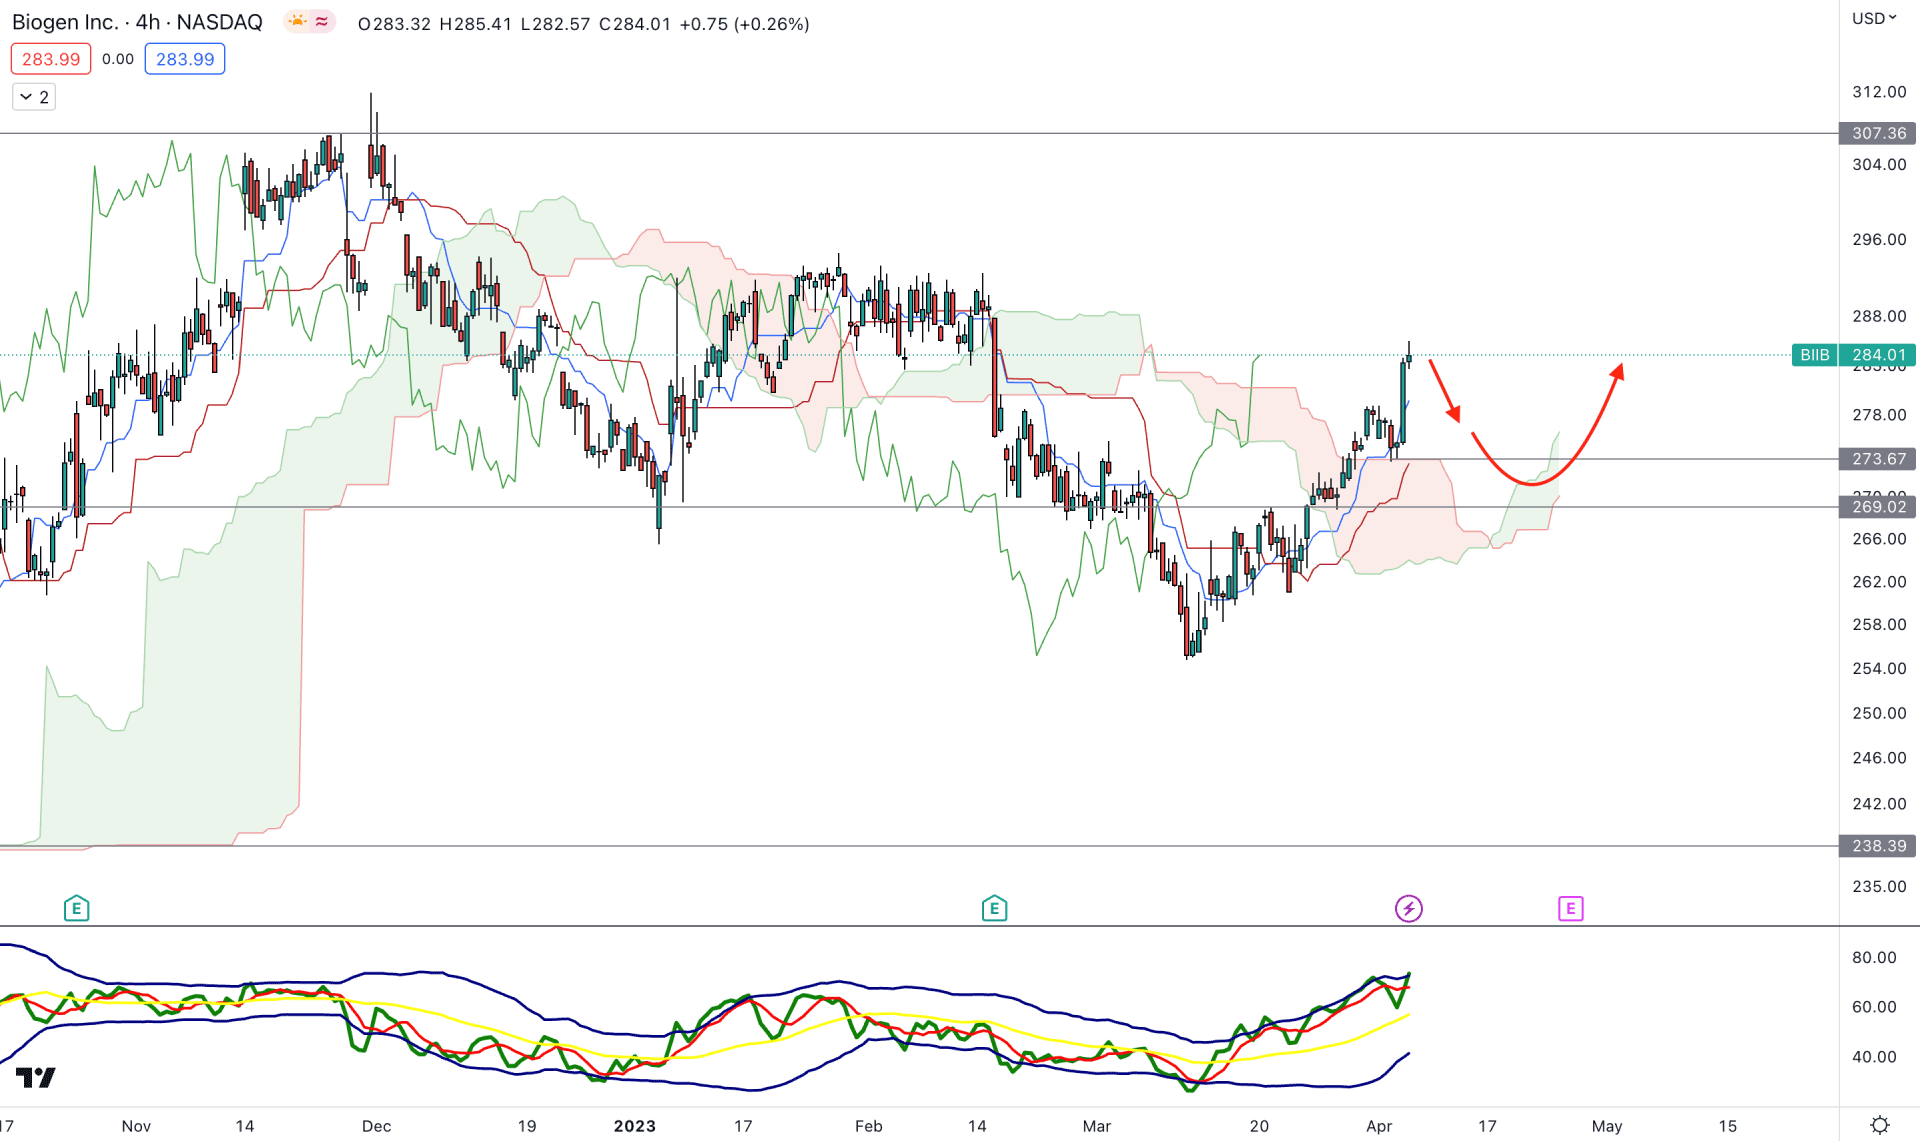
In the H4 chart, the current market outlook of Biogen (BIIB) is bullish, as the recent price showed a bullish breakout above the cloud resistance.
In the future cloud, the upside pressure is valid as the Senkou Span A has a strong position above the Senkou Span B. Also, the Lagging Span is above the current price, while the daily outlook is bullish.
The indicator window shows a valid buying pressure where the current TDI level is at the upper band area. It is a sign that bulls are still active in the market, where a minor bearish recovery is pending.
Based on the Ichimoku Cloud analysis, a decent bearish recovery and a valid bullish rejection from the 273.67 or 269.00 level could offer a long opportunity, targeting the 310.00 level.
The alternative trading approach is to wait for the price to come below the 264.00 level and form a bearish H4 candle. The market sentiment would be bearish in that case, aiming for the 250.00 level.

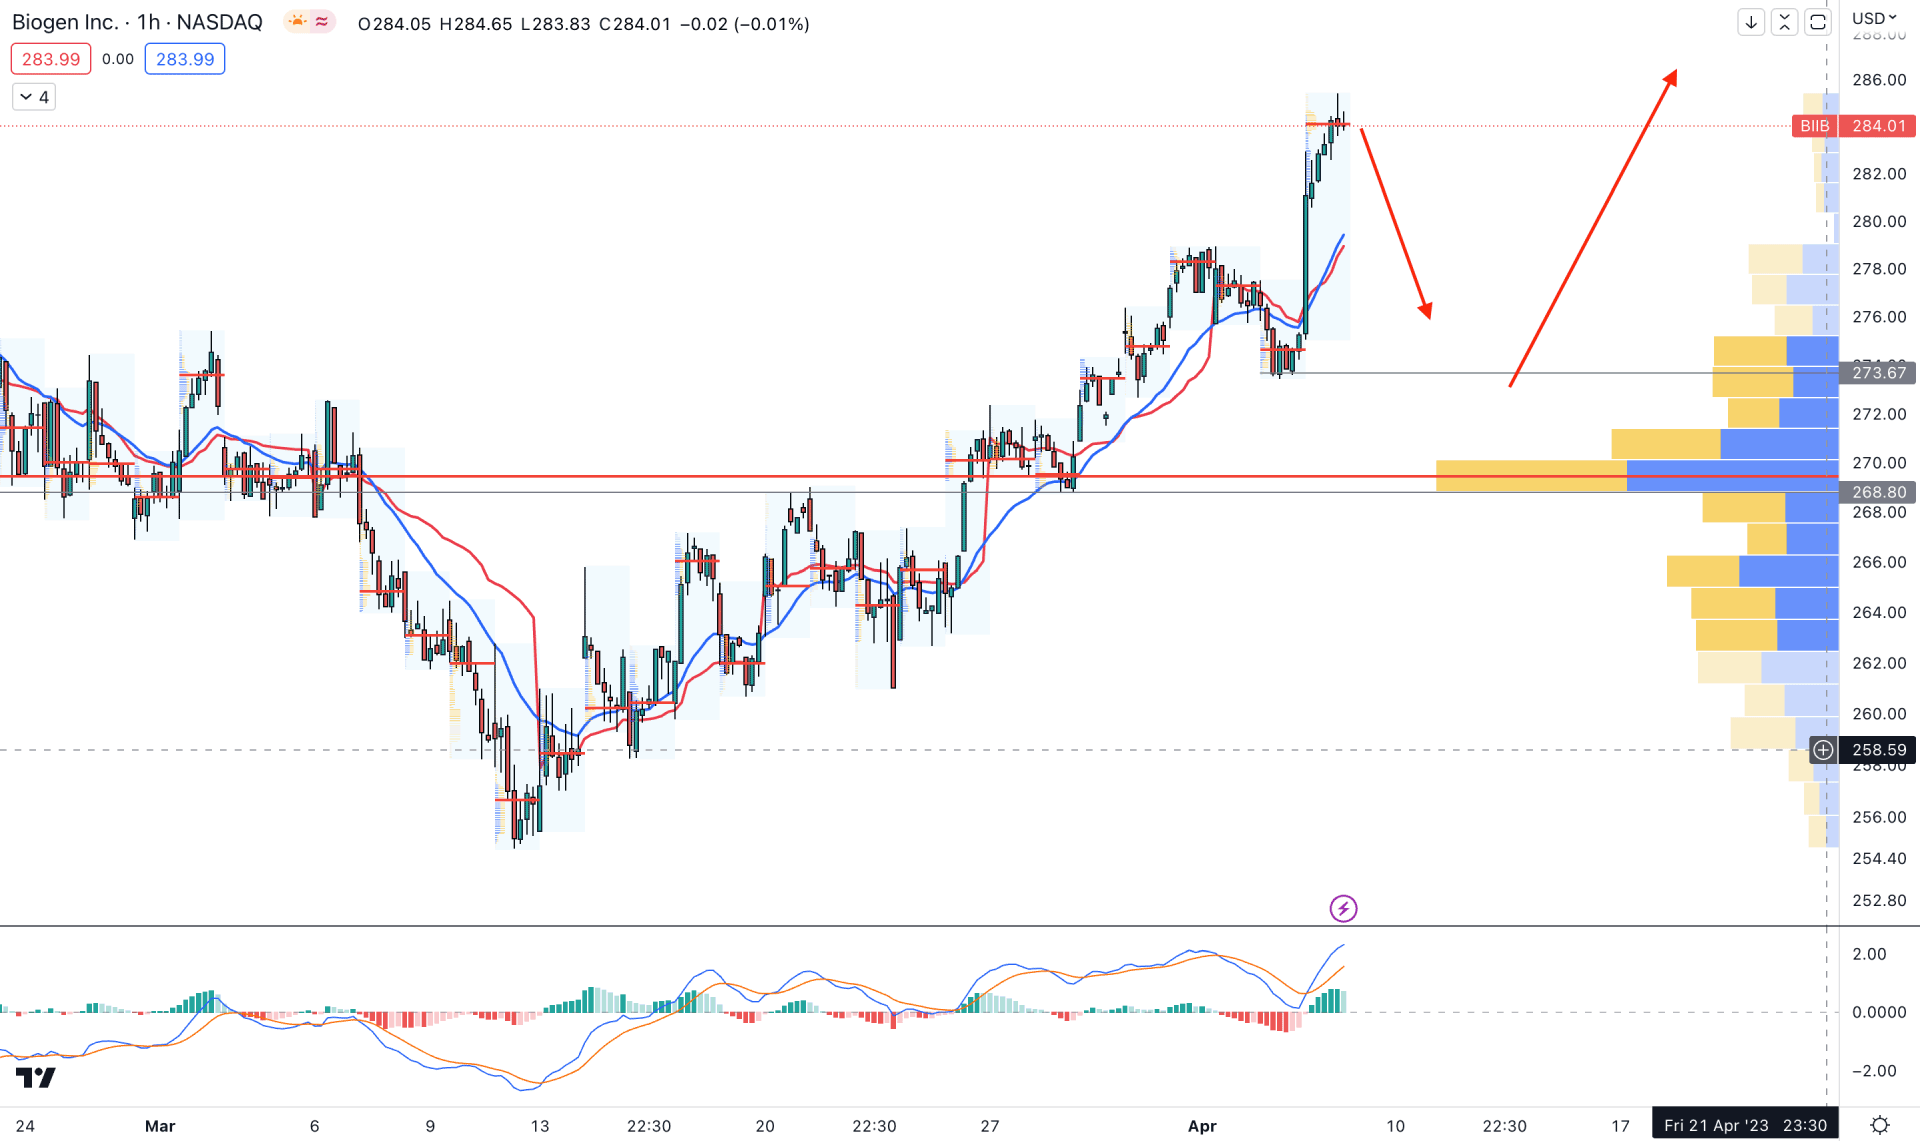
The intraday price of Biogen stock shows an overextended bullish sentiment, where a minor downside correction is pending. Investors should closely monitor how the price reacts on near-term support levels before opening any long position.
The MACD Histogram is bullish in the indicator window, where MACD EMA’s are at the overbought zone.
Based on this outlook, a minor downside correction is pending in this instrument toward the dynamic 20 EMA support. Therefore any bullish rejection from the 276.00 to 270.00 area could offer a long opportunity, targeting the 320.0 level.
However, breaking below the 268.00 level with a bearish H4 candle could lower the price towards 250.00.
Based on the current market outlook, Biogen Stock (BIIB) could complete a downside correction in the intraday chart, before joining the long-term bullish trend. In that case, investors should focus on how the price trades on H4 support level before taking a trading decision.