
Published: July 6th, 2020
The Binance coin always remained one of the most attractive cryptocurrencies in terms of investment opportunity. This is because it has real use-case and real value compared to so many other coins. Let’s observe the current price action on 5 different timeframes to understand the short, medium, and long-term price perspective.
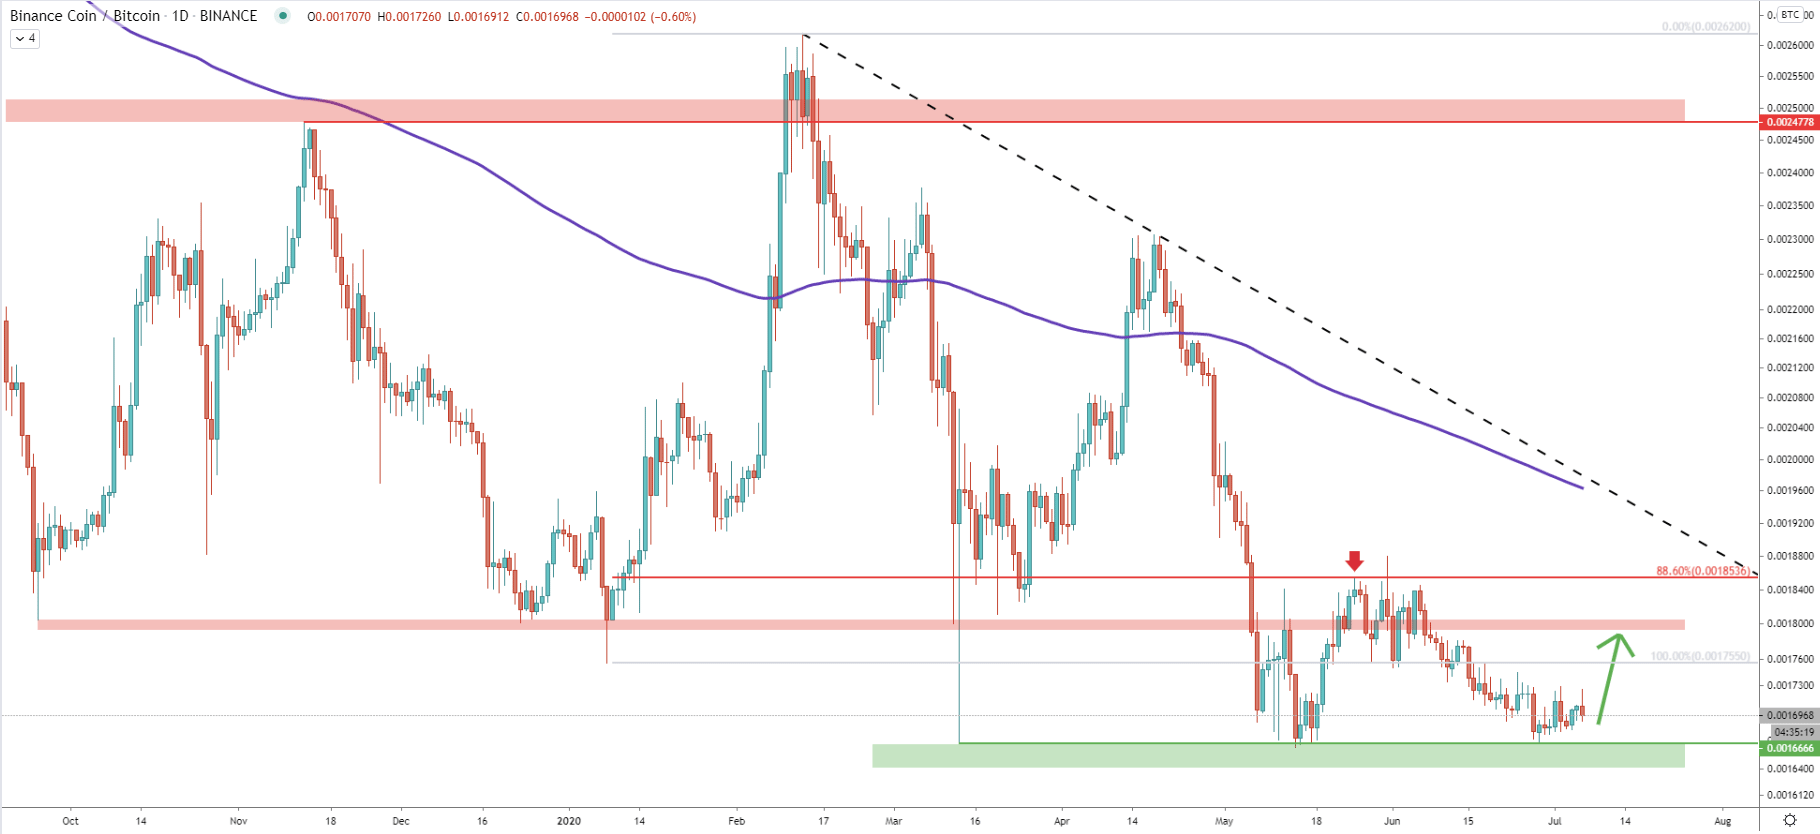
On the Daily chart price clearly produced a triple bottom at BTC 0.0016666, suggesting extremely strong support in this area. It also shows that bulls are heavily defending this price, which eventually should result in a strong move up, as long as the support is respected.
But before/if the long term uptrend will start, there are several resistance areas that must be taken out. The first one is near BTC 0.0018000, which previously acted as a strong demand zone. The second resistance is 88.6% Fibs applied to the last uptrend, which is located at BTC 0.0018536. Previously price rejected this resistance cleanly, and if the price will move up, it will most likely act as the resistance once again.
To summarise, on the daily chart, we might witness a huge range-trading, between BTC 0.0016666 support and 0.0018536 resistance. And only Daily and Weekly close above the resistance should confirm the beginning of a stronger move to the upside.
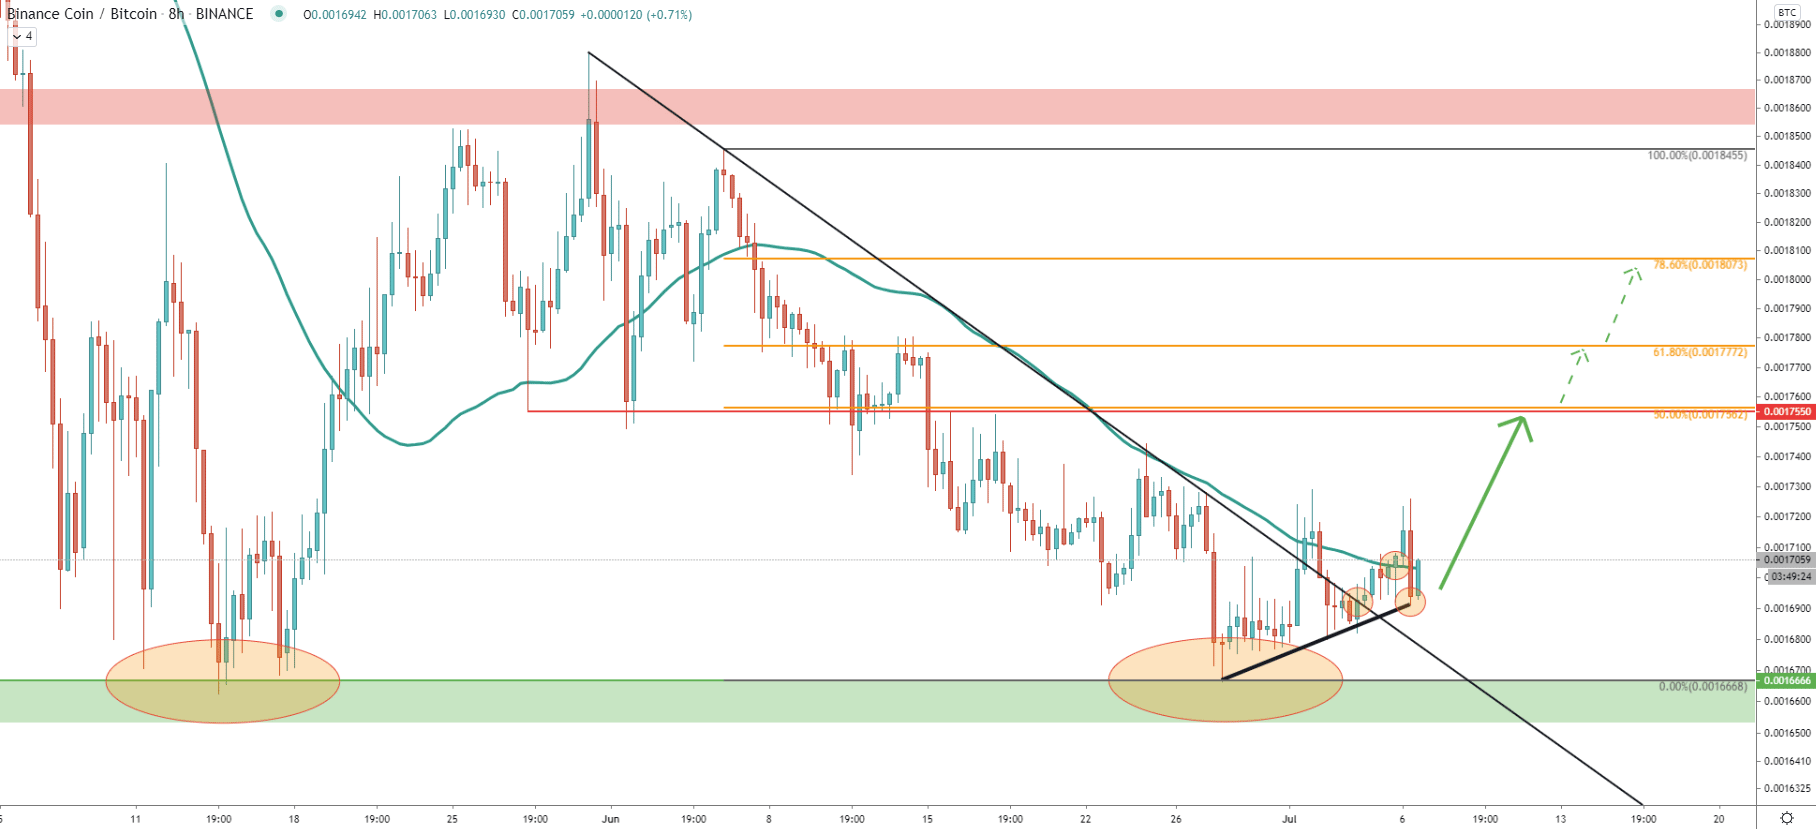
On the 8-hour chart, after bouncing off the support, price continued to move up, while rejecting the uptrend trendline. BNB/BTC broke above the downtrend trendline and then above the 50 Exponential Moving Average. These are some strong bullish indications and on this chart, we have 3 potential upside resistance levels.
The first is clearly at BTC 0.0017562, which is a previous supply/demand level and is confirmed by 50% Fibonacci retracement applied to the current downtrend. If it will get broken, the Binance coin is likely to test 61.8% Fibs at 0.0017772 or 78.6% Fibs at 0.0018073.
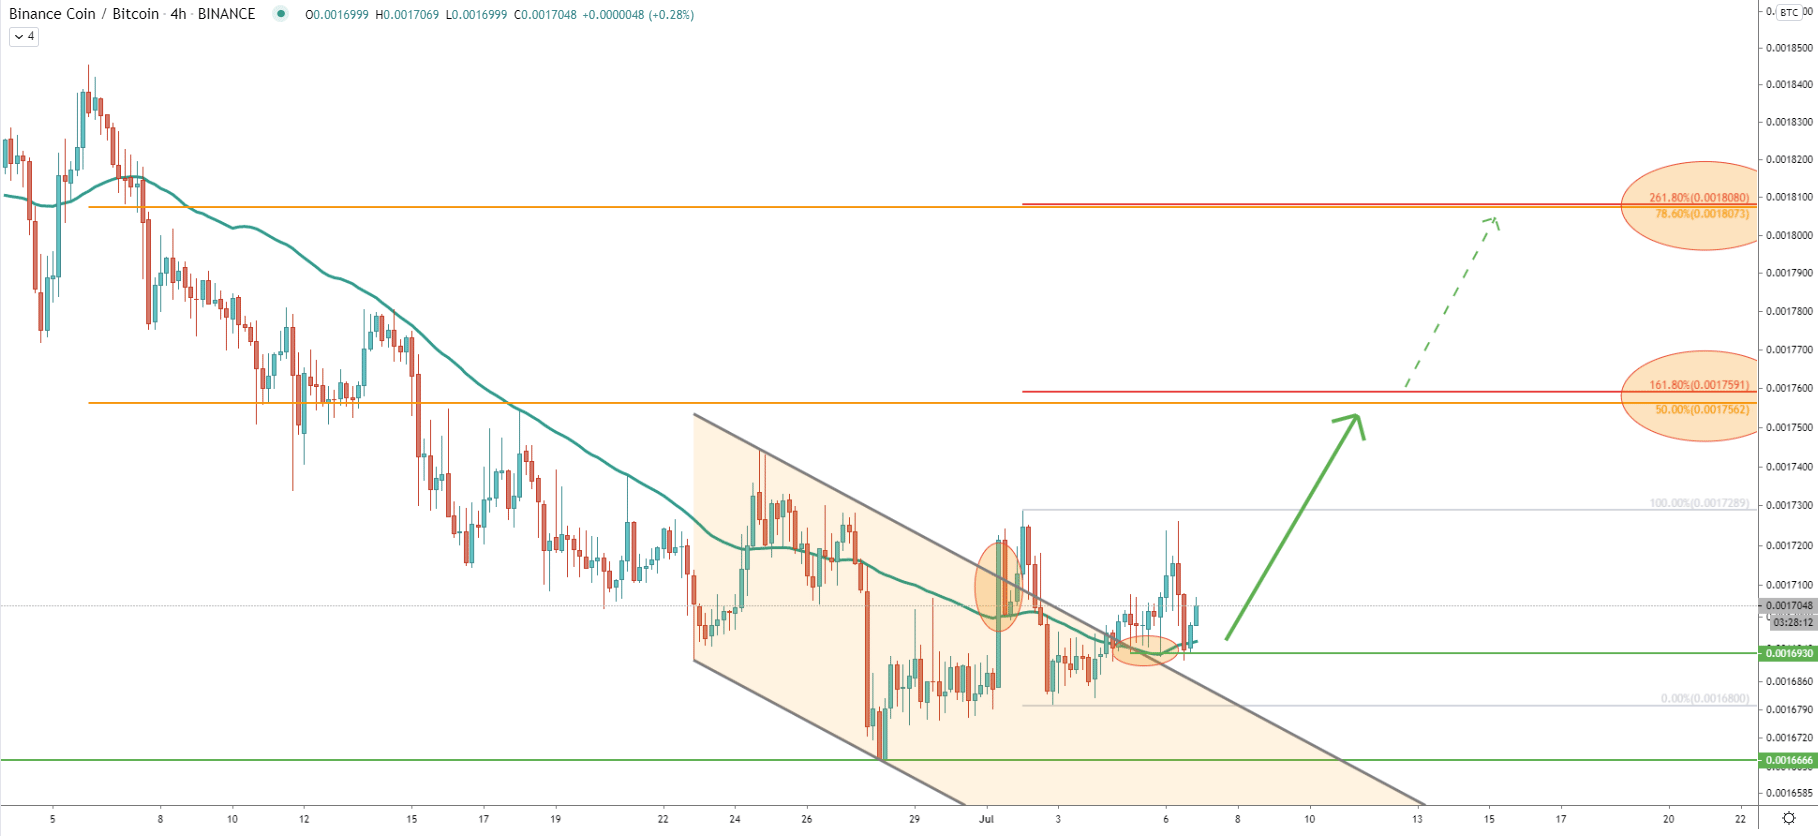
On the 4-hour chart, the price broke above the descending channel and 50 EMA almost at the same time. Right now, the support has been found at BTC 0.0016930, where previously 50 EMA was rejected. At the same time, the upper trendline of the channel is currently acting as the support, and perhaps it is the starting point of another wave to the upside.
It seems like there are only two very important resistance levels in the short term. The 50% and 78.6% Fibs as per the 8-hour chart. On the 4-hour chart, these levels are also confirmed by 161.8% and 261.8% Fibs applied to the corrective wave down after breaking above the channel.
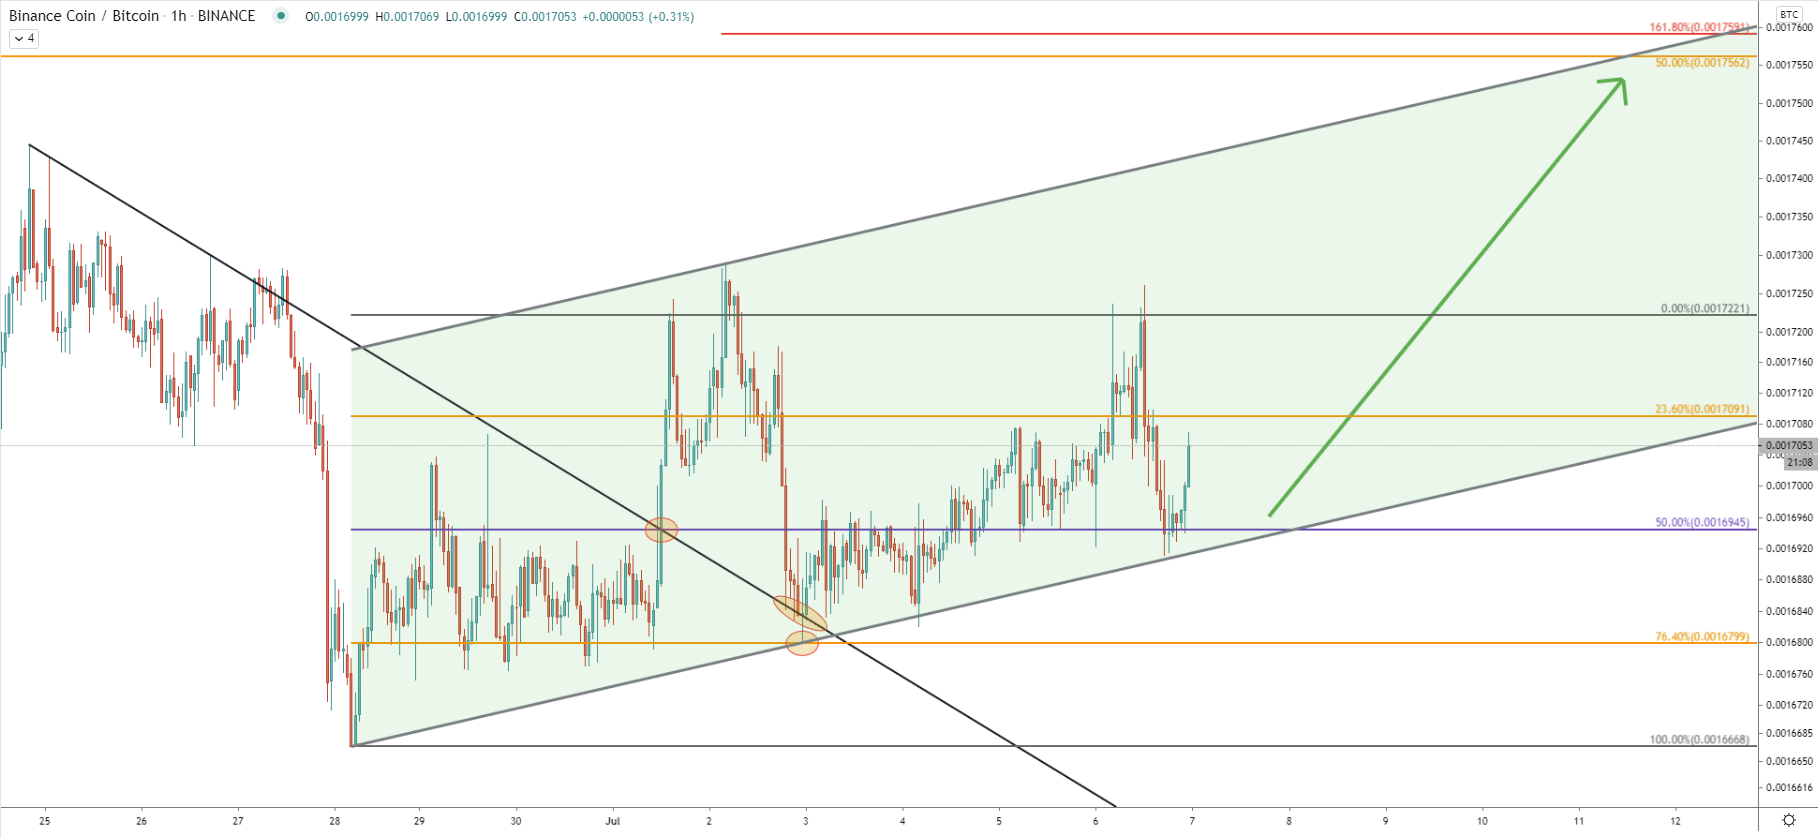
On the hourly chart, price continues to trade within the ascending channel, while rejecting the uptrend trendline. We can also see that BNB/BTC broke above the downtrend trendline, and on the correction down cleanly rejected 76.4% Fibonacci retracement level at BTC 0.0016799. This Fibonacci retracement indicator was applied to the breakout point of the downtrend trendline so that 50% is placed at the breakout level. It also shows that currently, the Binance coin remains right at the 50% Fibs, which clearly acting as strong support. And finally, the nearest resistance area clearly corresponds to the upper trendline of the ascending channel, which shows that price might get there by the end of this week.
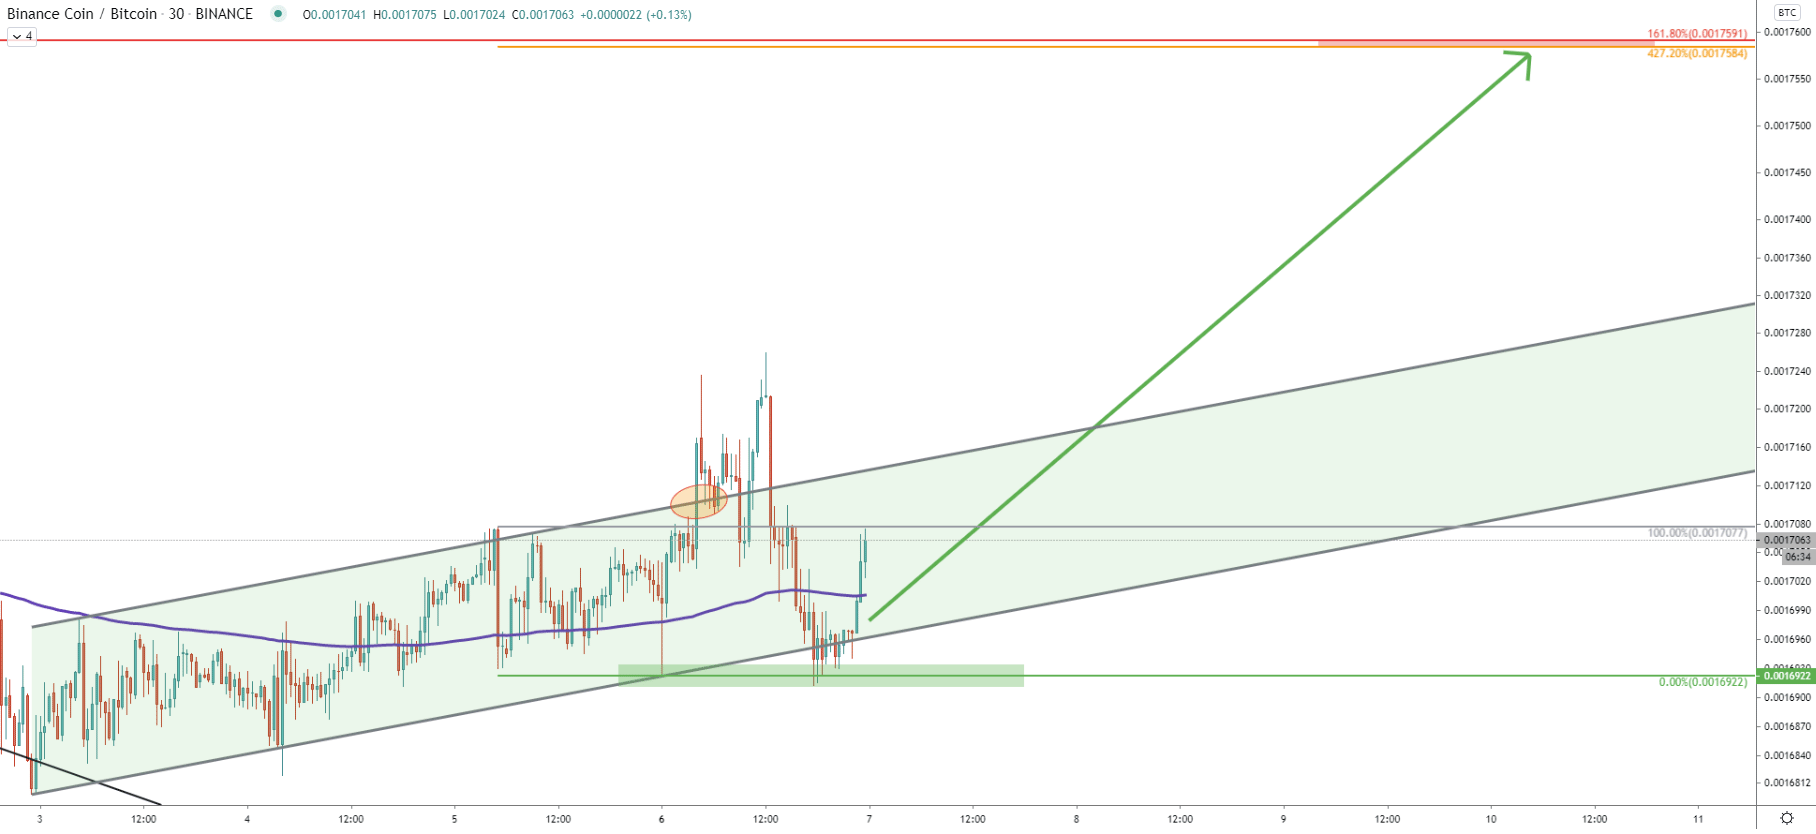
On the 30-minute chart, there was a break above the ascending channel, which shows strong demand for the Binance coin, at least in the short term. After the breakout rice pulled back sharply, potentially providing yet another buying opportunity. On this chart, we have applied the Fibonacci retracement level to the last point of rejection of the uptrend trendline. It shows that 427.2% Fibonacci retracement level almost exactly corresponds to the BTC 0.0017591 resistance area.
The Binance coin is rejecting multiple support levels and indicators and continues to break higher and higher. This could be the potential beginning of a long term uptrend, but only if all short to medium term resistance levels will be broken.
As per the 4-hour chart, there are 2 major resistance levels, each of which is confirmed by 2 Fibonacci retracement levels. These are BTC 0.0017550 and, BTC 0.0018073
As already been mentioned, currently price remains at the key support area, where BTC 0.0016912 low has been tested. If there will be Daily break and close below this level, the uptrend probability will become extremely low, and price can be expected to move down to test the key support area near 0.0016666
Support: 0.0016930, 0.0016800, 0.0016666
Resistance: 0.0017550, 0.0017772, 0.0018073