Published: March 18th, 2025
Following its performance, BNB emerged from an inverted Head and Shoulders pattern, as noted by some crypto enthusiasts. In addition, The BNB Chain has outpaced Solana's decentralized exchange (DEX) volume over the last day, the expert noted, which may support the token's surge to retake the $640 mark. "Once that occurs, BNB will quickly reach a new ATH," he said.
DeFiLlama data indicates that BNB Chain's volume of trading surpassed Solana's $1.07 billion on March 16 with a spike to $1.64 billion on Sunday. Over earlier times week, the network's DEX trade volume has also risen by 13.27%, placing it third.
Its recent meme coin craze, stoked by coins like Mubarak (MUBARAK), appears to be the cause of the spike. The token's worth has increased by 99% in the last day, and its exchange volume has reached almost $300 million in the last 24 hours.
As a result of the collapse of the Argentina-backed LIBRA coin and the efficiency of TRUMP and MELANIA, the US President and First Lady's memecoins, cryptocurrency investors have been feeling pessimistic about Solana's network.
Can BNB take the chance to create a bull run? Let's see the complete outlook from the BNB/USDT technical analysis:
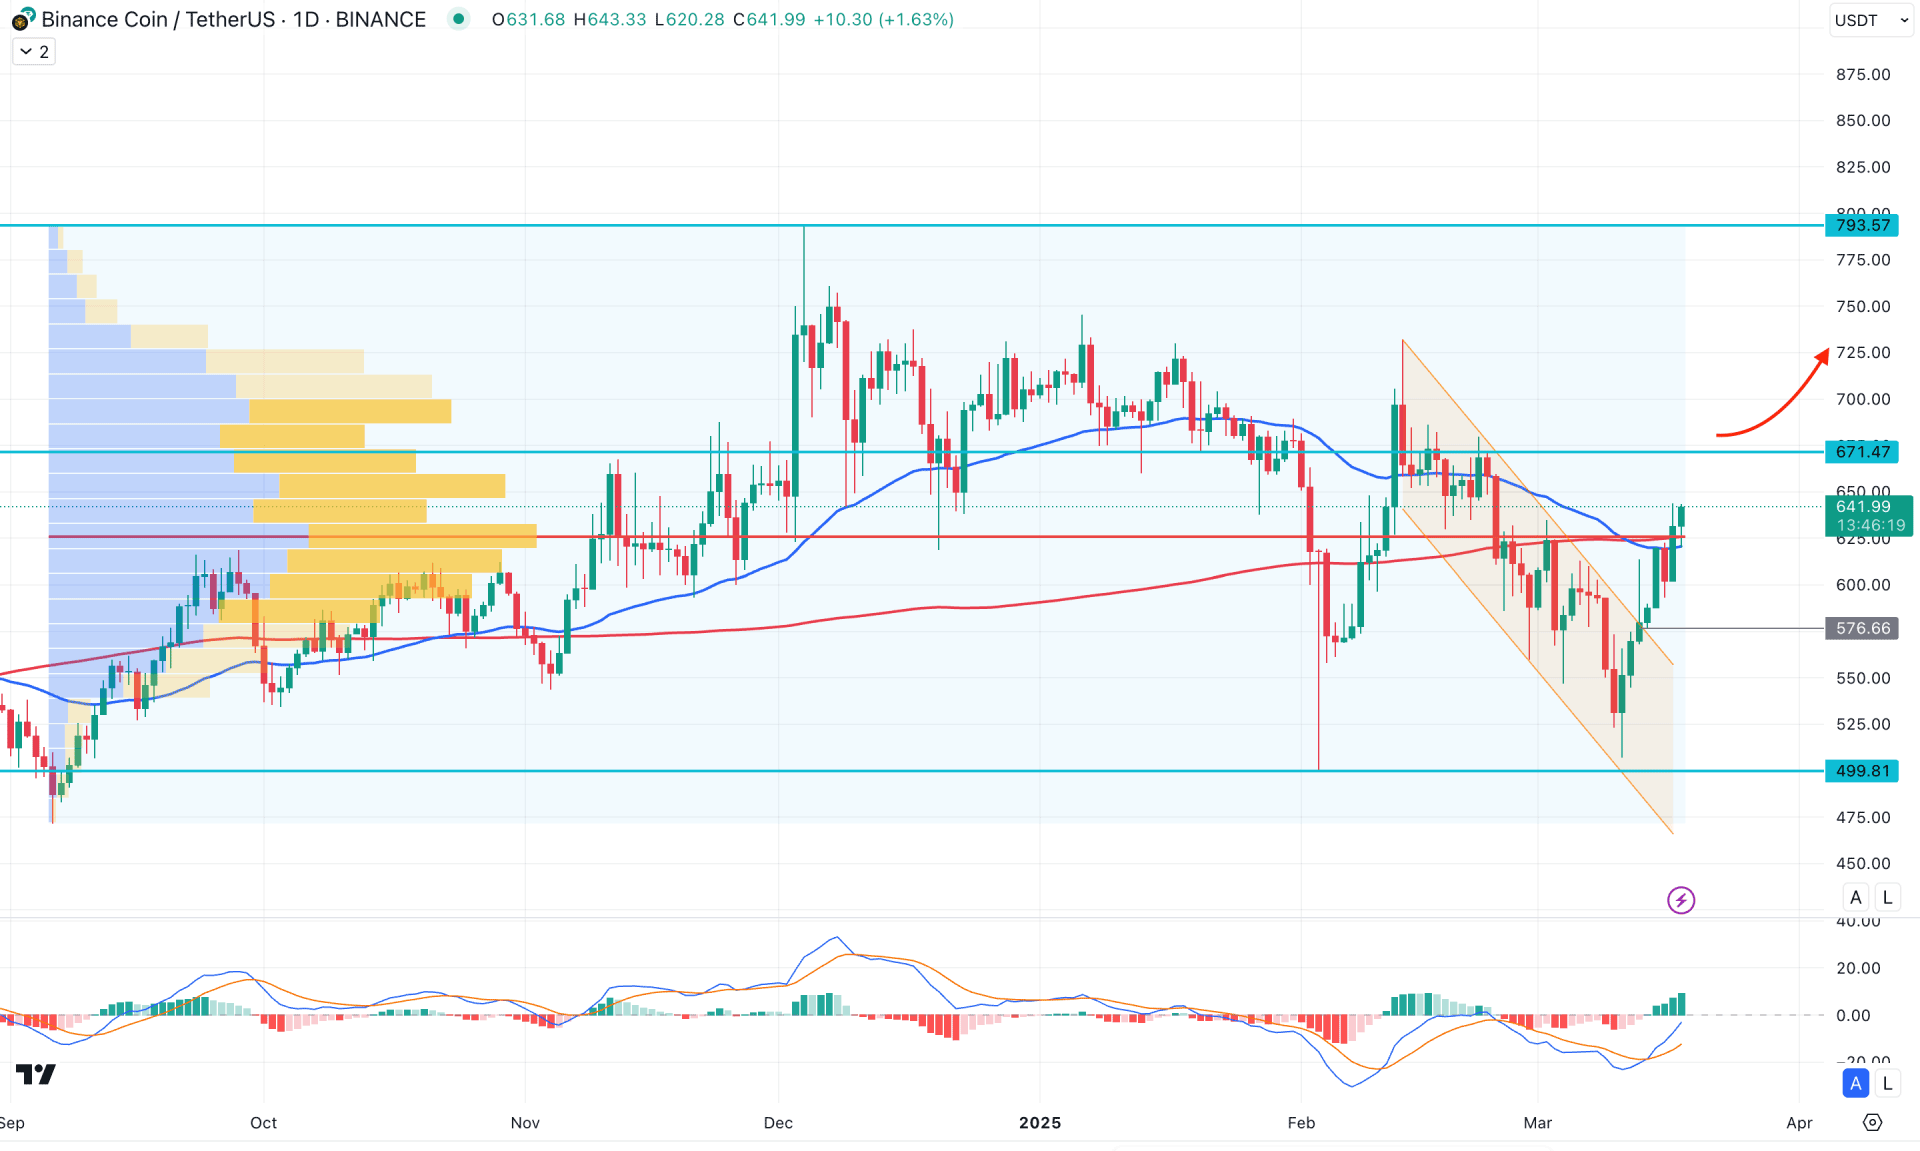
In the daily chart of Binance Coin (BNB/USDT), the broader market momentum is bullish, as no significant lower lows have been seen in the last six months. In this case, the primary aim would be to look for long trades from any suitable bottom area.
However, analyzing the higher timeframe outlook and aligning it with the daily chart would provide a better view of the market. Looking at the monthly time frame, the price is trading bullish after two consecutive bearish months. The price rebounded lower but failed to breach the February 2025 low. However, the current price is trading above the March 2025 opening, and a continuation is likely to happen. In the weekly timeframe, a bullish reversal has formed, sweeping liquidity from the 546.77 weekly low. In this case, an upward continuation requires a minor downside correction with a bullish reversal from a suitable price area.
Looking at the volume structure, the most active level in the last six months is just below the current price. A bullish daily candle has already formed above the high volume line before creating a bearish inside bar. In this case, an upward continuation is possible as long as the high-volume level remains below the current price.
In the daily structure, the moving average convergence divergence (MACD) shows a potential bullish opportunity from a signal line crossover at the bottom. The histogram has been moving higher for over a week, staying above the neutral point. As the signal line has more room to move upward, we can expect the price to follow the rally and move beyond the key resistance area.
The 200-day Simple Moving Average is below the current price, as the recent daily candle managed to close above it. However, the 50-day Exponential Moving Average is below the 200-day SMA, but there is no sign of a downside continuation.
Based on this outlook, investors should remain cautious and find long opportunities as the recent descending channel breakout needs to be validated after forming a downside correction. On the other hand, the overbought price above the dynamic lines could create an immediate price reversal, especially if a bearish daily candle forms below the 50-day EMA. In that case, a downside continuation opportunity will open, aiming for the 500.00 psychological level.
On the other hand, further bullish pressure needs to hold the price between the 650.00 to 650.00 zone. Any minor bottom formation with a bullish reversal above the 671.47 level could open a conservative long opportunity, aiming for a new all-time high.
However, any bullish reversal from the 600.00 to 576.66 support level could be an aggressive approach, with the primary aim being to test the 671.47 level.
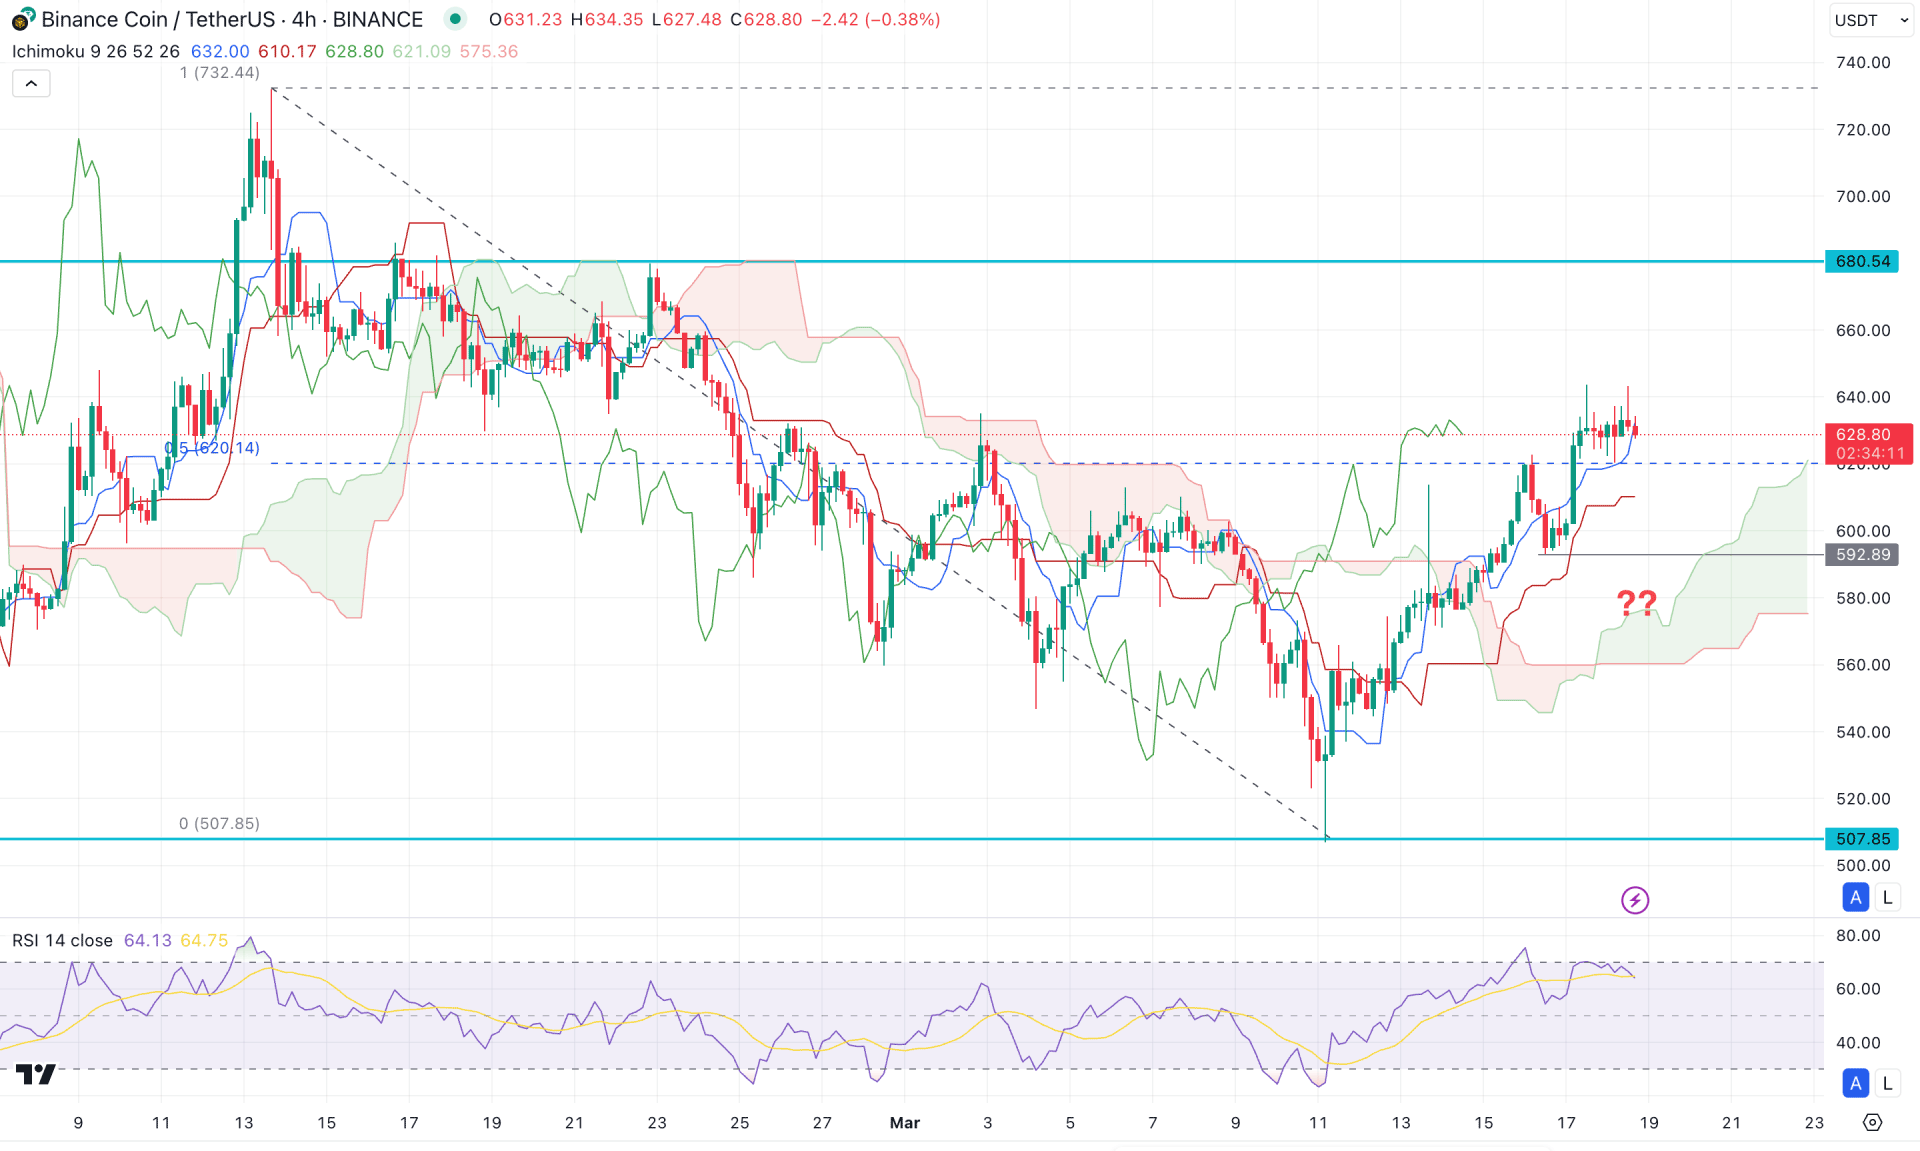
In the four-hour timeframe, the recent selling pressure from the 732.44 top has found a bottom at the 507.85 level, from which a fair decent recovery has occurred. As the current price is hovering above the 50% Fibonacci retracement level of the existing price swing, we may consider it a premium zone from an intraday perspective. Although the major market trend remains bullish, a minor downward correction is still pending, according to the readings in the H4 timeframe.
After forming a descending channel breakout, the price has stayed above the Kumo cloud area for a considerable time frame. Moreover, an internal swing low was formed at the 592.89 level before making a new swing high at the 644.03 level. As both lines are above the Kumo cloud, which serves as a support for the future cloud movement, a potential bullish continuation could occur once the correction is over.
Based on the current market outlook, the price has reached the premium zone, and the Relative Strength Index is showing an overbought condition. In this case, investors should closely monitor how the price reacts at the dynamic support level. A failure to hold the price above this level could find a bottom in the cloud area. However, any bullish recovery from the 608.08–607.50 range could present a potential opportunity, aiming for the 740.00 area.
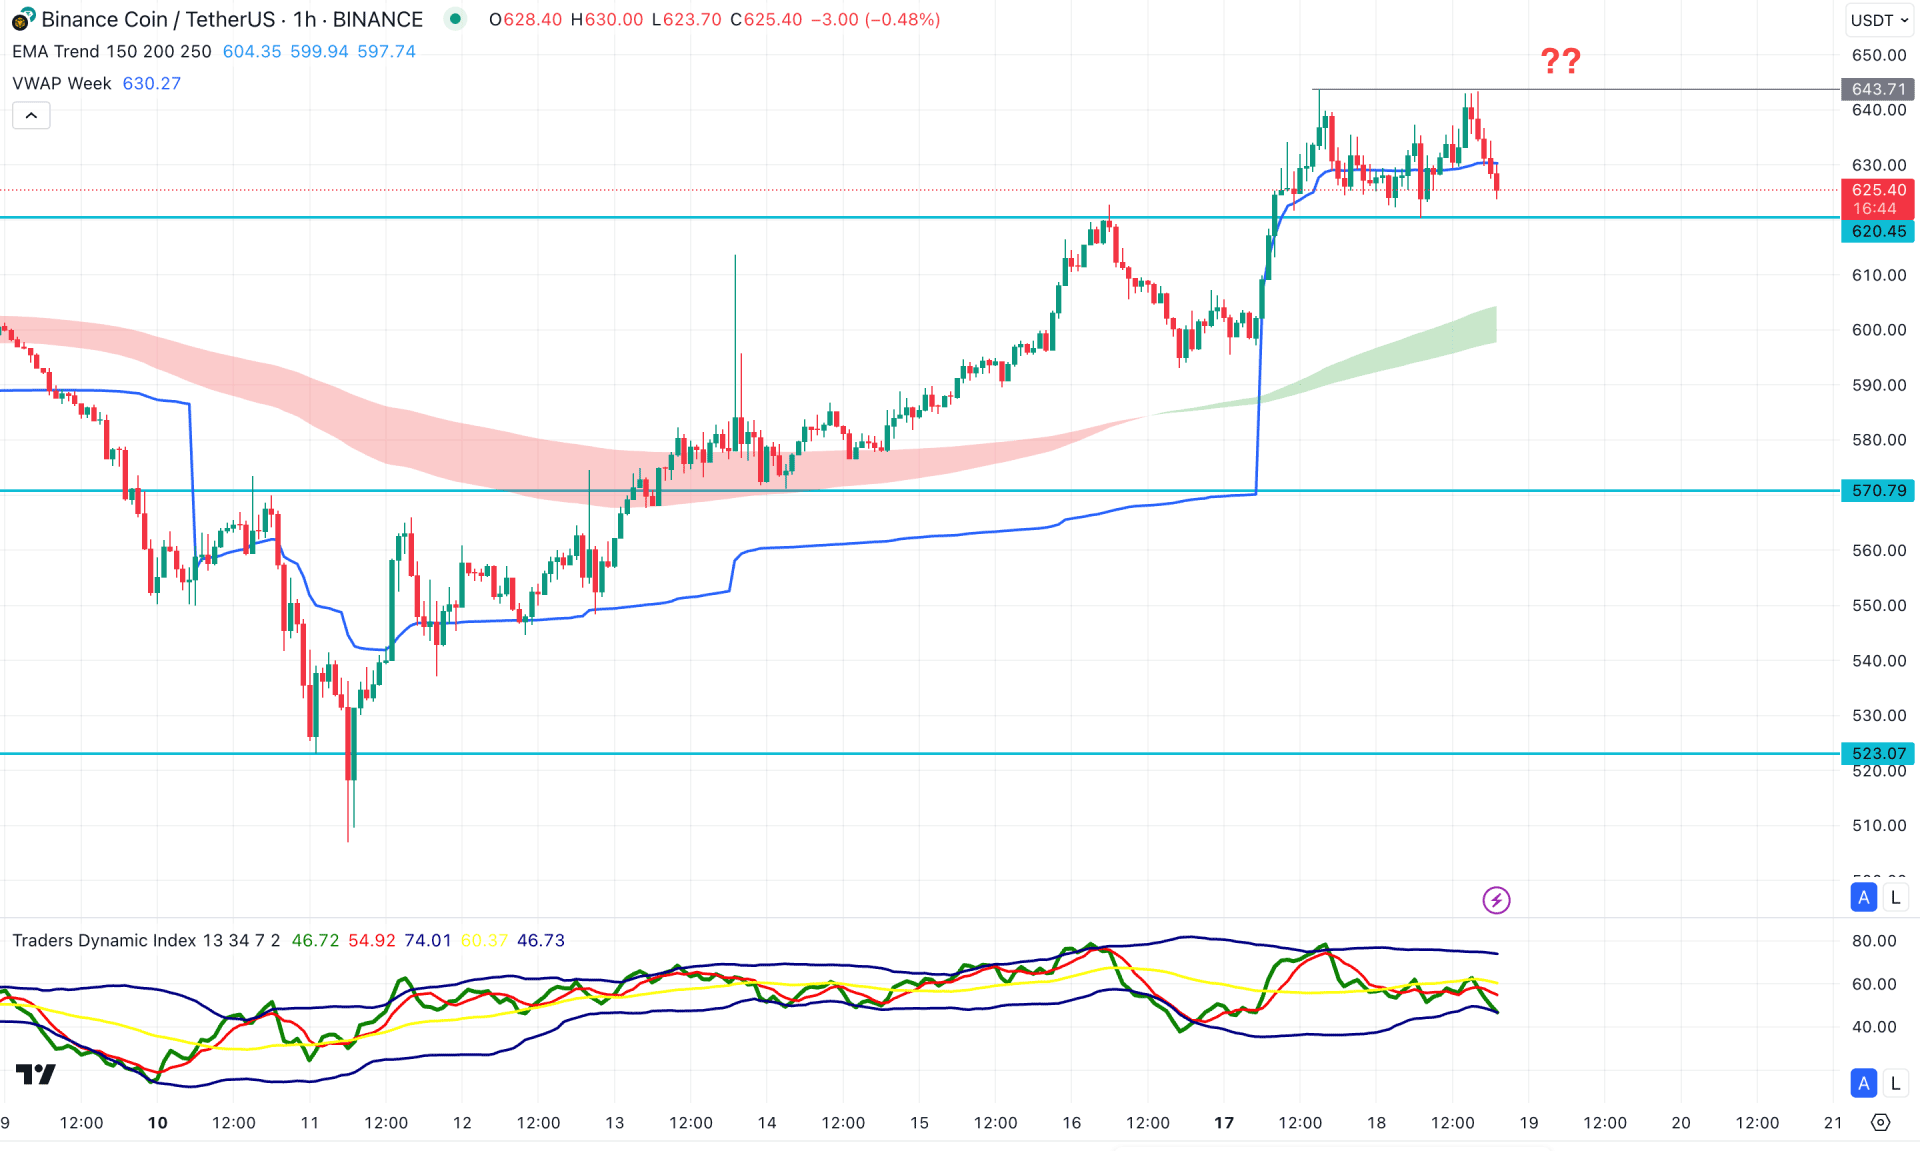
In the hourly time frame, the ongoing market momentum is bullish where a minor selling pressure is visible from the potential double top formation.
On the other hand, the Moving Average wave is still below the current price with a bullish slope. As the current price is hovering between weekly VWAP and MA waves, we may expect more downward correction before following the major trend.
Based on this outlook, a bearish hourly candle below the 620.45 level could validate the double-top pattern. In that case, the price could be lowered, and support from the Moving Average wave area could be found.
On the other hand, any immediate bullish recovery above the weekly VWAP line could resume the major trend above the 650.00 level.
Based on the current market structure, BNB/USDT is more likely to extend the major bullish trend after a stable market above the 200-day Simple Moving Average line. A bullish recovery above the intraday resistance line with counter-impulsive pressure could be an early, long opportunity for this pair.


