
Published: November 2nd, 2022
In the last 72 hours, the Binance token (BNB) surged following Elon Musk’s Twitter acquisition completion. Since mid-August, $BNB represented the best output and reached $334.38, as per Coinmarketcap.
When Elon Musk’s Twitter takeover deal hit the media last Friday, rumors spread that Binance had a contribution of $500 million on that course.
Consequently, before word from Changpeng Zhao, Binance's CEO, speculation was unflinching about Binance’s insolvency. In May, Binance’s participation in the Twitter acquisition was revealed first, as an SEC filing listed Binance as an entity of those nineteen that Musk worked with.
However, the Twitter acquisition deal completion shouldn’t take all the blame for the sudden $BNB surge. It would be reasonable to state that the recent $BNB surge upside occurs due to many efforts from Binance.
The Crypto Exchange announced the 21st $BNB burn completion about two weeks ago, which comes off the Pioneer Burn program. The $BNB interval burning target reduces the token's circulation volume to increase price stability.
Let's see the future price direction of Binance coin from BNB/USDT technical analysis:
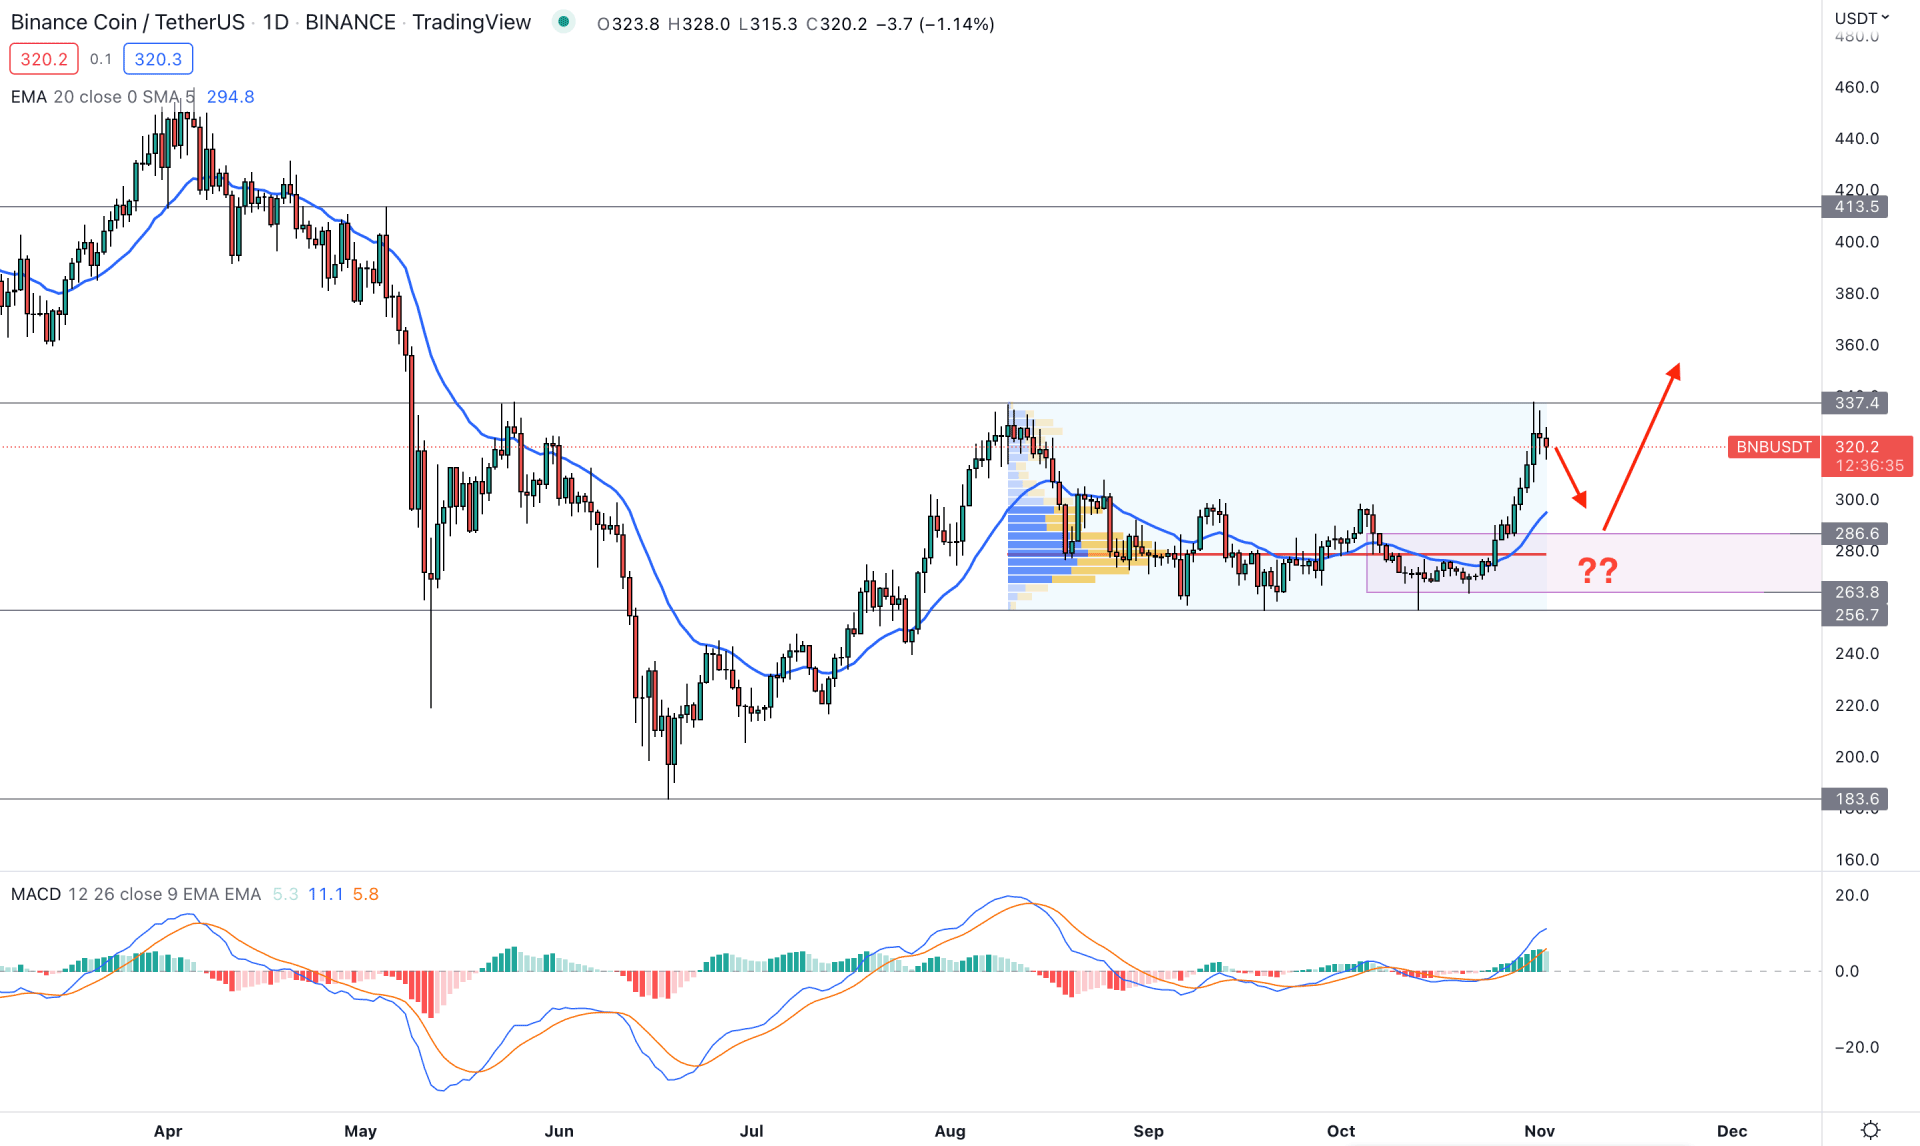
In the daily chart, the Binance token showed a massive consolidation after a bearish trend, which could be an order-building process before the trend change.
After reaching the 183.60 swing low, the selling pressure in this token has become weaker as bulls showed an immediate recovery to the 337.40 level with a double top formation. Later on, bears continued pushing the price lower but ended up with a rectangle pattern.
In the most recent chart, the buying pressure from the 263.80 level was impulsive, which created a strong breakout above the 20-day Exponential Moving Average. Moreover, the MACD Histogram showed a similar momentum by moving beyond the neutral level. MACD EMA lines are also above the neutral point, with more room to show buying pressure.
Interestingly, this token's recent buying pressure failed to breach the 337.40 swing high. Instead of making a new swing high, the price was rejected from the level and formed an indecision candle.
Based on the recent rejection from the 337.40 high, the selling possibility is potent, following the mean reversion to the 20 DMA support. However, an immediate breakout and a daily candle above the 340.00 level could create impulsive buying pressure in this token.
The conservative buying approach is to wait for the price to come back to the demand zone and form bullish rejection candlesticks. In that case, the buying possibility is valid as long as the price trades above the 256.70 support level.
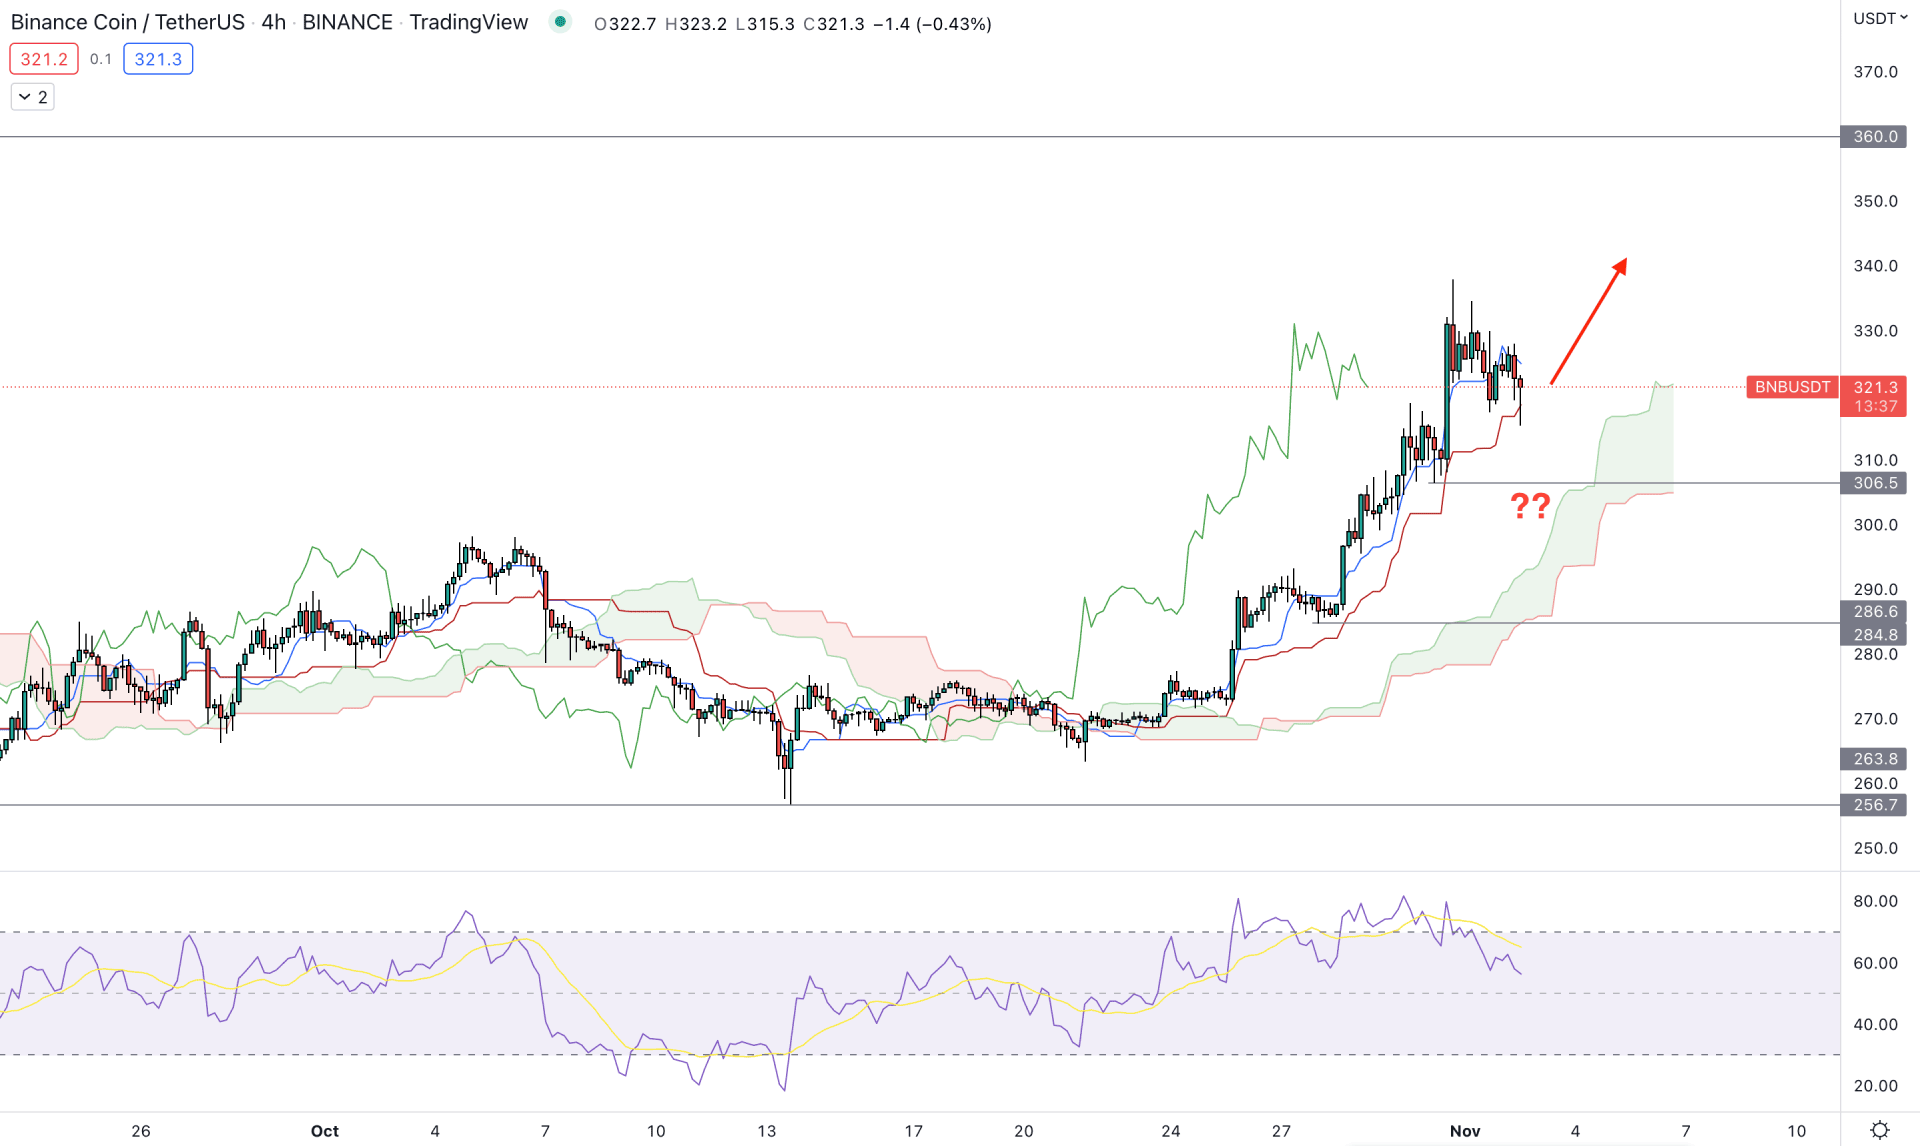
In the H4 chart, the broader outlook of BNB is bullish, as the current price has been trading above the Kumo Cloud for a considerable time. Moreover, the buying pressure above the Cloud support is solid as it came by forming new demand zones.
In the future cloud, the Senkou Span A and Senkou Span B showed upward pressure. Moreover, the Senkou Span A, representing short-term traders' sentiment, is ahead of the Senkou Span B. In that case, the buying possibility is solid until there is a bearish crossover in the future cloud.
In the indicator window, the Relative Strength Index (RSI) showed a rebound from the 70% overbought area, which is a sign of a bearish correction in this instrument.
Based on the H4 structure, any bullish rejection from the dynamic Kijun Sen or static 306.50 level could open a long opportunity, targeting the 360.00 level. However, the bearish pressure with an H4 candle below 306.00 could increase the selling pressure toward the 286.60 area.
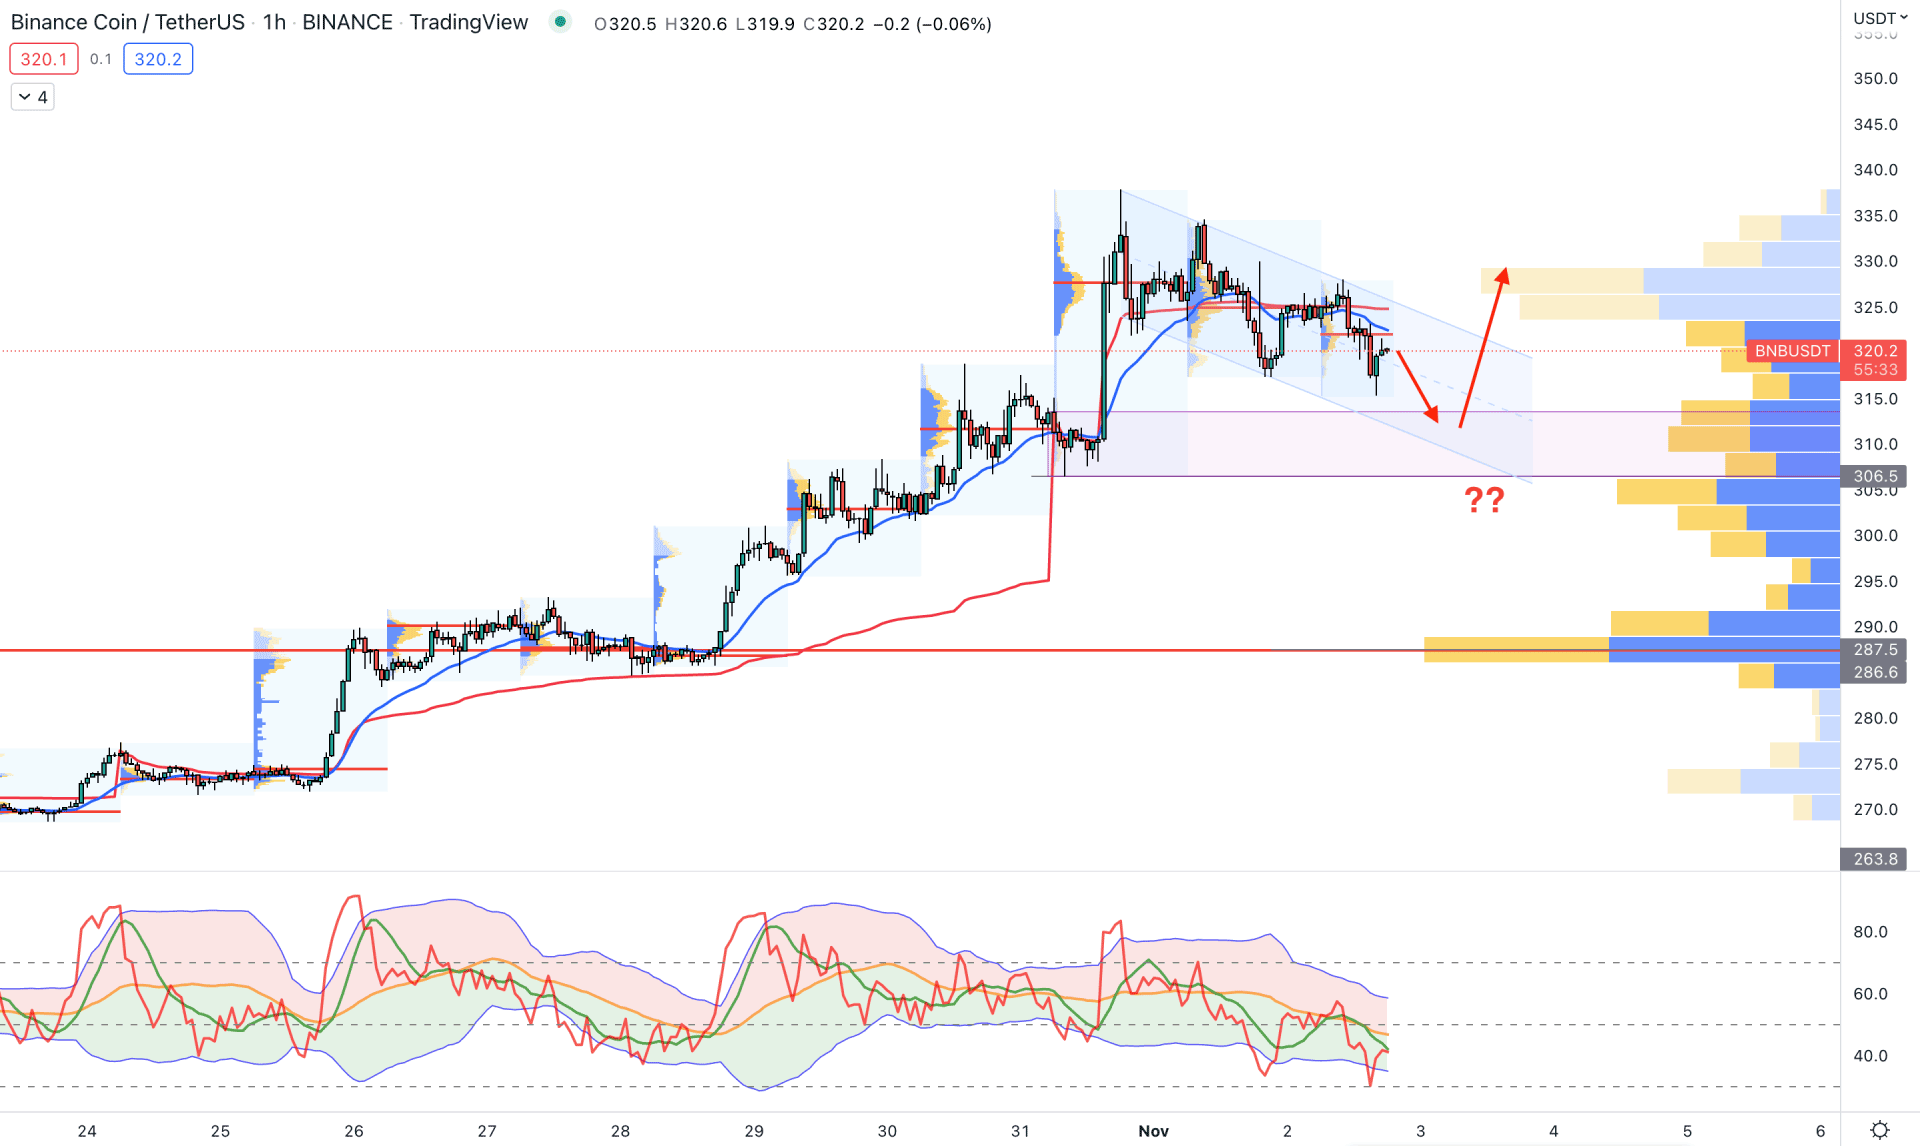
Although the daily price found resistance and formed indecision candles, the hourly chart is still bullish. In that case, bulls may regain the momentum until making a new swing low.
In the hourly chart, the 20 Exponential Moving Average and weekly VWAP are above the price, which needs to be recovered before continuing the bullish trend. The visible range high volume level is at 287.50, which is the ultimate area for bulls.
In the near-term area, the price is trading in a descending channel formation where the immediate support level is at 306.50 level. Therefore, any bullish rebound and a channel breakout could be a decent bullish opportunity, targeting the 360.00 level.
On the other hand, breaking below the 306.00 level could decrease the price towards the 287.50 high volume level.
Based on the current price behavior, BNB/USDT is more likely to extend the bullish pressure in the coming days. However, a minor selling pressure is still pending in this pair, which could offer to join the bull rally from a discounted price.


