
Published: January 7th, 2026
In the last week, major cryptocurrency holders transferred over $2.4 billion in Ether and Bitcoin to Binance; the flow was nearly equal between the two coins. Individual deposits have increased dramatically, according to CryptoOnchain, with typical transactions onto the exchange rising from 8-10 Bitcoin to highs of 22 to 26 Bitcoin.
Withdrawals have decreased concurrently; the Exchange Outflow Mean is reported to be around 5.5 and 8.3 Bitcoin. This behavior change indicates a move away from storing currencies in long-term preservation and toward keeping marketable balances on the platform.
According to sources, the switch to Binance failed to result in increased purchasing power. With a $42 million inflow for the week, stablecoin total flows remained practically steady. According to analysts, this figure primarily represented token exchanges between Ethereum and Tron instead of fresh money coming into the cryptocurrency space.
Investors and traders will be keeping an eye on whether stablecoin imports increase or whether whales truly press sell. The accumulation by year's end was not reversed by US President Donald Trump's previously mentioned pro-crypto position, and gains may be restricted and transient until buyers resume in force.
Let's see the further outlook from the BNBUSDT multi-timeframe analysis:
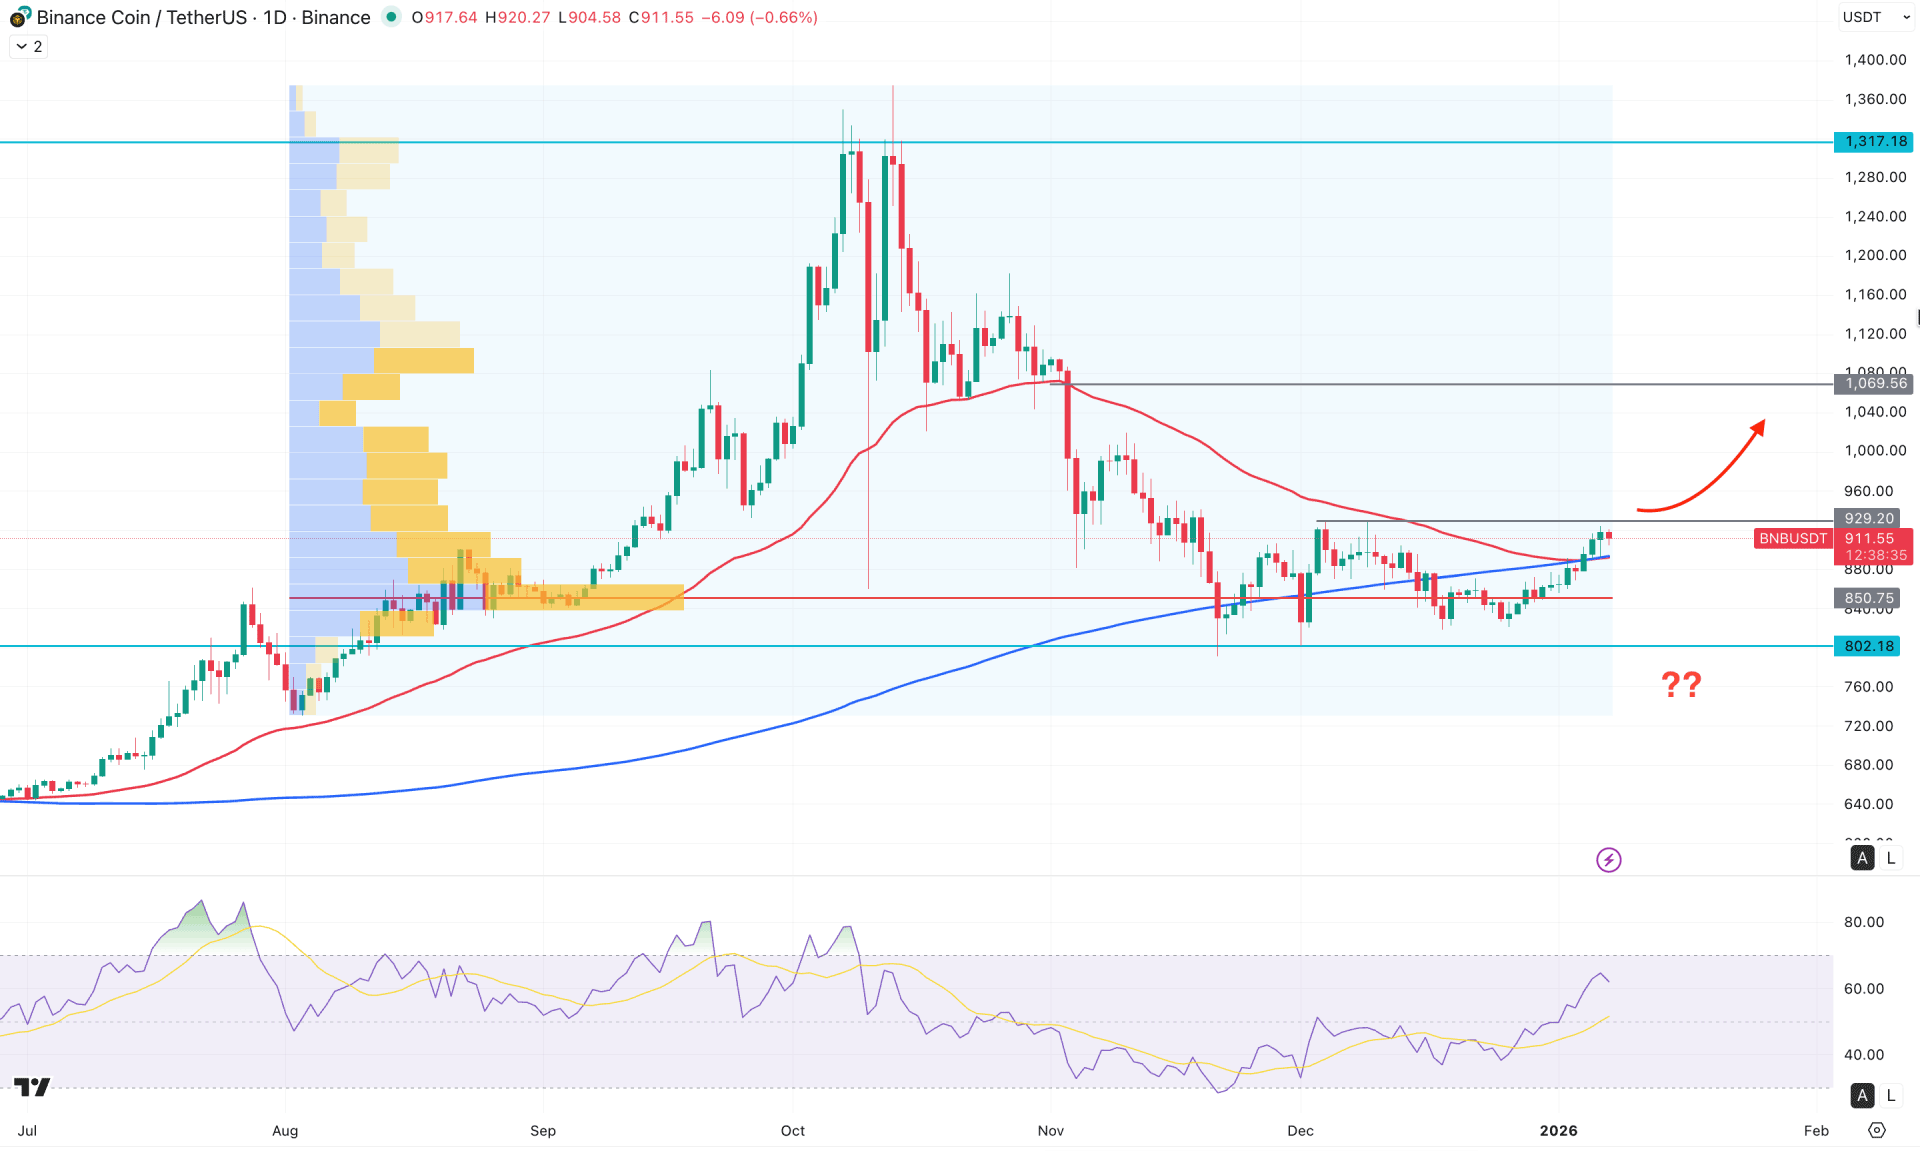
In the daily chart, BNBUSDT has formed a pump-and-dump structure, with the current price trading near a crucial support zone. A bullish rebound from this area could offer a favorable risk-to-reward ratio; however, valid price action is required before confirming a trend reversal.
Looking at the higher timeframe, the major market trend remains bullish, as the most recent monthly candle is trading above the December 2025 high, followed by a gravestone doji breakout. Overall, the bullish continuation remains intact as long as the price stays above the 855.18 monthly low.
The weekly chart shows a similar structure, where the pump-and-dump pattern is evident. As the price is currently trading within a rectangle pattern, a valid breakout could initiate a more stable trend.
From a volume perspective, buying pressure remains strong, as the highest activity level since August 2025 is positioned below the current price. However, the price is trading near a critical resistance zone between 929.20, where a clear price action confirmation is required before anticipating the next directional move.
On the main price chart, multiple bullish daily signals are present above the 200-day and 50-day moving averages. This reflects strong buying pressure in the market and increases the probability of a bullish breakout.
In the indicator window, the Relative Strength Index (RSI) continues to show buying pressure, with the indicator trending upward above the 50.00 level. As long as the RSI remains above 50.00, there is a higher probability of an extension toward the 70.00 overbought level, supporting further bullish momentum in the price.
Based on the current market structure, investors should closely monitor how the price behaves within the current zone, as the 992.00 level represents the upper boundary of the existing rectangle pattern. Failure to break above this resistance, followed by a bearish daily close below the 50-day EMA, could lead to a retest of the 802.18 support level, potentially offering another long opportunity. However, sustained selling pressure below 802.18 may push the price toward the 680.00 area.
Conversely, as long as the price holds above the 50-day EMA, a daily close above the 920.00 level could strengthen buying momentum and open the path toward the 1,069.56 target.
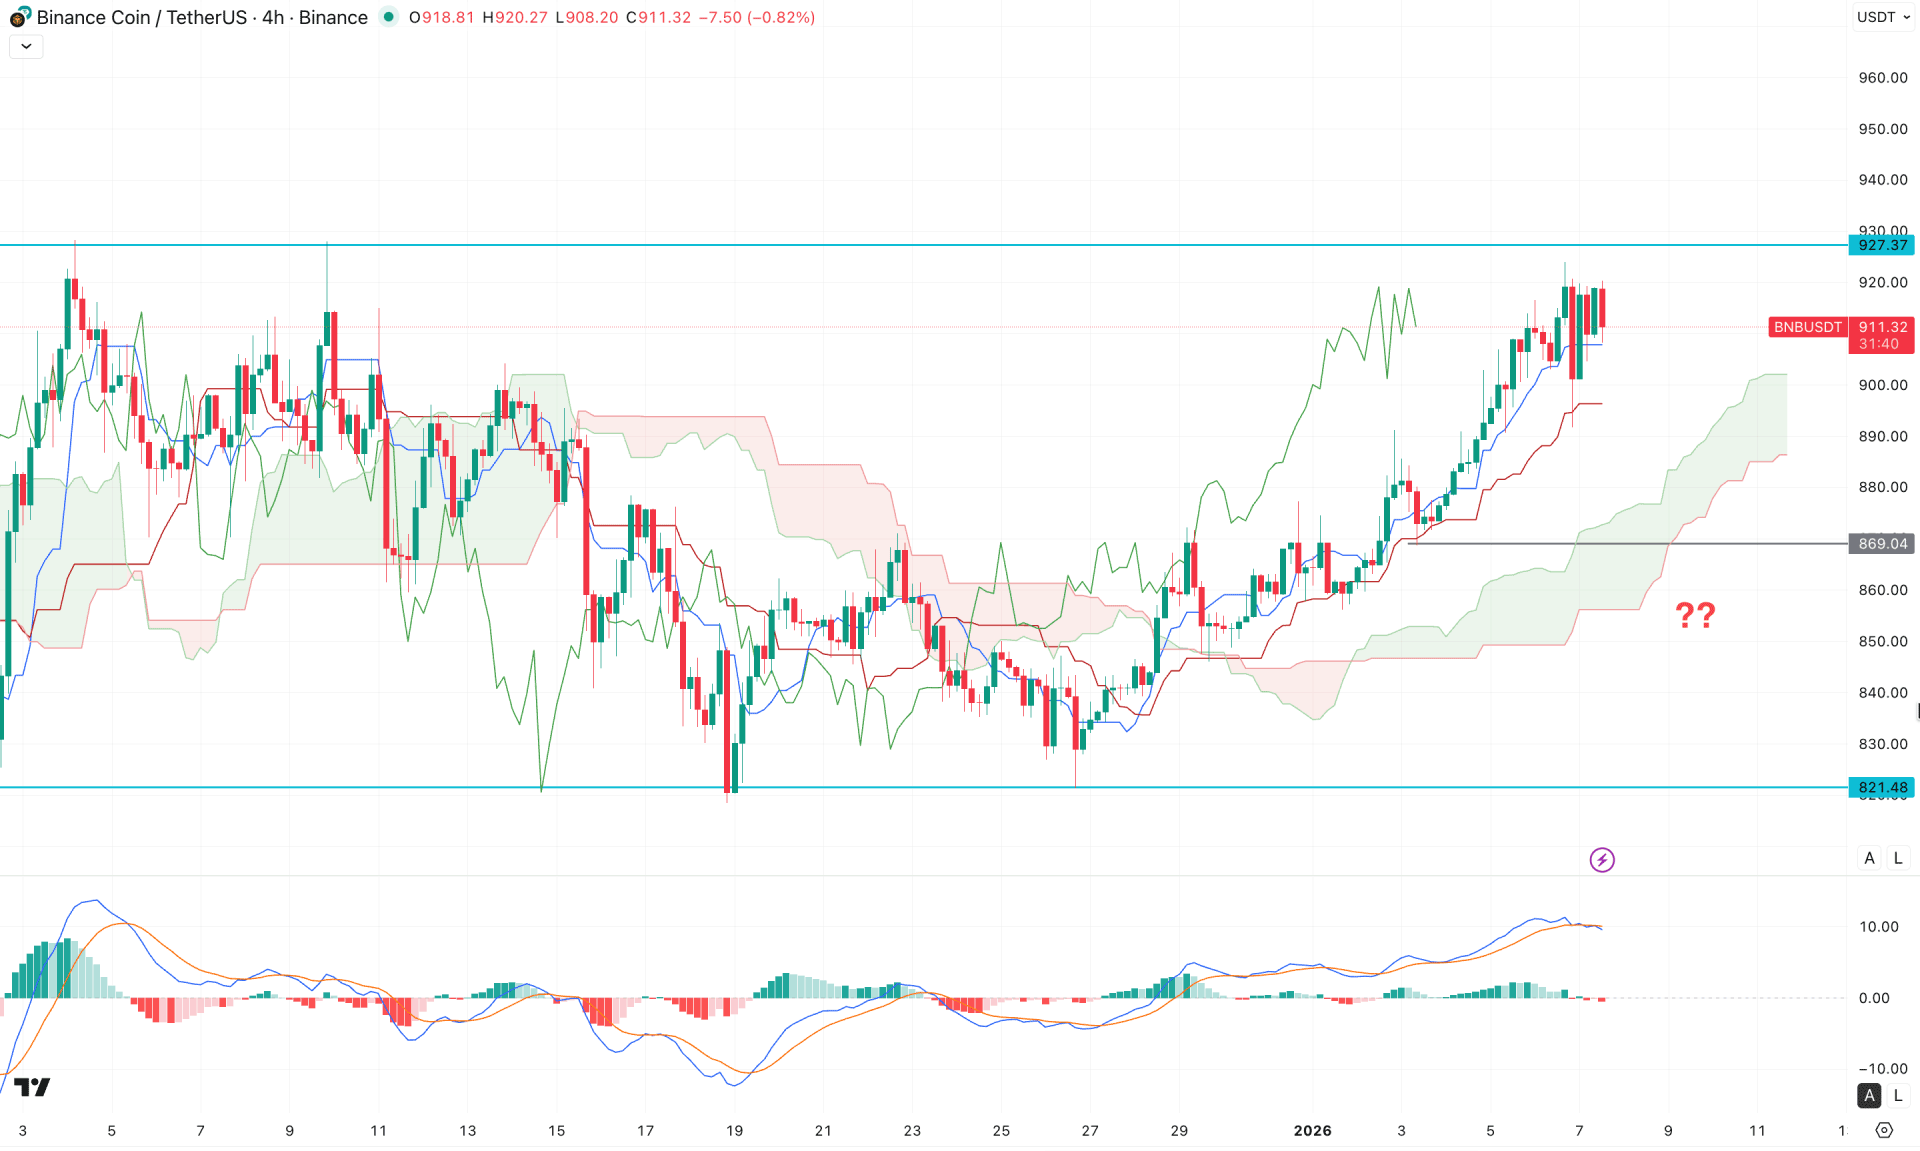
In the H4 timeframe, the current price is trading above the Ichimoku Cloud after a valid bullish breakout. Price action is maintaining buying pressure above the dynamic support line, increasing the probability of bullish continuation. Moreover, the future cloud remains supportive for bulls, as both Senkou Span lines are trending upward.
In the secondary indicator window, a different picture is emerging. Although the price continues to push higher, the MACD histogram has failed to sustain momentum around the neutral line. Additionally, the signal line has flattened near the upper peak area, suggesting a potential corrective pullback.
Based on the current market structure, bullish continuation opportunities may emerge following a healthy corrective phase. Investors should closely monitor how the price reacts around the dynamic support zone, as a valid bullish reaction from the 900.00 and 869.04 levels could present a long opportunity targeting the 1,000.00 level.
On the other hand, an extended downside correction could drive the price toward the 850.00 and 830.00 areas before offering another potential long setup. However, a strong sell-side liquidity sweep from the current resistance zone between 937.00 and 970.00 could increase bearish pressure, with the primary downside target being a retest of the 869.04 level.
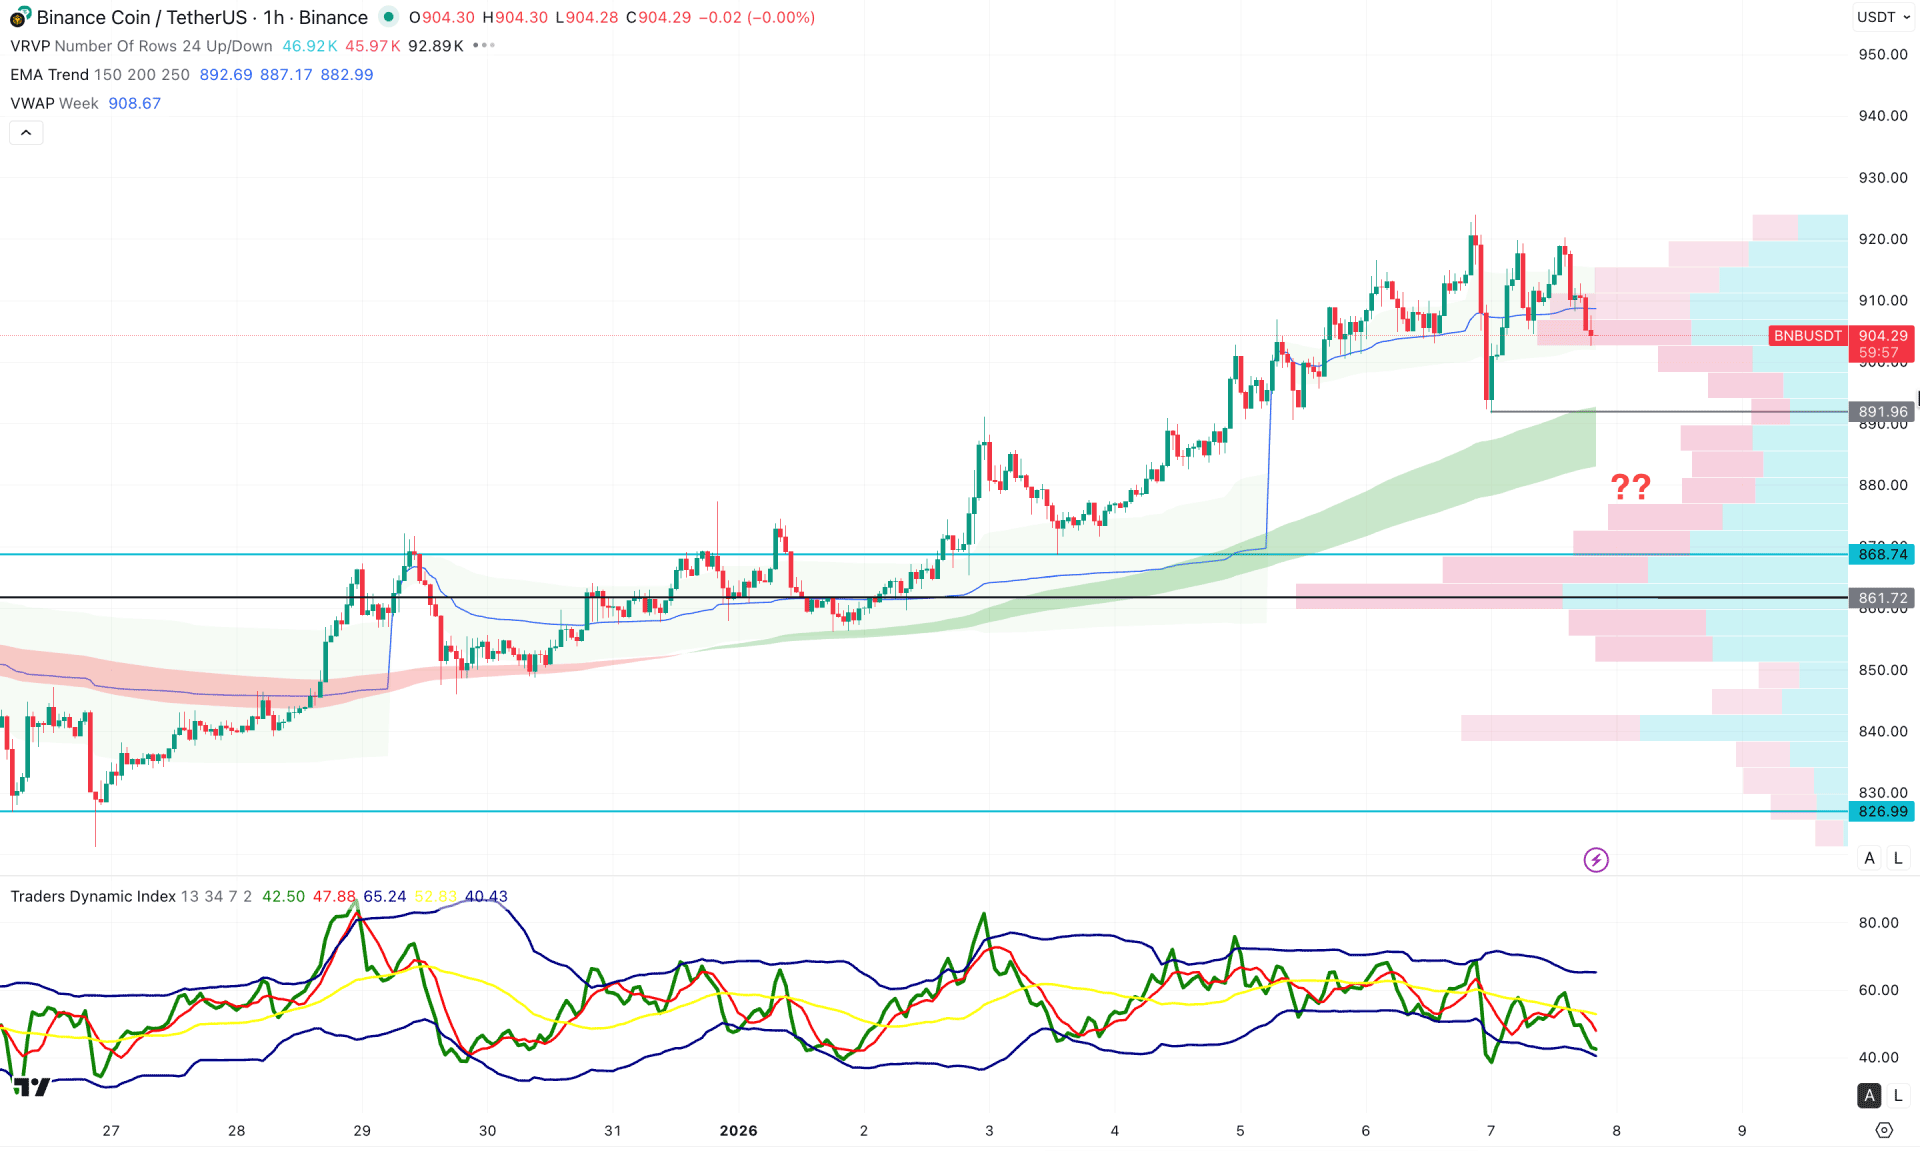
In the hourly timeframe, BNBUSDT is trading within a bullish trend as the price keeps rising without forming any significant selling pressure. The dynamic Exponential Moving Average wave is below the current price and working as a major support. Moreover, the intraday high volume is also below the current price and is working as a confluence support.
In the indicator window, the Traders Dynamic Index (TDI) shows a selling pressure as the current line is below the 50.00 line.
Based on this outlook, a downside correction is pending as the current price is trading below the weekly VWAP line. Any bullish reversal from the 895.00 to 880.00 zone could be a bullish trend continuation opportunity.
Based on the overall market structure, BNB/USDT is more likely to initiate a bullish trend once the breakout is confirmed in the daily chart. The intraday price is still bullish, from where a decent downside correction is pending before forming a long signal.


